c931cdae6001b40640e042952507a48b.ppt
- Количество слайдов: 33


The UK Housing Market: will it ever be the same again? Christine Whitehead, LSE and CCHPR, University of Cambridge 2012 – How is the System Coping Housing Studies Association Annual Conference, York, April 18 – 20, 2012

Are we witnessing fundamental structural change in the housing market? • Current crisis follows many others in the post war period – so is this simply another round? • In which case current situation can be explained by over-adjustment in both directions – which will return to underlying fundamentals over time. It is simply taking longer to adjust? • Two distinct issues: (i) is this a ‘new normal’ where structural change means the future will not be like the past and (ii) will the future be more or less volatile?

Why is the UK system so volatile? Stylised ‘facts’ • Income elasticity around 1; • Price elasticity measure less robust – issues of quality etc – but certainly negative and less than income elasticity; But issues re impact of change and rate of change in price v transactions; • Credit constrained pre-1980 s and post 2008; • Supply adjusts very slowly – annual adjustment less than 1/2% of stock – through net new building and additions to existing stock; • Long run supply elasticity very low by international standards; • So prices inherently volatile and possible assymetry in supply responsiveness.

Basic 1 st year diagram

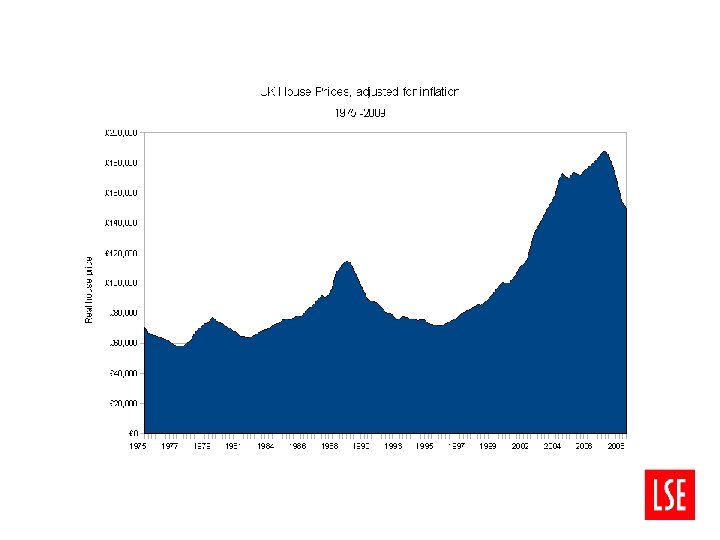
Historic development of prices in the UK • Early 1970 s – incomes/demographics/tax changes – very rapid real house price rises and rapidly increasing inflation. Then stagnation; house prices down 40% in real terms; no nominal reductions; • Late 1970 s; early 1980 s – volatility based on macro economic variation; • Late 1980 s/early 1990 s – income and expectations growth/tax changes/ demographics – very rapid real house price rises and inflation. Then stagnation; property market crash; inflation down and house price falls in real and money terms; slow adjustment to some sort of equilibrium; mid 1990 s – mid 2000 s decade of growth; • Supply growth poor even when rapid increases in demand

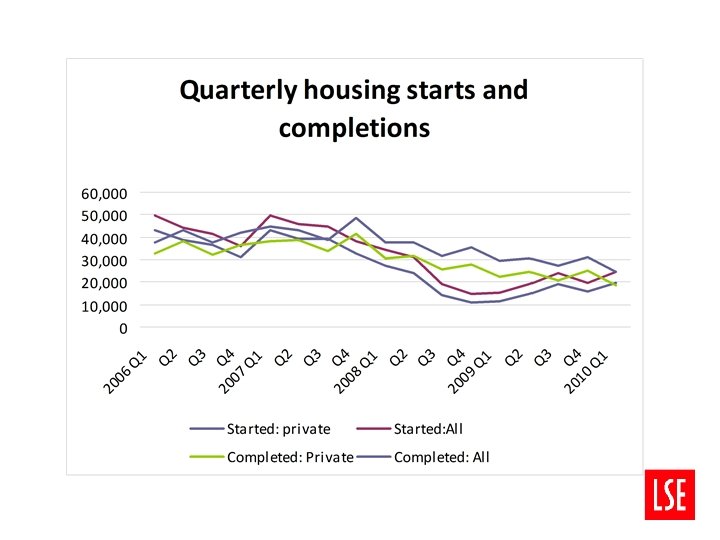
Trends in new building since 1950

Changes in tenure structure 1971 1981 1991 2000 2007 2010 Owner-occupied 51 56 66 69 69 67 Private rented 19 11 9 10 12 14 -- 2 3 6 9 9 Local Authorities 31 30 21 15 10 9 Total (m) 19 21 23 25 26 27 Housing Associations

Owner-occupation rates by age - UK Rates among younger households falling since the 80 s – before the last crisis

Prices, incomes and interest rates in the UK

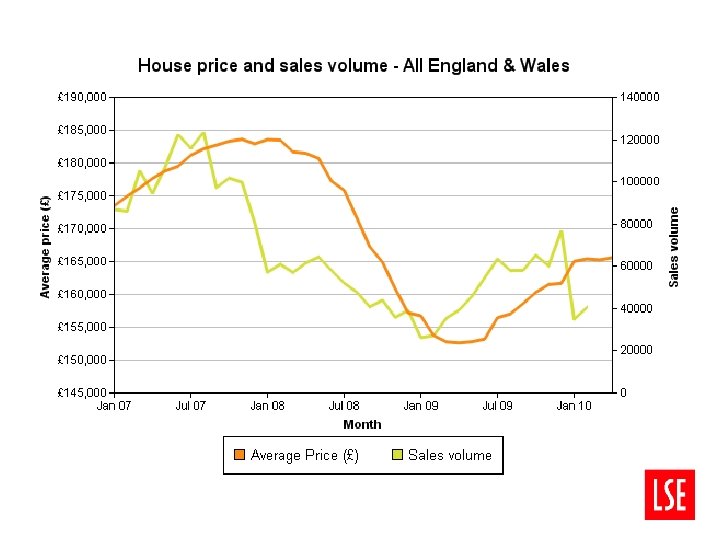
The latest crisis • Post 2000, across the world rapid increases in house prices (except Germany); • Also rapid increases in credit but mainly among existing owner-occupiers – so debt/asset ratio improving as prices rose faster; • Affordability worsening; • New mortgage products; • In UK and some other countries growth in private renting • Supply adjustment variable – Ireland/Spain v UK/Netherlands? ; • Expected adjustment to ‘soft landing’ 2006/7? ; • Then the financial crisis and a cliff?

Table 1: Most recent period of sustained increase in real house prices in 12 OECD countries, and total real house-price increases over the period (highest-lowest last column) Most recent period with increasing real house prices Total increase in real house prices in the period (%) Ireland 2 Q 1987 -3 Q 2006 404 The Netherlands 3 Q 1985 -1 Q 2008 234 Norway 1 Q 1993 -3 Q 2007 198 Denmark 2 Q 1993 -1 Q 2007 174 UK 4 Q 1995 -4 Q 2007 173 Spain 3 Q 1996 -3 Q 2007 127 Sweden 2 Q 1996 -4 Q 2007 127 France 1 Q 1997 -4 Q 2007 113 Australia 1 Q 1996 -1 Q 2008 109 Finland 2 Q 1993 -4 Q 2007 109 New Zealand 4 Q 2000 -3 Q 2007 90 United States 1 Q 1995 -4 Q 2006 56 Source: OECD data. 27. 11. 2009

Table 2: Fall in nominal house prices from peak to late 2008 (lowest-highest column 3) Peak (quarter) Fall from peak to 4 Q 2008 Ireland 2006: Q 3 -18. 1 % Denmark 2007: Q 3 -10. 5 % New Zealand 2007: Q 3 -9. 1 % UK 2008: Q 1 -9. 0 % Norway 2007: Q 4 -6. 8 % Finland 2008: Q 2 -6. 0 % Australia 2008: Q 1 -5. 7 % USA 2007: Q 2 -4. 7 % Spain 2008: Q 1 -3. 9 % France 2008: Q 1 -3. 7 % Sweden 2008: Q 1 -2. 4 % Netherlands 2008: Q 3 -0. 2 % Source: OECD data 27. 11. 2009

Impact on Consumers • Initial effect worsening expectations and little access to credit for consumers or developers • More general recession – lower levels of activity; increased unemployment; but mainly short time/wage reductions • Impact on existing owner-occupiers much less than expected – lower interest rates allowed repayments to remain affordable; refinancing market worked relatively well; no incentive to take homes into possession • Potential owners far higher deposit and far more stringent credit histories required; uncertainty about future house prices – and future jobs; – so question as to the relative impact of demand supply of funds • Currently thought to be at least one million ‘missing’ owner-occupiers but increasing importance of private rented accommodation

Continuing problems of affordability in the market place • House prices rising faster than earnings and incomes at least until 2008 and probably again since 2010 in some parts of the country • Affordability ratios have improved for those who have managed to access home ownership – but many excluded by deposit requirements as well as by uncertainties • Rents have been rising faster than inflation and indeed incomes - especially in London • So continuing affordability and access problems • Increased sharing, living at home, overcrowding etc.

Increasing pressures on private renting • • One million plus missing home owners Migration Investment demand – including international Rents have been increasing rapidly, especially in London but beginning to stabilise? And reductions in demand at bottom end of market from Local housing Allowance cutbacks? Lack of Buy to Let funding – but improving No signs of significant institutional investment Quality of management in particular still an issue

Declining role of social housing? • Affordable rents regime – 170, 000 additional units by 2015? • Zero capital grants thereafter? • Where is the money coming from post 2015? • Equity finance and the attraction of social housing to institutional investors • For how long will Housing Benefit take the strain? • The impact of the Right to Buy

Tenure change since early 1990 s: England

Why no worse? • • • Lack of supply overhang; Expectations of continued inelasticity of supply; Variable rate mortgages; Relatively few first time buyers; Devaluation of £ and political stability; So the fundamentals that economists hate – inelasticity of supply; mortgage risks with consumer; intergenerational inequalities; lack of international competitiveness have all helped stabilise the system – but not to improve fundamentals of either demand, access or supply.

Looking to the future • Household projections suggest maybe 230, 000 additional households per annum in England • Big increases in elderly and lone parent households • The vacancy rate in the existing stock is low by international standards, especially in London – though more could be done to match households to dwellings and so reduce overcrowding • Estimates of housing demand need suggest around 250, 00 dwellings are required, if standards are to be maintained • But no evidence that, even were the market to improve, anything like this number of dwellings could be produced.
 Couple")
2008 -Based Projections of Households in England to 2026 2006 2016 2026 (thousands) Couple households Lone parent households Other multi-person households Male one-person households Female one-person households All households 11, 394 11, 727 12, 060 1, 607 2, 035 2, 495 1, 318 1, 287 1, 268 3, 100 3, 944 4, 787 3, 924 4, 614 5, 407 21, 344 23, 608 26, 016 Source: 2008 -based projection tables made available by DCLG

Components of Change of the Housing Stock in England 2006 – 07 2007 – 08 2008 – 09 2009 – 10 Average (rounded, thousands) New build completions Net conversions Net change of use Net other gains Demolitions Net additional dwellings 193, 080 200, 300 157, 630 124, 200 169 7, 600 9, 020 8, 640 6, 230 8 20, 150 17, 640 16, 640 13, 600 17 460 1, 020 270 970 1 22, 290 20, 500 16, 590 16, 330 19 198, 770 207, 370 166, 570 128, 680 175 Source: Department for Communities and Local Government, Live Table 120

Barriers to Development: the Way Forward • Short term: availability of funds for developers and purchasers – both for owner-occupation and for private renting; uncertainty about the future • Longer term – loss of capacity in development industry; nature of the industry; planning and land availability; need for equity investment in housing; is there really demand? • Government strategy includes: restructuring housing support through affordable rents regime and welfare reform – but no changes in tax policy to reduce benefits to owner-occupiers or to support institutional funding for prs; • Government growth and output agenda: planning reform; contracts for 170, 000 new affordable homes by 2015; 100, 000 homes on public land; 100, 000 95% mortgages; 100, 00 additional homes from Right to Buy and 100 plus more initiatives.

New Building: Current Local Government Finance and Planning System • Under existing system little or no tax benefit to local authority from enabling more housing – business rate unaffected; tiny, dampened, change in grant from population increase • But real costs to the authority and the community in terms of physical and social infrastructure and loss of amenity • ‘Insiders’ benefit from constrained supply; ‘Insiders’ have vote • Neighbours of new development lose out most • S 106 a partial recompense. Tensions between affordable housing and public realm/infrastructure • ‘Localism’ agenda – presumption in favour of development within local framework; neighbourhood initiatives; New Homes Bonus

The National Planning Policy Framework • Announced at the end of March for immediate implementation • ‘Getting rid of 1000 pages of regulation’ • Freedom to determine local plans – but must meet identified housing requirements • If no agreed plan then developments in line with national guidance allowed • General presumption in favour of sustainable development • Neighbourhood initiatives in favour of development; • But many continuing constraints – brownfield first; urban open space; greenbelt; design etc

The New Homes Bonus • £ 200 m 2011/12; £ 250 m p. a 2012 -15; rest from Formula Grant • Based on net new additions – 160, 000+ 2010/11 • Per unit payment equal to the national average for the relevant council tax band for 6 years (around £ 650) • Enhancement for affordable homes of £ 350 p. a (including ‘affordable rent’ homes) • Bringing empty homes into use and traveller sites also benefit

New Homes Bonus: Incentives • Hypothecated funding – but can use bonus as the LA wishes • Larger grant for larger homes • Easiest for greenfield/large sites • Net additions not new build - so negative impact on regeneration? • Reducing Nimbyism? - how are benefits to be linked to those who suffer from the development • Relationship to Community Infrastructure Levy – where money must be used for infrastructure – possibility of neighbourhood funding • And is the scale of the payment adequate?

The Current Housing Market • Transactions/mortgage lending levels remain low although rising slowly • House prices have risen to the point where average is around 6% below peak • Major differences between houses and flats; between areas and regions • Some investment demand from overseas – but mainly existing owner-occupiers • A possible increase in new build activity from very low levels • No real sign of self sustaining improvement but view that bottom has been reached and double dip unlikely • And are house prices at a reasonable equilibrium?

Unprecedented uncertainties? • More reports than houses? • It’s the economy stupid – the world economy/the UK economy? – still in top 5 but a decade of low/zero growth • Housing market currently dependent on funding availability but also confidence. Possibility that prices way out of equilibrium – or in line with (bad) fundamentals? A backlog of those who want to move and could afford to do so. • Policy - rhetoric over reality? Anyway little traction? Asking for house price stability; shift away from grant to demand side subsidies; integrating tenures; lower welfare benefits; and more flexible responses to problems. But already shifting ground. • And what is the longer term role of social housing – and of income related support? • Do these add up?

Where Next? • Optimistic scenario: funding increases slowly; improved affordability and products enable lower risk purchases; local authorities support investment; slow adjustment back to levels of output of mid-2000 s • Pessimistic scenario: funding remains weak; reduced government support for both supply and demand undermines supply and rents; interest rates rise; lower investment/lower demand • But as and when economy improves, demand increases faster than supply; localism constrains new supply; prices rise and the cycle recommences • Even so, problems in the housing market more an outcome of the macro-economy than the cause of macroeconomic problems?

So: will the market return to normal? • If macro-economy leads the housing market then progress towards whatever normal will be slow • And given supply almost certainly slow to respond any growth will be accompanied by even greater house price volatility • Owner-occupation aspirations remain high - and policy will continue to support owner-occupation as cheaper for individuals and government? • But a generation going to find it very difficult to enter – role of intermediate tenures? • Moving towards an integrated rented sector – with HAs getting more directly involved in market provision • But the fundamental remains – how to increase supply to meet the continued expansion of population and households • So more of the same rather than fundamental change?
c931cdae6001b40640e042952507a48b.ppt