The Time Value of Money 1 Key Points

![Frequency of Compounding General Formula: FVn = PV0(1 + [i/m])mn Frequency of Compounding General Formula: FVn = PV0(1 + [i/m])mn](https://present5.com/presentacii-2/20171208\10846-lecture-2-the_time_value_of_money.ppt\10846-lecture-2-the_time_value_of_money_46.jpg)
10846-lecture-2-the_time_value_of_money.ppt
- Количество слайдов: 55
 The Time Value of Money 1
 Key Points Understanding The Timing of Returns Cash Flows Risk and Return Time Value of Money 2
 Introduction You may have learned from your studies of economics that the goal of the business firm is profit maximization. In financial management, profit maximization is not an appropriate goal as it ignores the following factors: (1) the timing of returns, (2) cash flows, and (3) risk, all of which are key elements in determining shareholder wealth. The Timing of Returns One shortcoming of profit maximization is that it tends to focus on the absolute amount of returns and ignores their timing by simply seeking to select those investments which yield the greatest total amount of profits. 3
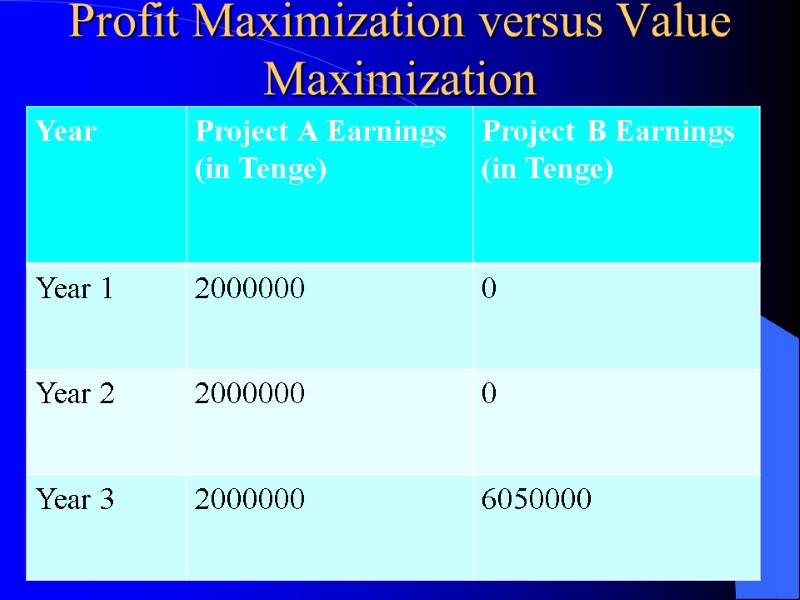
 Profit Maximization versus Value Maximization 4
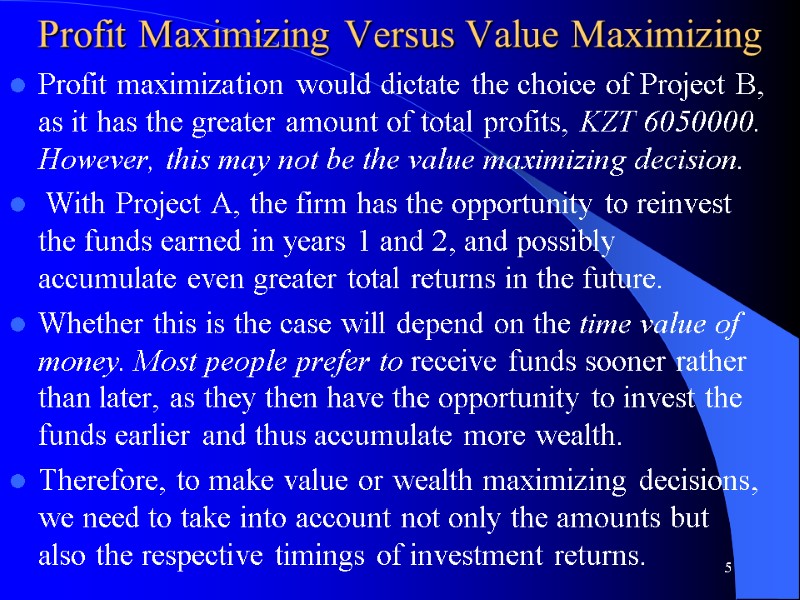
 Profit Maximizing Versus Value Maximizing Profit maximization would dictate the choice of Project B, as it has the greater amount of total profits, KZT 6050000. However, this may not be the value maximizing decision. With Project A, the firm has the opportunity to reinvest the funds earned in years 1 and 2, and possibly accumulate even greater total returns in the future. Whether this is the case will depend on the time value of money. Most people prefer to receive funds sooner rather than later, as they then have the opportunity to invest the funds earlier and thus accumulate more wealth. Therefore, to make value or wealth maximizing decisions, we need to take into account not only the amounts but also the respective timings of investment returns. 5
 Cash Flows Profits do not represent cash flows. Although profits may be used as the traditional accounting measure of a firm’s financial performance and a firm may report ‘healthy’ profits in its annual accounts, it does not necessarily mean that cash is actually available to pay bills and fund investment. For example, depreciation and other provisions are included in a profit and loss account but they are not cash flow items. The earnings of the two projects may, or may not, represent actual cash flows. As far as we are concerned in financial management, cash flow is the real measure of a firm’s performance and is the measure by which the financial markets value a firm. 6
 Risk The objective of profit maximization also ignores the concept of risk, which, for our purposes here, is defined as the chance that the actual outcome of a decision may differ from the expected outcome. A firm’s returns, as we have mentioned, should be measured in terms of cash flows not profits, and clearly there is always the risk that actual cash flows may be more or less than those expected by the firm’s management. In comparing the respective returns of the two projects in the above example , we did not consider their relative risks. For example, Project A may be the expansion of an existing product line, whereas Project B may involve launching a new product in the market. . 7
 Risk Clearly Project B, in this scenario, would be the higher risk investment and therefore its cash flows would be subject to a greater degree of uncertainty. If Project B is considered higher risk than Project A then it will be expected to yield a higher return. By focusing solely on returns, the goal of profit maximization is only looking at ‘one side of the coin’. We cannot make a valid comparison between investments unless we consider both the respective risk and return of each investment. Investors can only earn higher returns by accepting higher levels of risk. If a low-risk investment is preferred, then a commensurate low level of return will be expected. It is this combination of risk and return that determines a firm’s share value and thus the wealth of its owners. 8
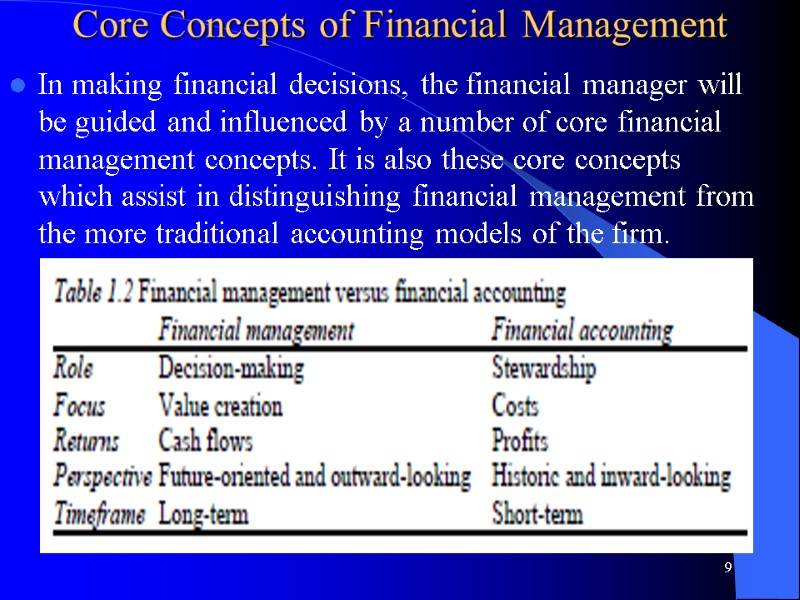
 Core Concepts of Financial Management In making financial decisions, the financial manager will be guided and influenced by a number of core financial management concepts. It is also these core concepts which assist in distinguishing financial management from the more traditional accounting models of the firm. 9
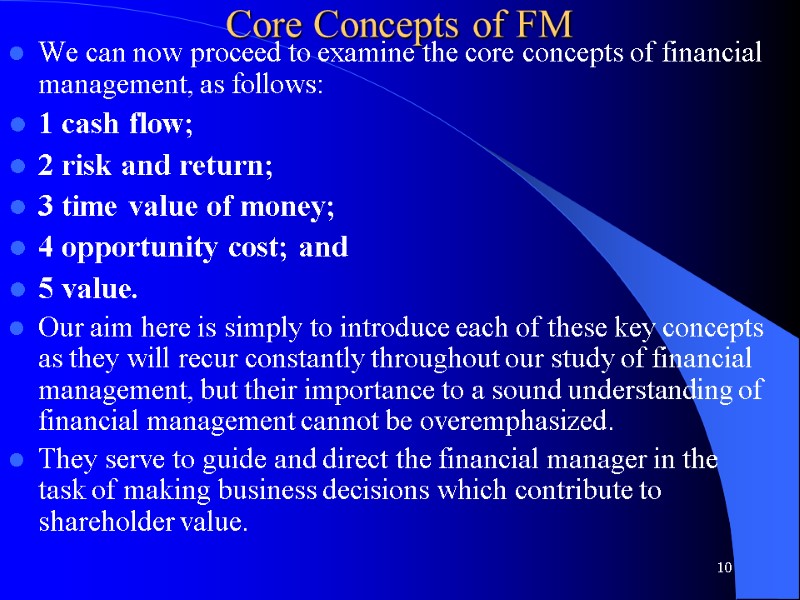
 Core Concepts of FM We can now proceed to examine the core concepts of financial management, as follows: 1 cash flow; 2 risk and return; 3 time value of money; 4 opportunity cost; and 5 value. Our aim here is simply to introduce each of these key concepts as they will recur constantly throughout our study of financial management, but their importance to a sound understanding of financial management cannot be overemphasized. They serve to guide and direct the financial manager in the task of making business decisions which contribute to shareholder value. 10
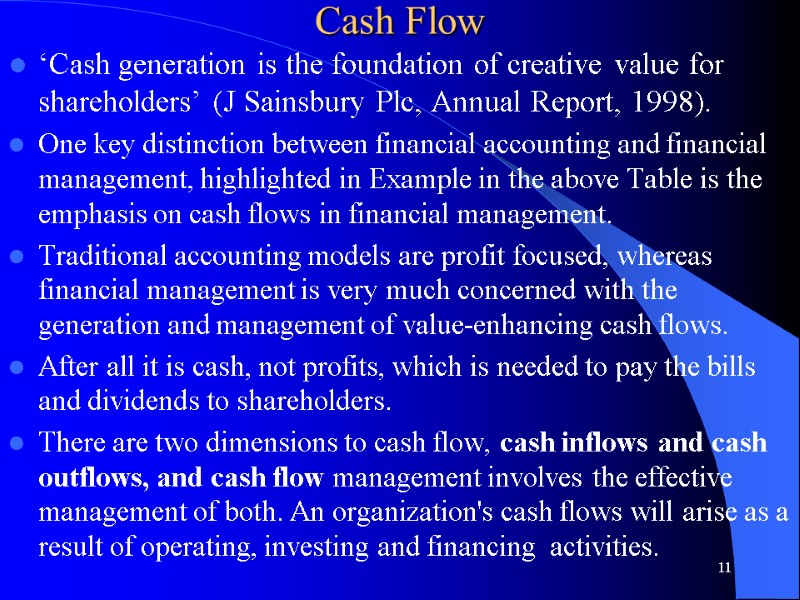
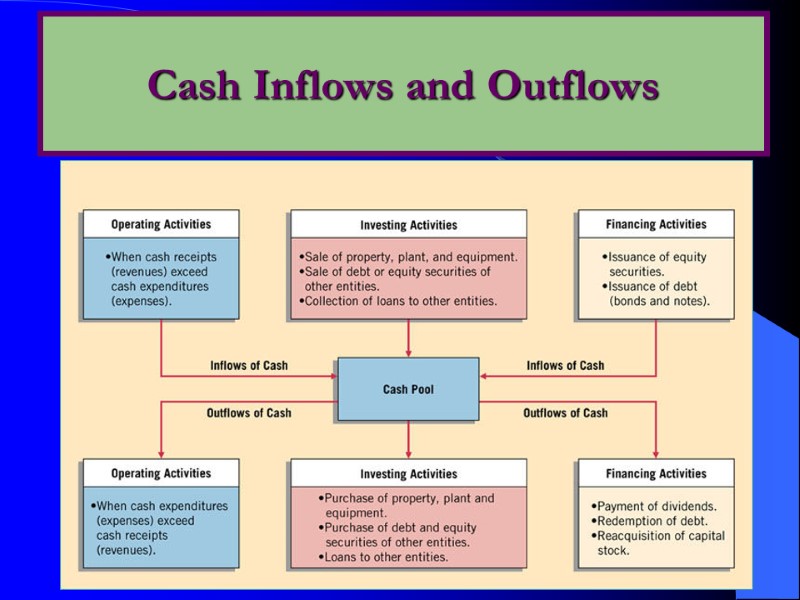
 Cash Flow ‘Cash generation is the foundation of creative value for shareholders’ (J Sainsbury Plc, Annual Report, 1998). One key distinction between financial accounting and financial management, highlighted in Example in the above Table is the emphasis on cash flows in financial management. Traditional accounting models are profit focused, whereas financial management is very much concerned with the generation and management of value-enhancing cash flows. After all it is cash, not profits, which is needed to pay the bills and dividends to shareholders. There are two dimensions to cash flow, cash inflows and cash outflows, and cash flow management involves the effective management of both. An organization's cash flows will arise as a result of operating, investing and financing activities. 11
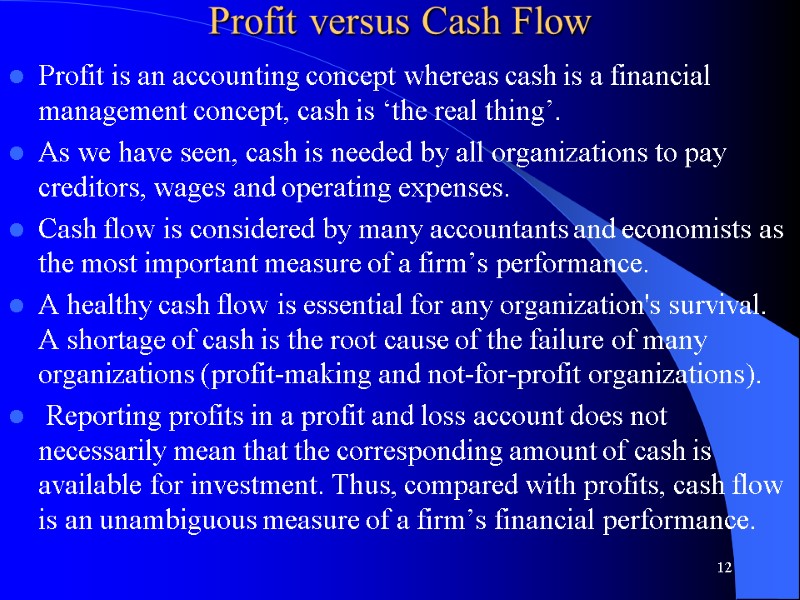
 Profit versus Cash Flow Profit is an accounting concept whereas cash is a financial management concept, cash is ‘the real thing’. As we have seen, cash is needed by all organizations to pay creditors, wages and operating expenses. Cash flow is considered by many accountants and economists as the most important measure of a firm’s performance. A healthy cash flow is essential for any organization's survival. A shortage of cash is the root cause of the failure of many organizations (profit-making and not-for-profit organizations). Reporting profits in a profit and loss account does not necessarily mean that the corresponding amount of cash is available for investment. Thus, compared with profits, cash flow is an unambiguous measure of a firm’s financial performance. 12
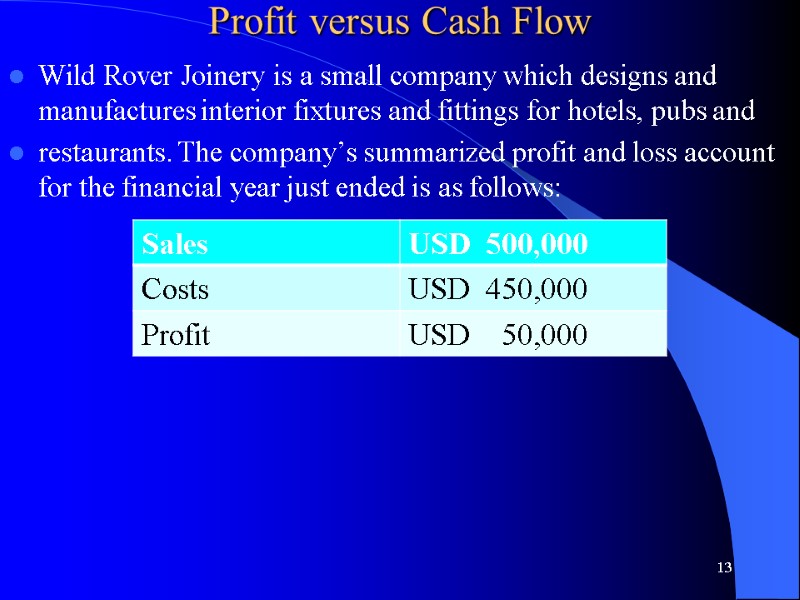
 Profit versus Cash Flow Wild Rover Joinery is a small company which designs and manufactures interior fixtures and fittings for hotels, pubs and restaurants. The company’s summarized profit and loss account for the financial year just ended is as follows: 13
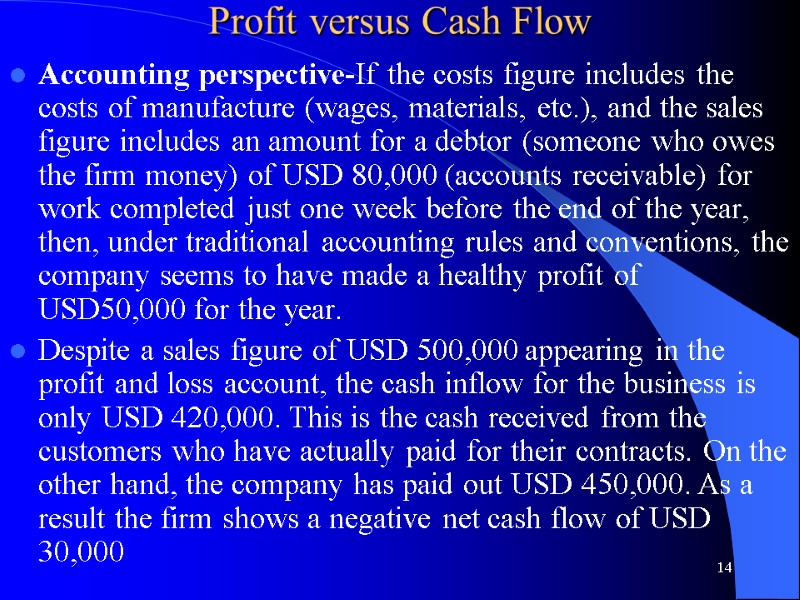
 Profit versus Cash Flow Accounting perspective-If the costs figure includes the costs of manufacture (wages, materials, etc.), and the sales figure includes an amount for a debtor (someone who owes the firm money) of USD 80,000 (accounts receivable) for work completed just one week before the end of the year, then, under traditional accounting rules and conventions, the company seems to have made a healthy profit of USD50,000 for the year. Despite a sales figure of USD 500,000 appearing in the profit and loss account, the cash inflow for the business is only USD 420,000. This is the cash received from the customers who have actually paid for their contracts. On the other hand, the company has paid out USD 450,000. As a result the firm shows a negative net cash flow of USD 30,000 14
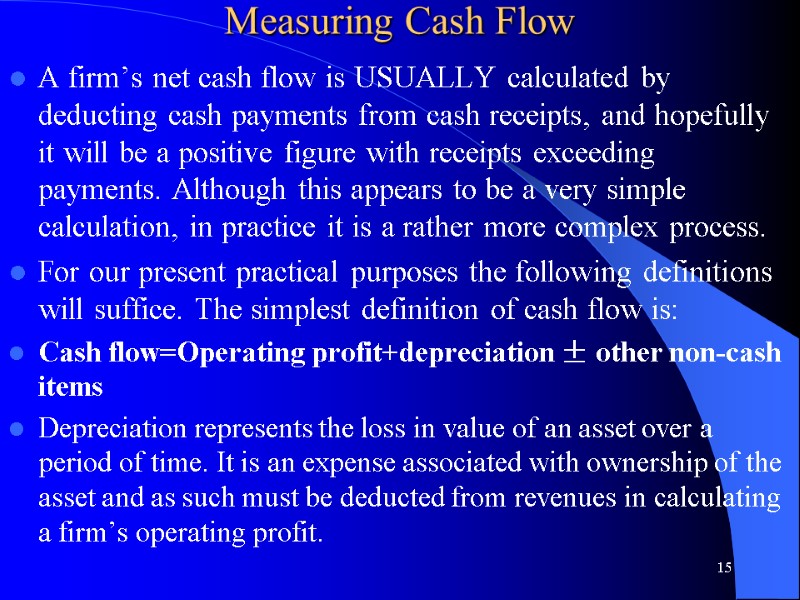
 Measuring Cash Flow A firm’s net cash flow is USUALLY calculated by deducting cash payments from cash receipts, and hopefully it will be a positive figure with receipts exceeding payments. Although this appears to be a very simple calculation, in practice it is a rather more complex process. For our present practical purposes the following definitions will suffice. The simplest definition of cash flow is: Cash flow=Operating profit+depreciation ± other non-cash items Depreciation represents the loss in value of an asset over a period of time. It is an expense associated with ownership of the asset and as such must be deducted from revenues in calculating a firm’s operating profit. 15
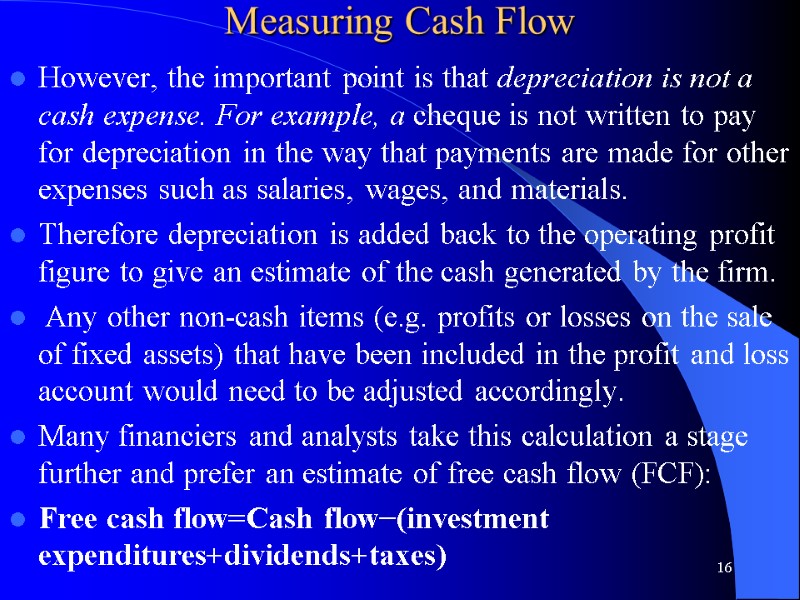
 Measuring Cash Flow However, the important point is that depreciation is not a cash expense. For example, a cheque is not written to pay for depreciation in the way that payments are made for other expenses such as salaries, wages, and materials. Therefore depreciation is added back to the operating profit figure to give an estimate of the cash generated by the firm. Any other non-cash items (e.g. profits or losses on the sale of fixed assets) that have been included in the profit and loss account would need to be adjusted accordingly. Many financiers and analysts take this calculation a stage further and prefer an estimate of free cash flow (FCF): Free cash flow=Cash flow−(investment expenditures+dividends+taxes) 16
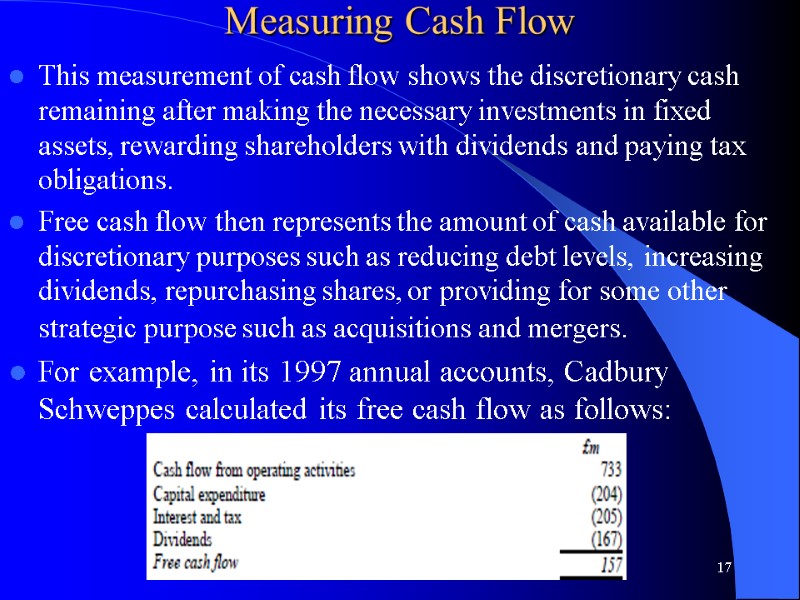
 Measuring Cash Flow This measurement of cash flow shows the discretionary cash remaining after making the necessary investments in fixed assets, rewarding shareholders with dividends and paying tax obligations. Free cash flow then represents the amount of cash available for discretionary purposes such as reducing debt levels, increasing dividends, repurchasing shares, or providing for some other strategic purpose such as acquisitions and mergers. For example, in its 1997 annual accounts, Cadbury Schweppes calculated its free cash flow as follows: 17
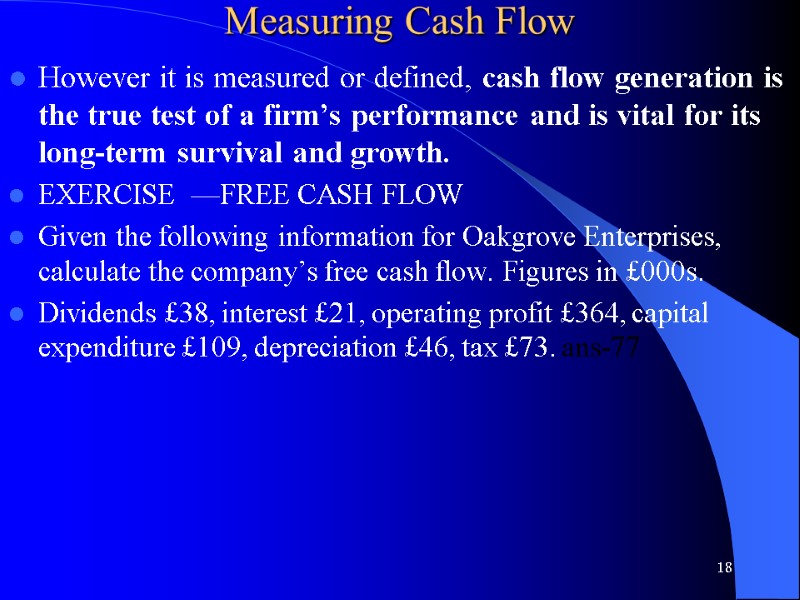
 Measuring Cash Flow However it is measured or defined, cash flow generation is the true test of a firm’s performance and is vital for its long-term survival and growth. EXERCISE —FREE CASH FLOW Given the following information for Oakgrove Enterprises, calculate the company’s free cash flow. Figures in £000s. Dividends £38, interest £21, operating profit £364, capital expenditure £109, depreciation £46, tax £73. ans-77 18
 19 Cash Inflows and Outflows
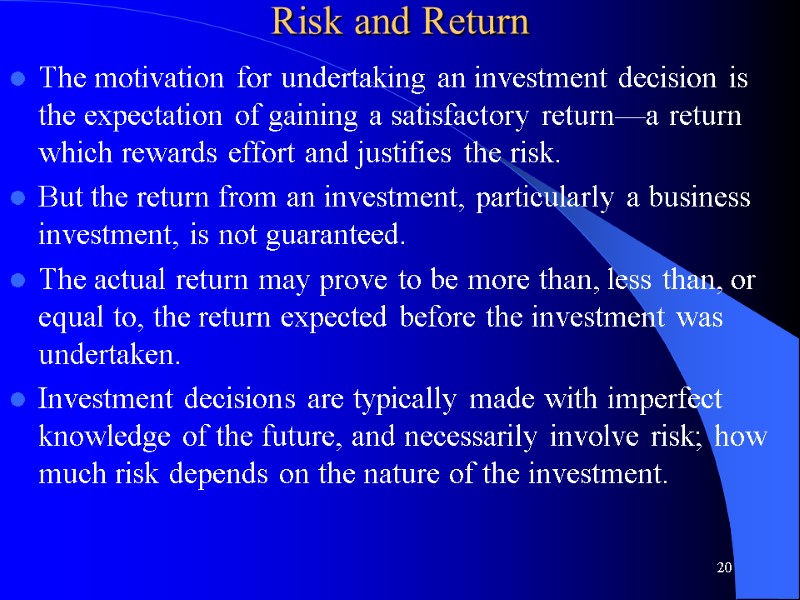
 Risk and Return The motivation for undertaking an investment decision is the expectation of gaining a satisfactory return—a return which rewards effort and justifies the risk. But the return from an investment, particularly a business investment, is not guaranteed. The actual return may prove to be more than, less than, or equal to, the return expected before the investment was undertaken. Investment decisions are typically made with imperfect knowledge of the future, and necessarily involve risk; how much risk depends on the nature of the investment. 20
 Risk and Return In the context of financial management by risk we mean the chance that the actual returns may differ from the expected returns, and in finance a risky investment is one whose potential returns are expected to have a high degree of variation or volatility. In financial management returns are measured in terms of expected future cash flows—not profits, and risk is the degree of volatility surrounding expected future cash flow returns. In assessing the risk of an investment, a decision-maker clearly does not know what the actual outcome will be. However, the decision-making process can be aided by the application of some statistical techniques, such as probability theory. 21
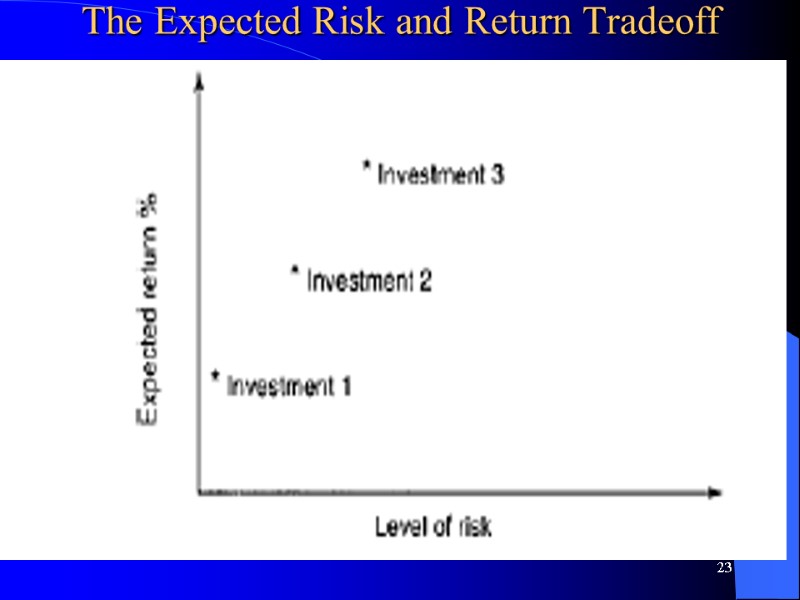
 Risk and Return This allows the decision-maker to create probability weightings for a range of possible outcomes. Risk is thus a phenomenon which can be quantified by expressing it in terms of probabilities, and consequently probability theory is central to risk analysis. The concepts of risk and expected return tend to be intimately related. In basic terms, the greater the perceived level of risk associated with a given investment, then the greater the level of return expected by an investor. As the following figure illustrates, there is almost always a risk-return trade-off in financial decisions. 22
 The Expected Risk and Return Tradeoff 23
 Risk and Return The risk of investing in a bank or building society savings account (Investment 1 in the above Figure ) is lower than investing in the shares of a long-established ‘blue chip’ company, such as Bass, BT, or Marks & Spencer (Investment 2), and so is the expected return. In contrast, the risk of investing in a young, fast-growing company recently floated on the stock market (Investment 3), would normally be much higher than the risk of investing in the shares of a ‘blue chip’ company. The risk of investing in an entirely new venture, as in the new Coffee Ventures case, would be higher still. Consequently, rational investors will require higher returns from investing in higher risk investments, returns which they consider compensate for the level of risk. 24
 The investor’s propensity for risk-taking Figure shows, other things being equal, the positive relationship (correlation) between expected return and risk of the three investment opportunities: as the expected return increases there is a corresponding increase in the level of risk the investor must accept and vice versa. The investor’s propensity (degree) for risk-taking Investment decisions will be influenced by the investor’s propensity for risk-taking, or the investor’s attitude to risk. Investors can be classified according to their propensity for risk-taking. For example, investors who have a low risk propensity, in other words they have a preference for less risk, are regarded as being risk-averse. Investors who have a high risk propensity, or a desire for risk, are referred to as risk-taking. 25
 The investor’s propensity for risk-taking Individuals and corporations are generally considered to be risk-averse, in the sense that they are willing to reduce their risk burden by paying others to assume some of their risks. For example, most people will pay premiums to insurance companies for accepting their everyday personal and business risks. This is another way of saying that investors must be paid or compensated for taking on more risk. Shareholders and managers are generally considered to be risk-averse, that is, for an increase in risk they require a commensurate increase in return. Thus the risk-return concept is immensely important in financial management 26
 Time Value of Money Cash flows which are to be received at some time in the future, say, one or two years from now, have less value than the equivalent cash flows to be received today. Cash received today can be reinvested in other investments to generate more cash flows. They could at least be placed in a deposit account to earn interest, thereby increasing their future value. This raises the notion that there is an opportunity cost associated with investment cash flows, because alternative investment opportunities always exist. we will examine the formal appraisal techniques and methods, principally net present value (NPV) analysis, which can be used to evaluate the size, timing, and riskiness of an investment’s expected future cash flows. 27
 Time Value of Money Not only is the concept of measuring returns in terms of cash flows important in financial management, but it is also the timing of cash flow returns which is vitally important. It is the timing of cash flows, and their size, which determines their value. You may have heard the expression: ‘A pound today is worth more than a pound tomorrow’. If offered the choice between receiving £100 today or £100 one year from now, most of us would prefer to receive the cash now. We would then have the option to invest it, say at 10 per cent interest, so that in one year’s time it would be worth £110. Most people prefer to receive cash sooner rather than later, and to spend cash later rather than sooner, because most of us realize, at least intuitively, that money has a time value. 28
 The Time Value of Money Obviously, $1,000 today. Money received sooner rather than later allows one to use the funds for investment or consumption purposes. This concept is referred to as the TIME VALUE OF MONEY!! TVOM is the value of money figuring in a given amount of interest earned over a given amount of time Which would you rather have -- $1,000 today or $1,000 in 5 years? 29
 INFLATION You may have wondered about the role inflation plays in the time value of money. It is certainly the case that in times of inflation the value of money is eroded. Expressed in terms of its purchasing power, the same nominal amount of money will purchase less goods and services over time. However, for the time being, we will ignore the specific effects of inflation on investment decisions and focus on the important concept of opportunity cost. 30
 Why TIME? Observe that the concepts of future value and present value are inversely related. Over time, future value will increase while present value will decline. TIME allows one the opportunity to postpone consumption and earn INTEREST. NOT having the opportunity to earn interest on money is called OPPORTUNITY COST. 31
 How can one compare amounts in different time periods? One can adjust values from different time periods using an interest rate. Remember, one CANNOT compare numbers in different time periods without first adjusting them using an interest rate. 32
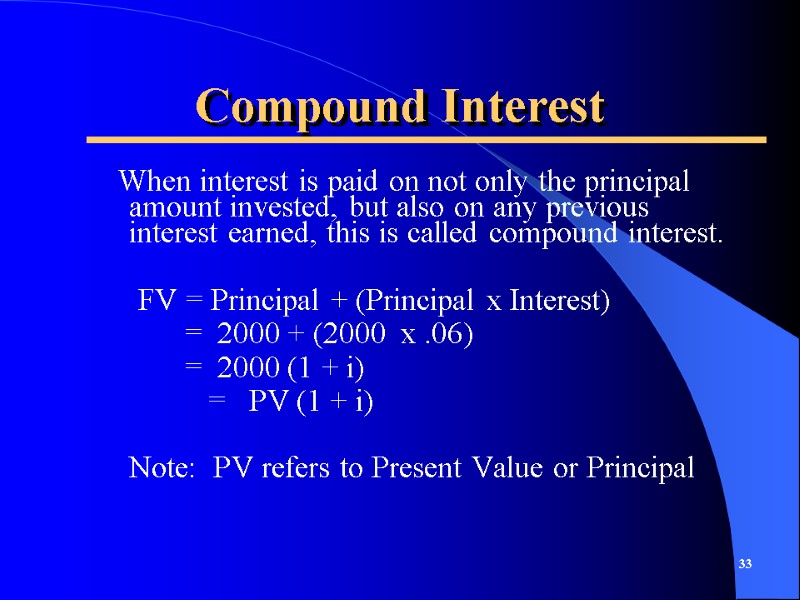
 Compound Interest When interest is paid on not only the principal amount invested, but also on any previous interest earned, this is called compound interest. FV = Principal + (Principal x Interest) = 2000 + (2000 x .06) = 2000 (1 + i) = PV (1 + i) Note: PV refers to Present Value or Principal 33
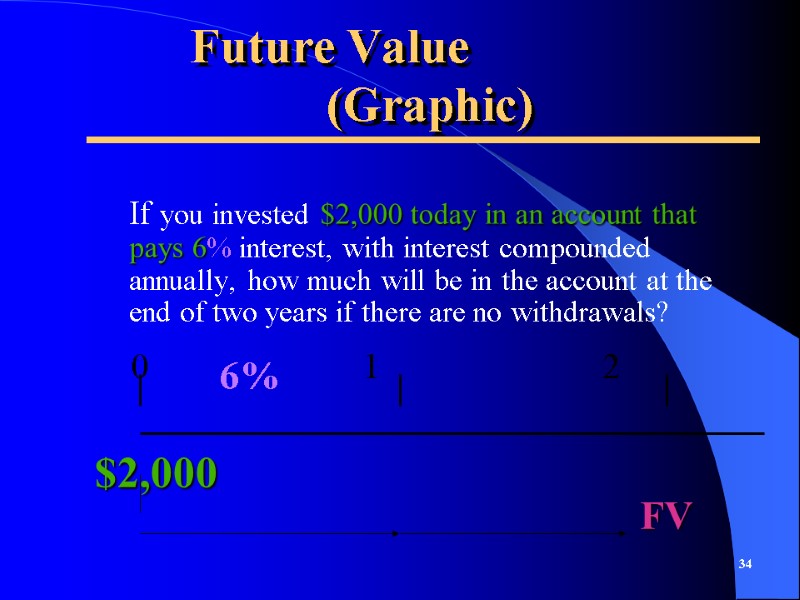
 Future Value (Graphic) If you invested $2,000 today in an account that pays 6% interest, with interest compounded annually, how much will be in the account at the end of two years if there are no withdrawals? 34 0 1 2 $2,000 FV 6%
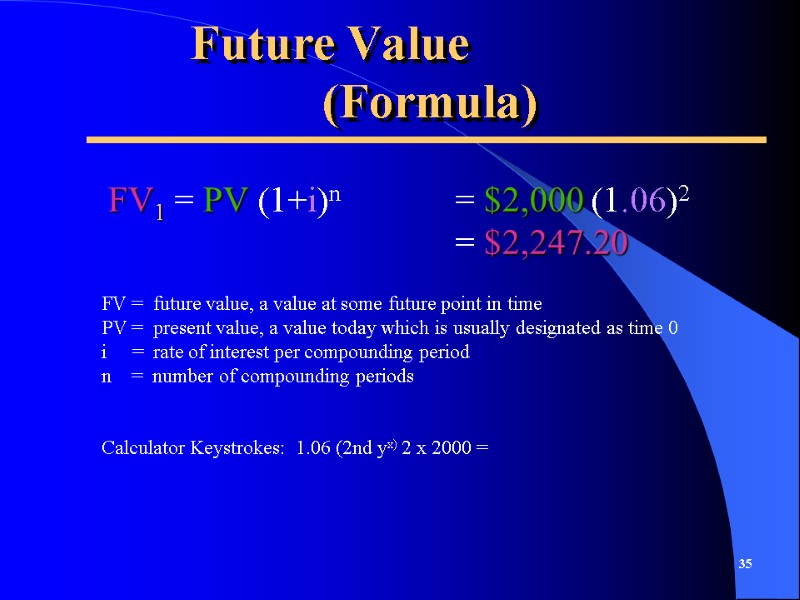
 Future Value (Formula) FV1 = PV (1+i)n = $2,000 (1.06)2 = $2,247.20 35 FV = future value, a value at some future point in time PV = present value, a value today which is usually designated as time 0 i = rate of interest per compounding period n = number of compounding periods Calculator Keystrokes: 1.06 (2nd yx) 2 x 2000 =
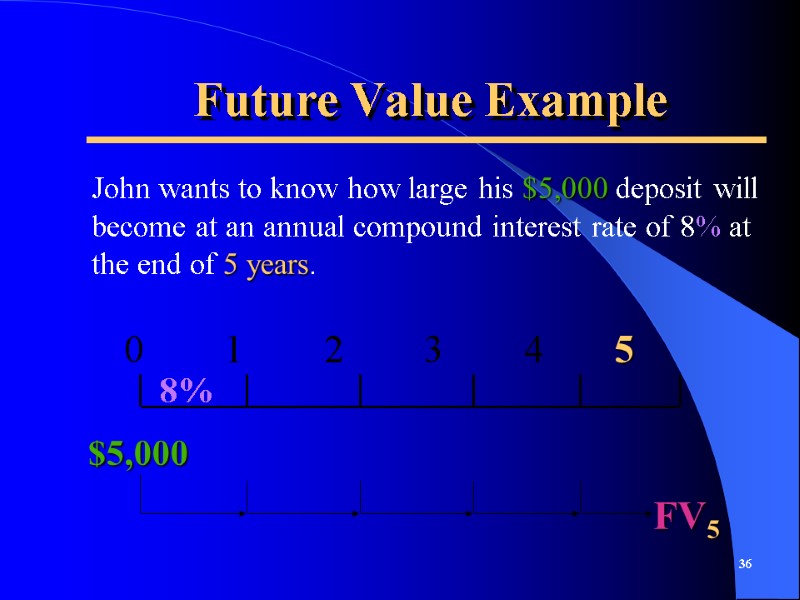
 Future Value Example John wants to know how large his $5,000 deposit will become at an annual compound interest rate of 8% at the end of 5 years. 36 0 1 2 3 4 5 $5,000 FV5 8%
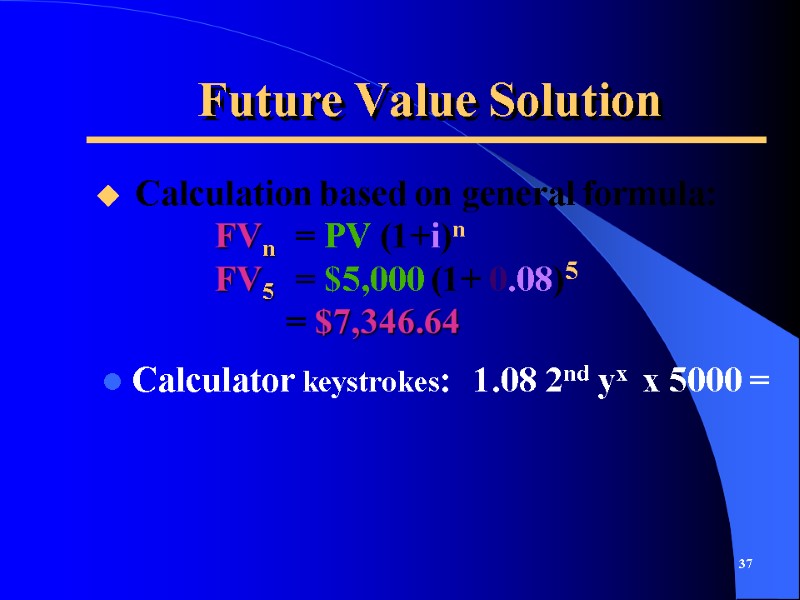
 Future Value Solution Calculator keystrokes: 1.08 2nd yx x 5000 = 37 Calculation based on general formula: FVn = PV (1+i)n FV5 = $5,000 (1+ 0.08)5 = $7,346.64
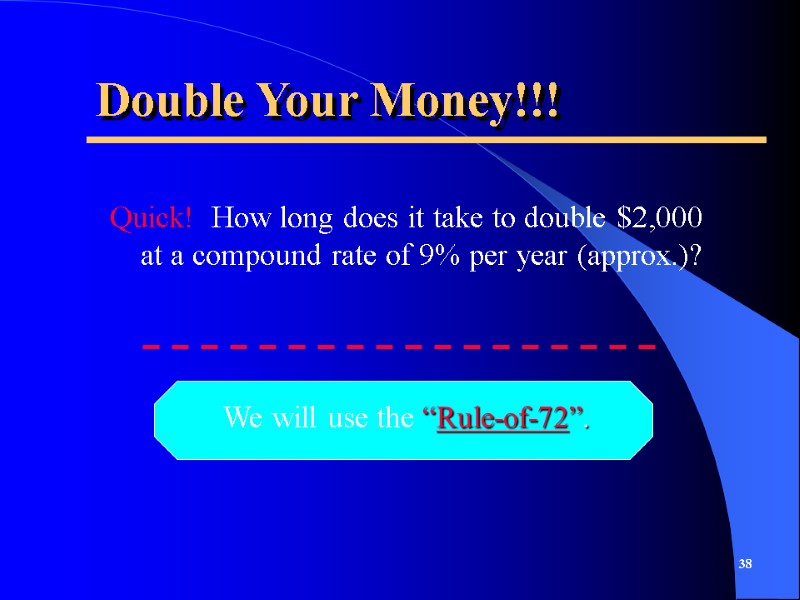
 Double Your Money!!! Quick! How long does it take to double $2,000 at a compound rate of 9% per year (approx.)? We will use the “Rule-of-72”. 38
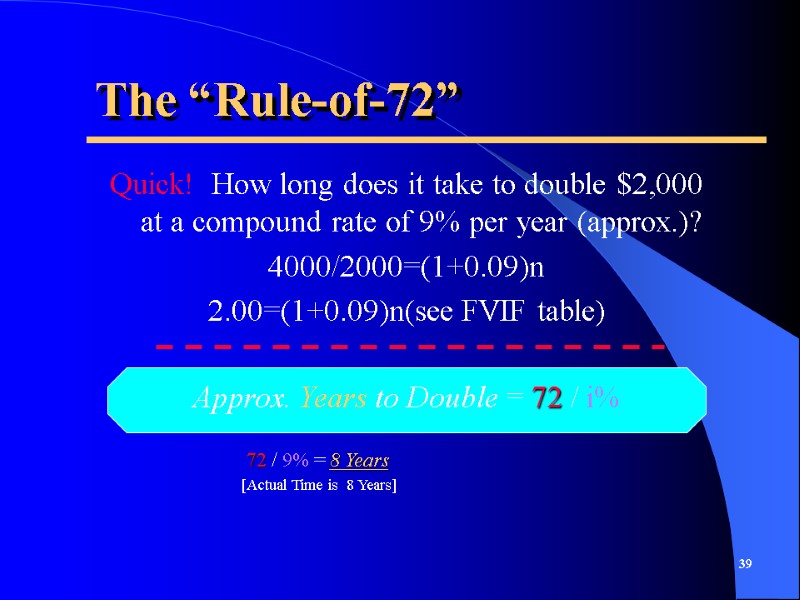
 The “Rule-of-72” Quick! How long does it take to double $2,000 at a compound rate of 9% per year (approx.)? 4000/2000=(1+0.09)n 2.00=(1+0.09)n(see FVIF table) Approx. Years to Double = 72 / i% 72 / 9% = 8 Years [Actual Time is 8 Years] 39
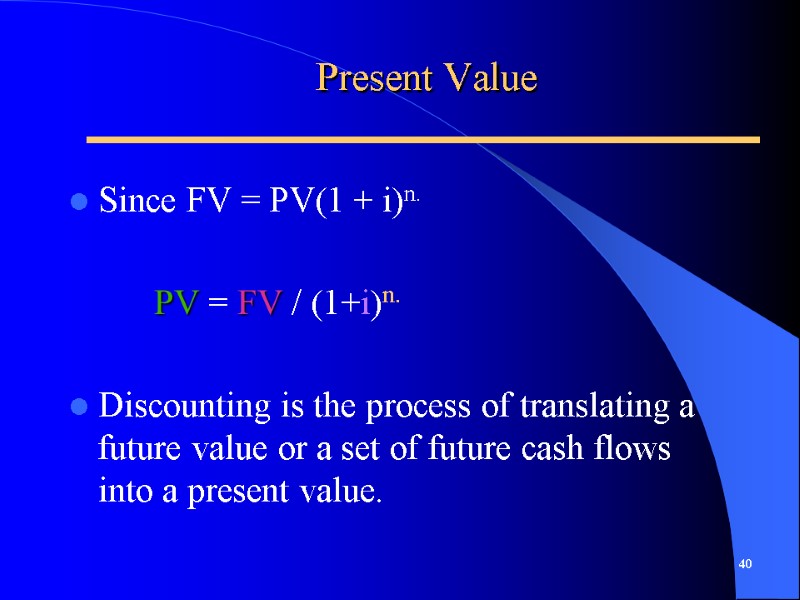
 Present Value Since FV = PV(1 + i)n. PV = FV / (1+i)n. Discounting is the process of translating a future value or a set of future cash flows into a present value. 40
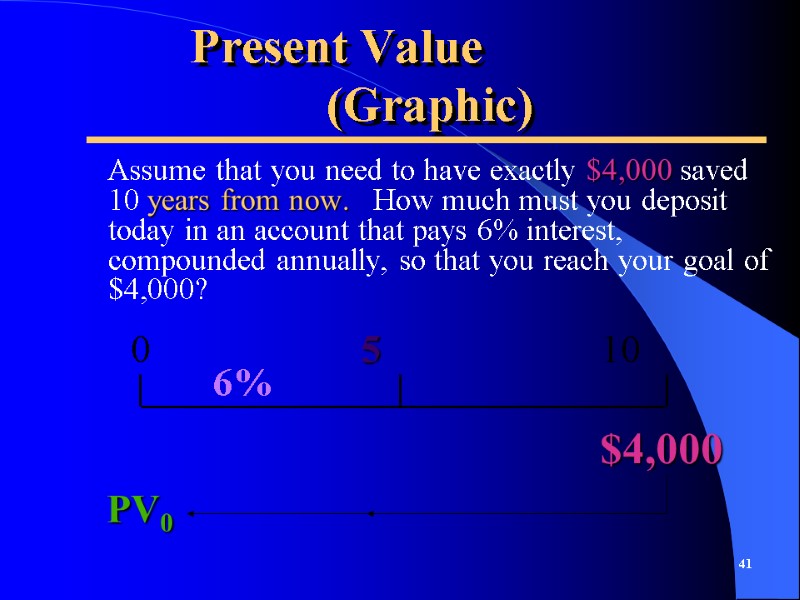
 Present Value (Graphic) Assume that you need to have exactly $4,000 saved 10 years from now. How much must you deposit today in an account that pays 6% interest, compounded annually, so that you reach your goal of $4,000? 41 0 5 10 $4,000 6% PV0
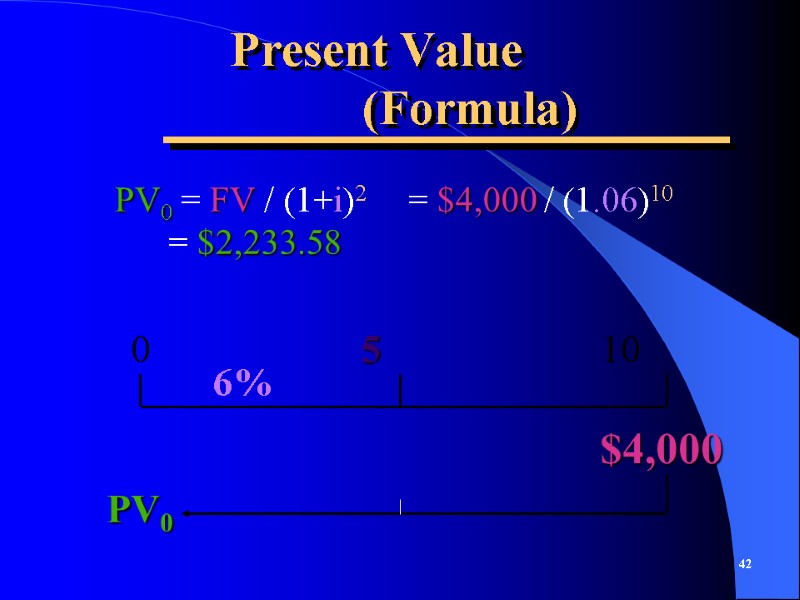
 Present Value (Formula) PV0 = FV / (1+i)2 = $4,000 / (1.06)10 = $2,233.58 42 0 5 10 $4,000 6% PV0
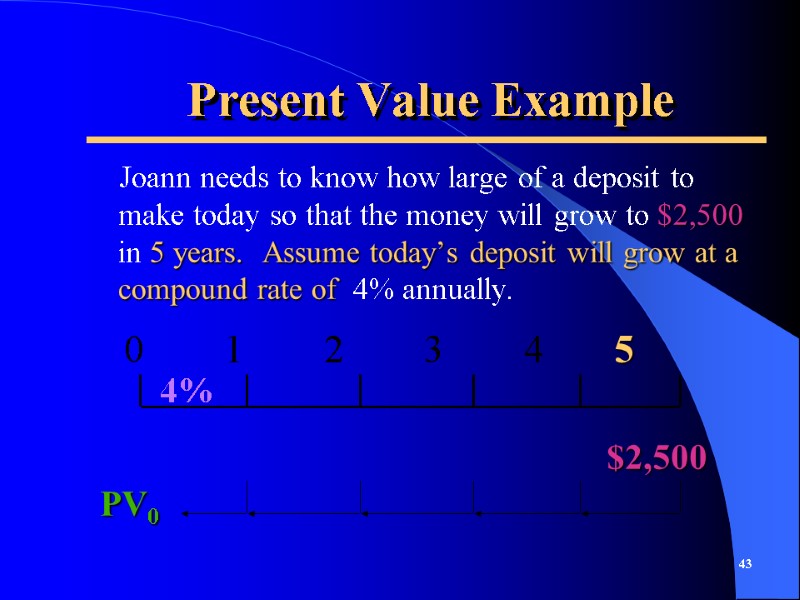
 Present Value Example Joann needs to know how large of a deposit to make today so that the money will grow to $2,500 in 5 years. Assume today’s deposit will grow at a compound rate of 4% annually. 43 0 1 2 3 4 5 $2,500 PV0 4%
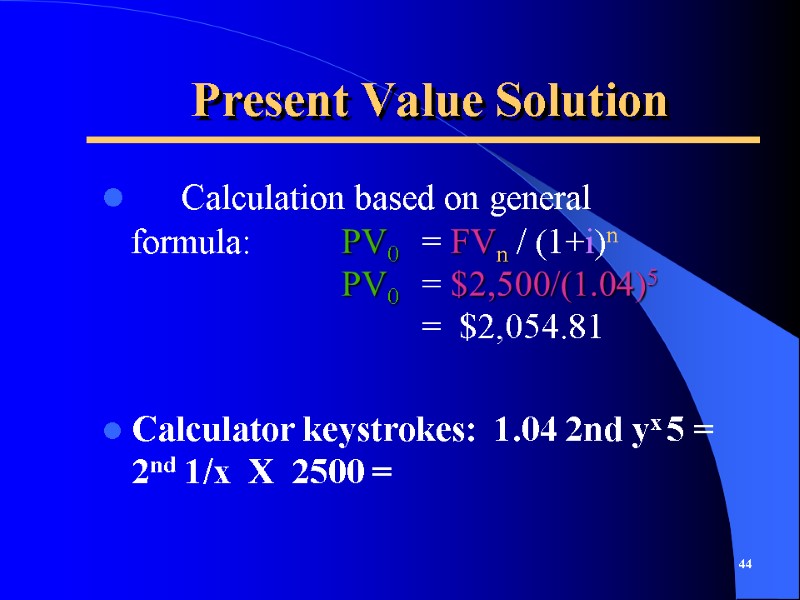
 Present Value Solution Calculation based on general formula: PV0 = FVn / (1+i)n PV0 = $2,500/(1.04)5 = $2,054.81 Calculator keystrokes: 1.04 2nd yx 5 = 2nd 1/x X 2500 = 44
 Finding “n” or “i” when one knows PV and FV(6/8.5) If one invests $2,000 today and has accumulated $2,676.45 after exactly five years, what rate of annual compound interest was earned? Dinara currently has £3,000 available for investment and wishes to have at least £4,500 in 5 years time. Advise Dinara as to what interest rate she must earn on her starting sum of £3,000 if she wishes to achieve her investment objective, assuming annual compounding. 45
![>Frequency of Compounding General Formula: FVn = PV0(1 + [i/m])mn >Frequency of Compounding General Formula: FVn = PV0(1 + [i/m])mn](https://present5.com/presentacii-2/20171208\10846-lecture-2-the_time_value_of_money.ppt\10846-lecture-2-the_time_value_of_money_46.jpg) Frequency of Compounding General Formula: FVn = PV0(1 + [i/m])mn n: Number of Years m: Compounding Periods per Year i: Annual Interest Rate FVn,m: FV at the end of Year n PV0: PV of the Cash Flow today 46
Frequency of Compounding General Formula: FVn = PV0(1 + [i/m])mn n: Number of Years m: Compounding Periods per Year i: Annual Interest Rate FVn,m: FV at the end of Year n PV0: PV of the Cash Flow today 46
 Frequency of Compounding Example Suppose you deposit $1,000 in an account that pays 12% interest, compounded quarterly. How much will be in the account after eight years if there are no withdrawals? PV = $1,000 i = 12%/4 = 3% per quarter n = 8 x 4 = 32 quarters It may be half-yearly or semi-annually 47
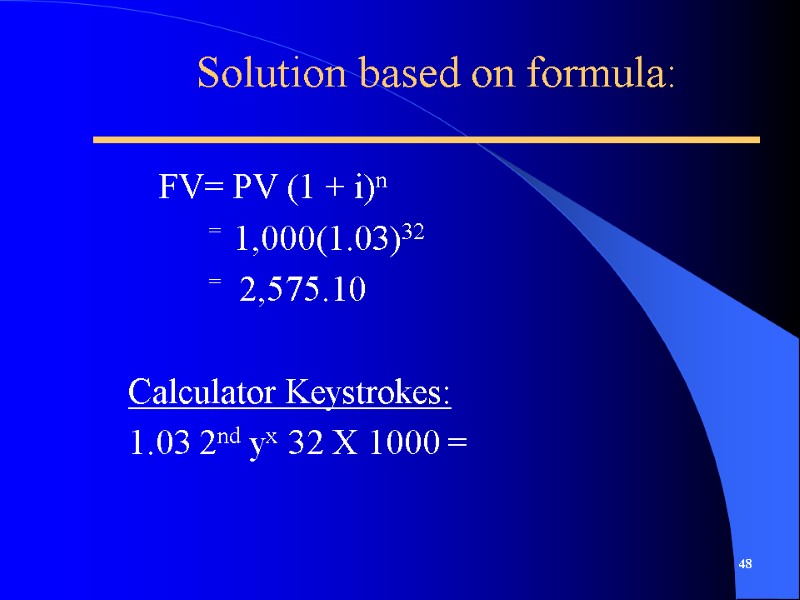
 Solution based on formula: FV= PV (1 + i)n = 1,000(1.03)32 = 2,575.10 Calculator Keystrokes: 1.03 2nd yx 32 X 1000 = 48
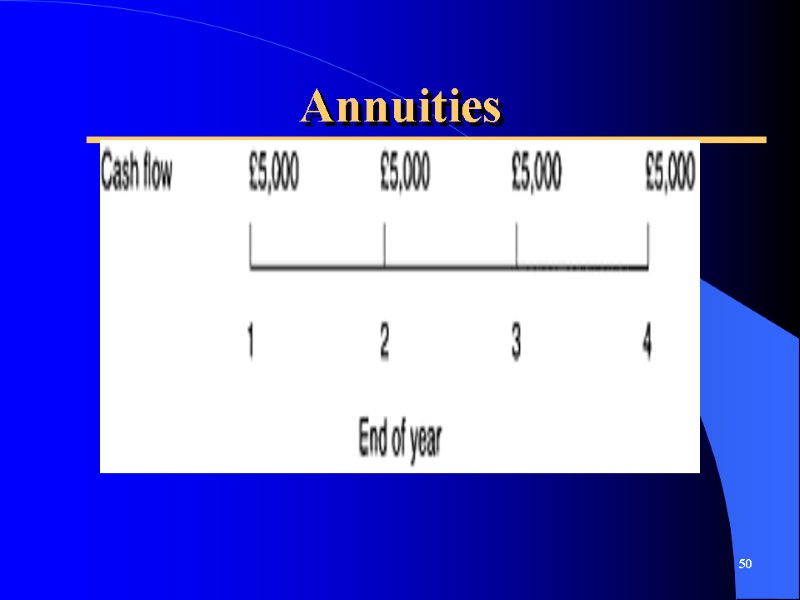
 Annuities 49 An annuity is a special cash flow pattern in which, as its name implies, a constant annual amount is to be paid or received over a defined number of years. The following figure illustrates the cash flow pattern or profile of an annuity. In this case it is a four-year £5,000 annuity in which it is assumed that the cash flows occur at the end of the year shown, sometimes called an ordinary annuity. In contrast an annuity due (Monthly Rental for Apartment) is one in which cash flows occur at the beginning of each year. Ordinary annuities are much more common than annuities due. They occur frequently in finance, particularly in the area of financial services (personal savings, investments, pensions and trust funds management).
 Annuities 50
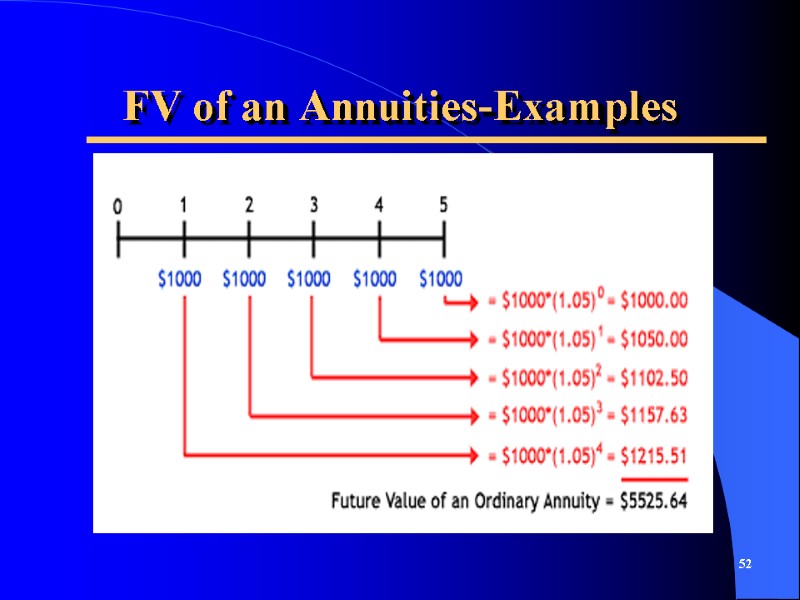
 Annuities-Examples 51 Example 8 —The future value of an annuity Anna would like to know how much she will have five years from now if she deposits £1,000 at the end of each year into a bank savings account paying a fixed annual rate of interest of 5 per cent. In other words, Anna wishes to find the future value of a five-year £1,000 annuity at a 5 per cent rate of interest. This can be determined as follows, using the future value interest factor (FVIF) from the future value tables:
 FV of an Annuities-Examples 52
 FV of an Annuities-Examples 53 Notice that since the first £1,000 is invested at the end of year one it will only earn interest for four years, thus the use of the FVIF for r equal to 5 per cent and n equal to four and similarly for the subsequent years. The final £1,000 in year 5 is invested at the very end of the annuity period so it does not earn any interest. As you can imagine the calculations for a long-term annuity would become somewhat cumbersome, so the process can be greatly simplified by using a future value interest factor for an annuity (FVIFAr,n) PMT-The Annuity Payment FVAn=PMT(FVIFAr,n)
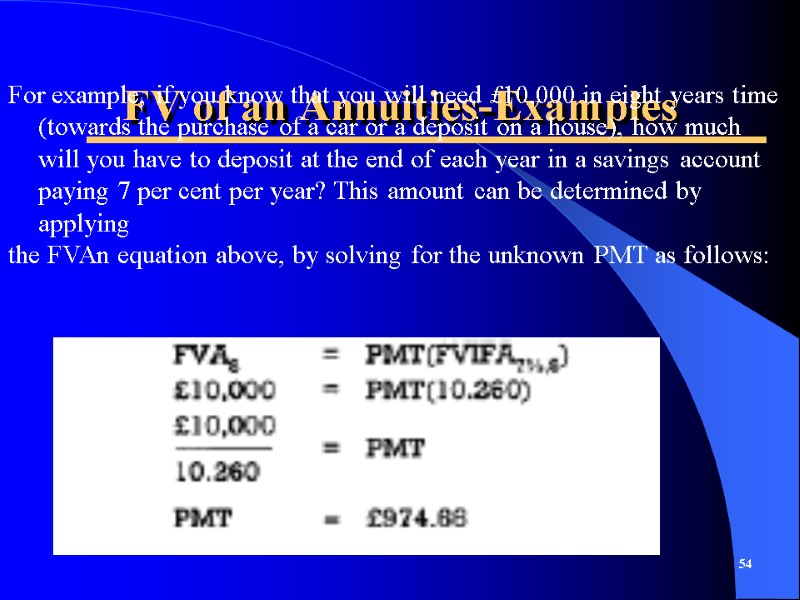
 FV of an Annuities-Examples 54 For example, if you know that you will need £10,000 in eight years time (towards the purchase of a car or a deposit on a house), how much will you have to deposit at the end of each year in a savings account paying 7 per cent per year? This amount can be determined by applying the FVAn equation above, by solving for the unknown PMT as follows:
 PV of an Annuities-Examples 55 PVAn=PMT(PVIFAr,n) Example -Paul Spender would like to know the present value of £800 due to be received at the end of each year for the next five years at an opportunity cost of 8 per cent. Expressed alternatively, Paul wishes to find the present value of a five-year £800 annuity at an 8 per cent discount rate. This can be determined by using the present value interest factor for an annuity (PVIFA), from the present value of an annuity tables. From the PVIFA tables—in this case Table A4 in Appendix A— the PVIFA factor for this example (3.993) is found where the period 5 row and the 8 per cent column intersect in Table A4: PVA5=£800(3.993) =£3,194.40 EXERCISE —PRESENT VALUE OF AN ANNUITY=£1500(4.564)=6846 Find the present value of a seven-year £1,500 annuity using a 12% discount rate.

