e7720d508af828289efce30a37c02f7f.ppt
- Количество слайдов: 111
 The TAU Performance Technology for Complex Parallel Systems (Performance Analysis Bring Your Own Code Workshop, Building 1103 Room 236, NASA Stennis Space Center, MS 39529) Sameer Shende, Allen D. Malony, Robert Bell University of Oregon {sameer, malony, bertie}@cs. uoregon. edu
 Outline r r r Motivation Part I: Overview of TAU and PDT Performance Analysis and Visualization with TAU ¦ ¦ ¦ r r Pprof Paraprof Performance Database Part II: Using TAU – a tutorial Conclusion The TAU Performance System 2 NAVO, Mar. 24 -25, 2004
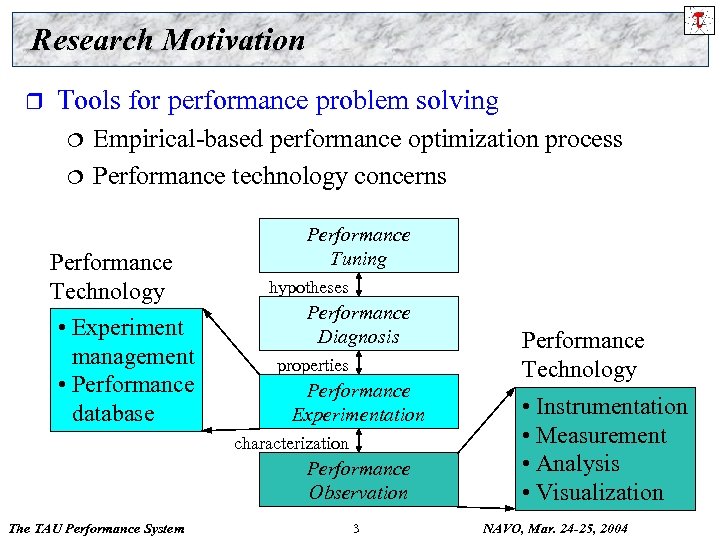 Research Motivation r Tools for performance problem solving ¦ ¦ Empirical-based performance optimization process Performance technology concerns Performance Technology • Experiment management • Performance database Performance Tuning hypotheses Performance Diagnosis properties Performance Experimentation characterization Performance Observation The TAU Performance System 3 Performance Technology • Instrumentation • Measurement • Analysis • Visualization NAVO, Mar. 24 -25, 2004
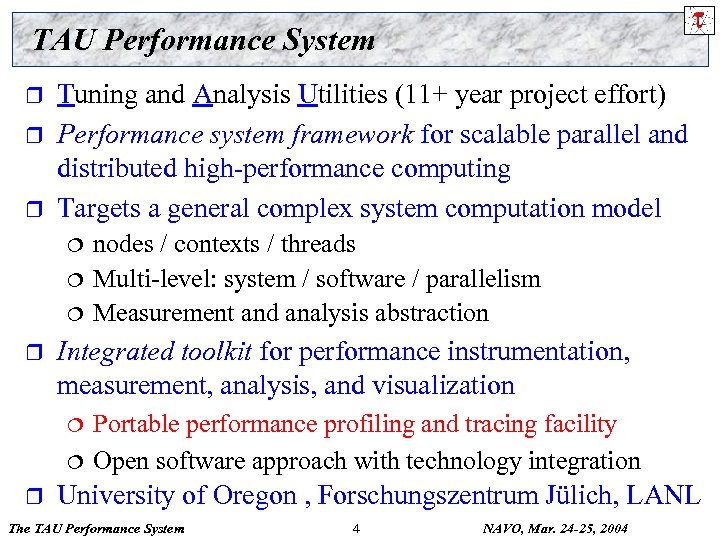 TAU Performance System r r r Tuning and Analysis Utilities (11+ year project effort) Performance system framework for scalable parallel and distributed high-performance computing Targets a general complex system computation model ¦ ¦ ¦ r Integrated toolkit for performance instrumentation, measurement, analysis, and visualization ¦ ¦ r nodes / contexts / threads Multi-level: system / software / parallelism Measurement and analysis abstraction Portable performance profiling and tracing facility Open software approach with technology integration University of Oregon , Forschungszentrum Jülich, LANL The TAU Performance System 4 NAVO, Mar. 24 -25, 2004
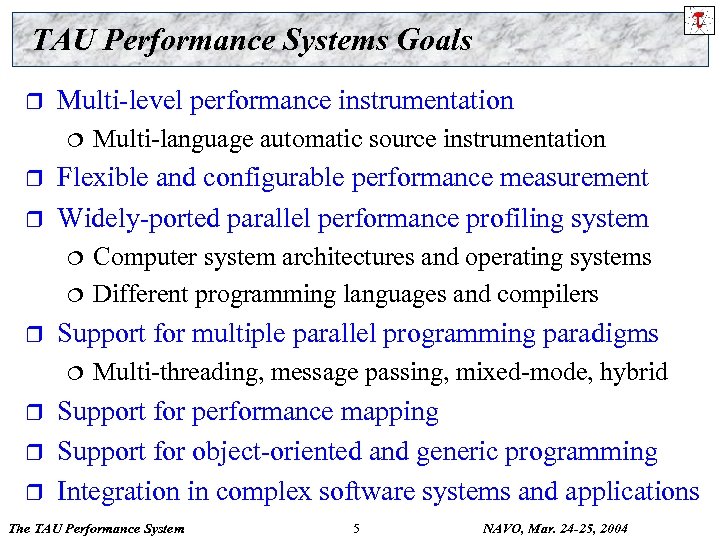 TAU Performance Systems Goals r Multi-level performance instrumentation ¦ r r Flexible and configurable performance measurement Widely-ported parallel performance profiling system ¦ ¦ r r r Computer system architectures and operating systems Different programming languages and compilers Support for multiple parallel programming paradigms ¦ r Multi-language automatic source instrumentation Multi-threading, message passing, mixed-mode, hybrid Support for performance mapping Support for object-oriented and generic programming Integration in complex software systems and applications The TAU Performance System 5 NAVO, Mar. 24 -25, 2004
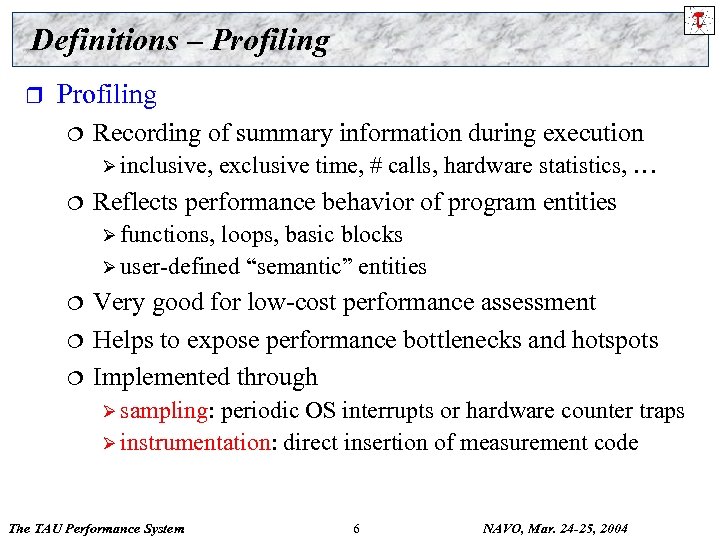 Definitions – Profiling r Profiling ¦ Recording of summary information during execution Ø inclusive, ¦ exclusive time, # calls, hardware statistics, … Reflects performance behavior of program entities Ø functions, loops, basic blocks Ø user-defined “semantic” entities ¦ ¦ ¦ Very good for low-cost performance assessment Helps to expose performance bottlenecks and hotspots Implemented through Ø sampling: periodic OS interrupts or hardware counter traps Ø instrumentation: direct insertion of measurement code The TAU Performance System 6 NAVO, Mar. 24 -25, 2004
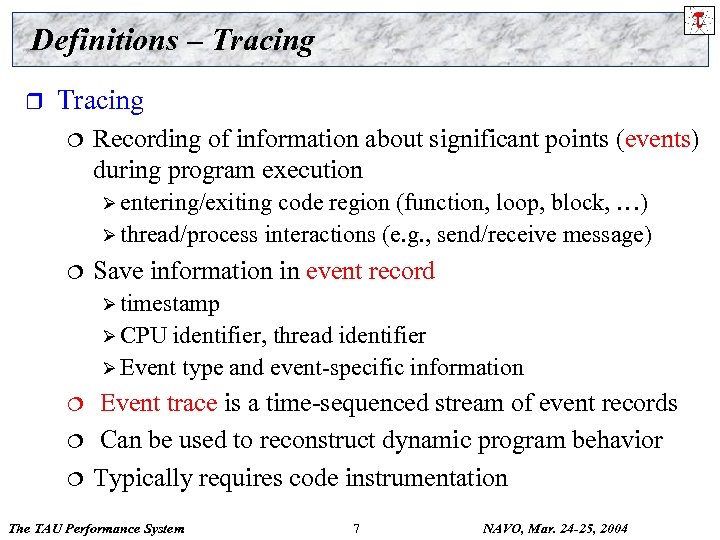 Definitions – Tracing r Tracing ¦ Recording of information about significant points (events) during program execution Ø entering/exiting code region (function, loop, block, …) Ø thread/process interactions (e. g. , send/receive message) ¦ Save information in event record Ø timestamp Ø CPU identifier, thread identifier Ø Event type and event-specific information ¦ ¦ ¦ Event trace is a time-sequenced stream of event records Can be used to reconstruct dynamic program behavior Typically requires code instrumentation The TAU Performance System 7 NAVO, Mar. 24 -25, 2004
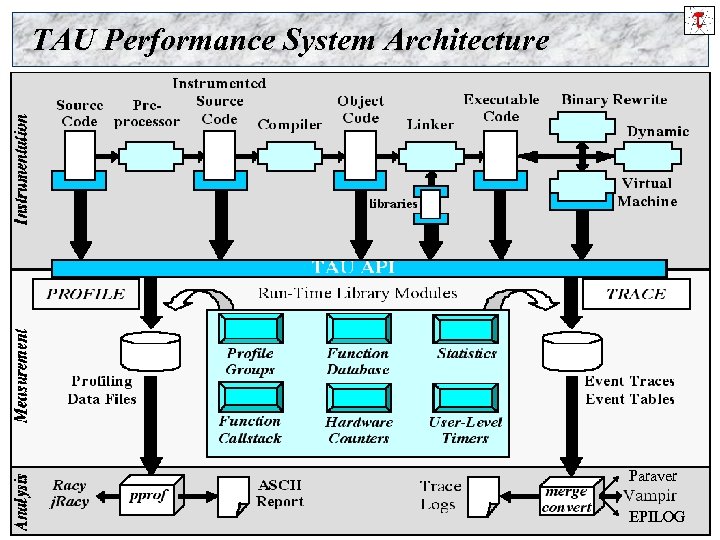 TAU Performance System Architecture Paraver The TAU Performance System 8 NAVO, Mar. 24 -25, 2004 EPILOG
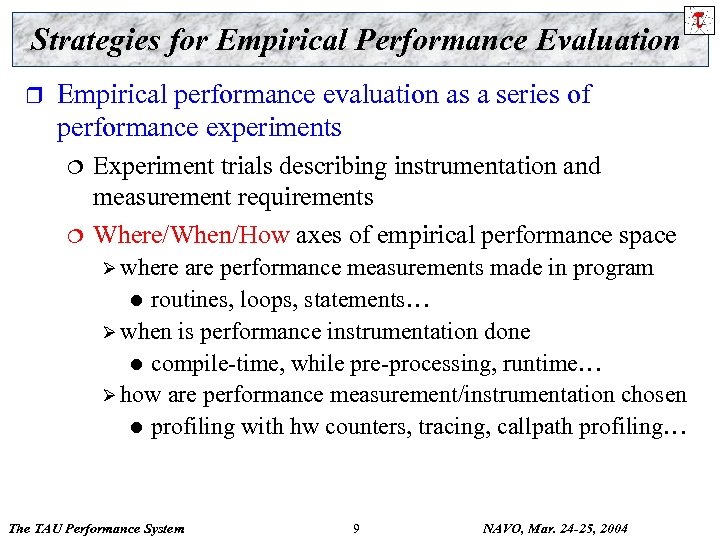 Strategies for Empirical Performance Evaluation r Empirical performance evaluation as a series of performance experiments ¦ ¦ Experiment trials describing instrumentation and measurement requirements Where/When/How axes of empirical performance space Ø where are performance measurements made in program l routines, loops, statements… Ø when is performance instrumentation done l compile-time, while pre-processing, runtime… Ø how are performance measurement/instrumentation chosen l profiling with hw counters, tracing, callpath profiling… The TAU Performance System 9 NAVO, Mar. 24 -25, 2004
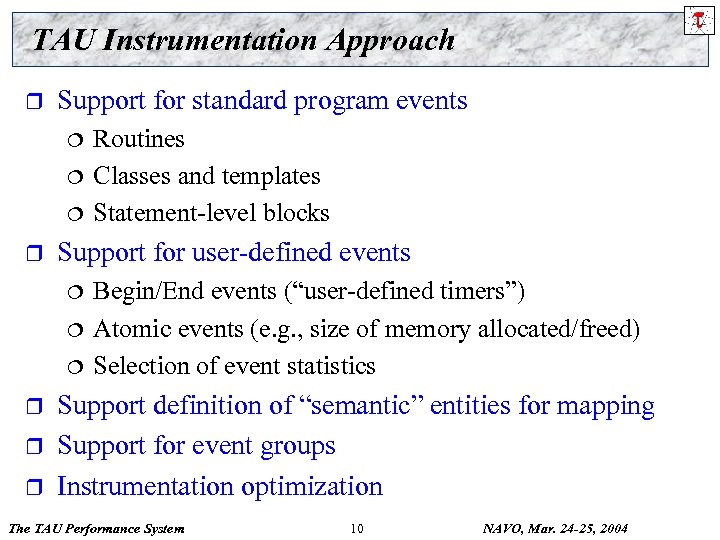 TAU Instrumentation Approach r Support for standard program events ¦ ¦ ¦ r Support for user-defined events ¦ ¦ ¦ r r r Routines Classes and templates Statement-level blocks Begin/End events (“user-defined timers”) Atomic events (e. g. , size of memory allocated/freed) Selection of event statistics Support definition of “semantic” entities for mapping Support for event groups Instrumentation optimization The TAU Performance System 10 NAVO, Mar. 24 -25, 2004
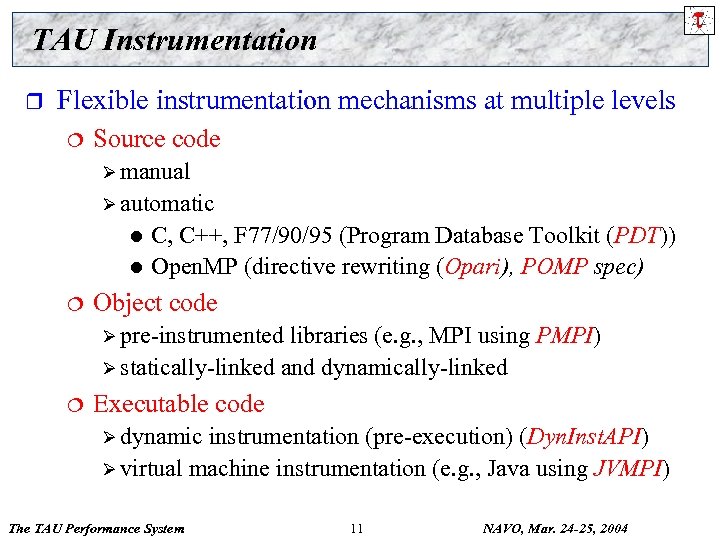 TAU Instrumentation r Flexible instrumentation mechanisms at multiple levels ¦ Source code Ø manual Ø automatic C, C++, F 77/90/95 (Program Database Toolkit (PDT)) l Open. MP (directive rewriting (Opari), POMP spec) l ¦ Object code Ø pre-instrumented libraries (e. g. , MPI using PMPI) Ø statically-linked and dynamically-linked ¦ Executable code Ø dynamic instrumentation (pre-execution) (Dyn. Inst. API) Ø virtual machine instrumentation (e. g. , Java using JVMPI) The TAU Performance System 11 NAVO, Mar. 24 -25, 2004
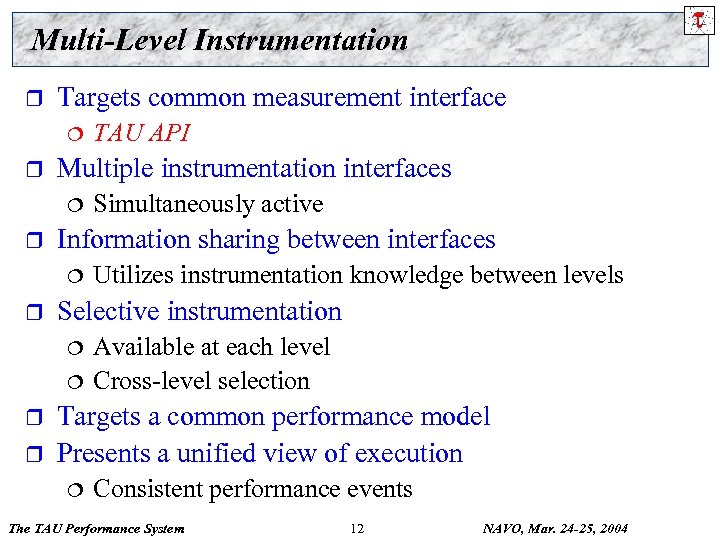 Multi-Level Instrumentation r Targets common measurement interface ¦ r Multiple instrumentation interfaces ¦ r Utilizes instrumentation knowledge between levels Selective instrumentation ¦ r Simultaneously active Information sharing between interfaces ¦ r TAU API Available at each level Cross-level selection Targets a common performance model Presents a unified view of execution ¦ Consistent performance events The TAU Performance System 12 NAVO, Mar. 24 -25, 2004
 Program Database Toolkit (PDT) r Program code analysis framework ¦ r r High-level interface to source code information Integrated toolkit for source code parsing, database creation, and database query ¦ ¦ ¦ r r develop source-based tools Commercial grade front-end parsers Portable IL analyzer, database format, and access API Open software approach for tool development Multiple source languages Implement automatic performance instrumentation tools ¦ tau_instrumentor The TAU Performance System 13 NAVO, Mar. 24 -25, 2004
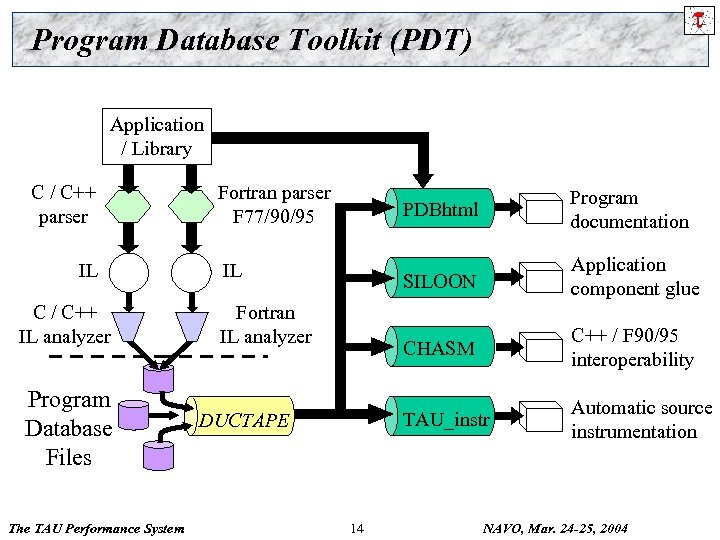 Program Database Toolkit (PDT) Application / Library C / C++ parser IL C / C++ IL analyzer Program Database Files The TAU Performance System Fortran parser F 77/90/95 PDBhtml SILOON DUCTAPE 14 C++ / F 90/95 interoperability TAU_instr Fortran IL analyzer Application component glue CHASM IL Program documentation Automatic source instrumentation NAVO, Mar. 24 -25, 2004
 PDT 3. 1 Functionality r C++ statement-level information implementation ¦ ¦ r DUCTAPE ¦ r for, while loops, declarations, initialization, assignment… PDB records defined for most constructs Processes PDB 1. x, 2. x, 3. x uniformly PDT applications ¦ XMLgen Ø PDB to XML converter Ø Used for CHASM and CCA tools ¦ PDBstmt Ø Statement The TAU Performance System callgraph display tool 15 NAVO, Mar. 24 -25, 2004
 PDT 3. 1 Functionality (continued) r Cleanscape Flint parser fully integrated for F 90/95 ¦ ¦ Flint parser (f 95 parse) is very robust Produces PDB records for TAU instrumentation (stage 1) Ø Linux (x 86, IA-64, Opteron, Power 4), HP Tru 64, IBM AIX, Cray X 1, T 3 E, Solaris, SGI, Apple, Windows, Power 4 Linux (IBM Blue Gene/L compatible) ¦ ¦ r r Full PDB 2. 0 specification (stage 2) [SC’ 04] Statement level support (stage 3) [SC’ 04] PDT 3. 1 released in March 2004. URL: http: //www. cs. uoregon. edu/research/paracomp/pdtoolkit The TAU Performance System 16 NAVO, Mar. 24 -25, 2004
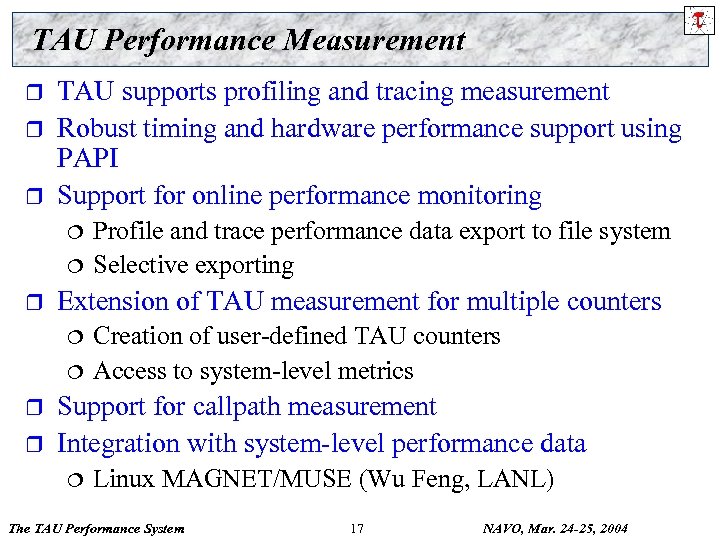 TAU Performance Measurement r r r TAU supports profiling and tracing measurement Robust timing and hardware performance support using PAPI Support for online performance monitoring ¦ ¦ r Extension of TAU measurement for multiple counters ¦ ¦ r r Profile and trace performance data export to file system Selective exporting Creation of user-defined TAU counters Access to system-level metrics Support for callpath measurement Integration with system-level performance data ¦ Linux MAGNET/MUSE (Wu Feng, LANL) The TAU Performance System 17 NAVO, Mar. 24 -25, 2004
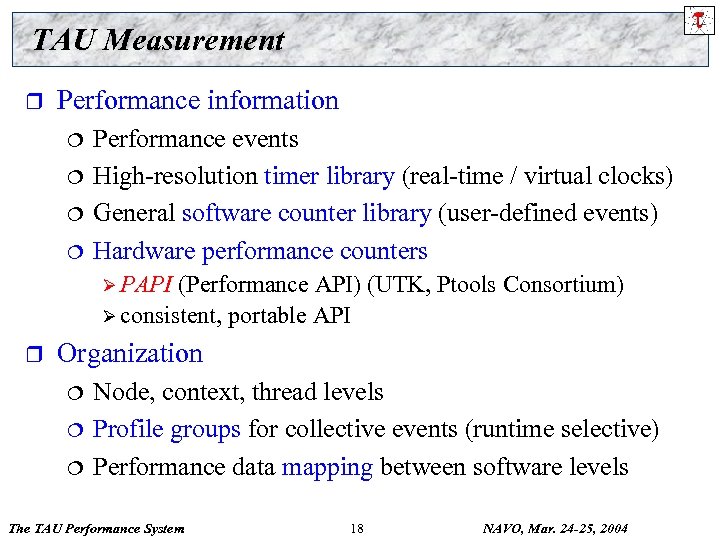 TAU Measurement r Performance information ¦ ¦ Performance events High-resolution timer library (real-time / virtual clocks) General software counter library (user-defined events) Hardware performance counters Ø PAPI (Performance API) (UTK, Ptools Consortium) Ø consistent, portable API r Organization ¦ ¦ ¦ Node, context, thread levels Profile groups for collective events (runtime selective) Performance data mapping between software levels The TAU Performance System 18 NAVO, Mar. 24 -25, 2004
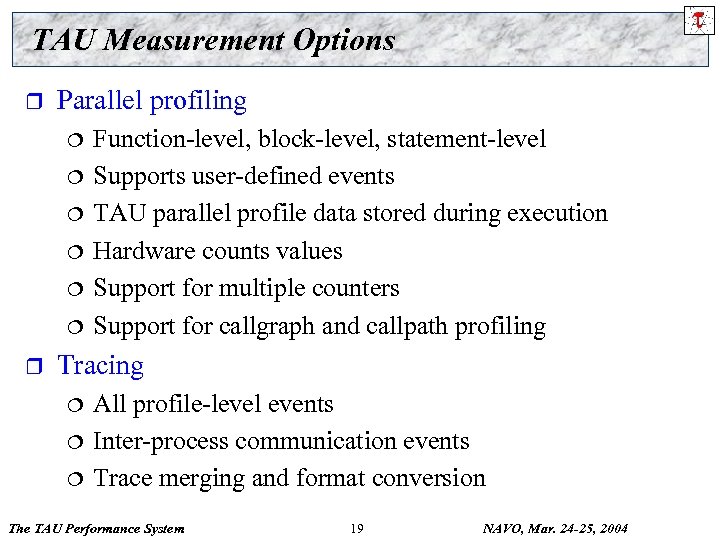 TAU Measurement Options r Parallel profiling ¦ ¦ ¦ r Function-level, block-level, statement-level Supports user-defined events TAU parallel profile data stored during execution Hardware counts values Support for multiple counters Support for callgraph and callpath profiling Tracing ¦ ¦ ¦ All profile-level events Inter-process communication events Trace merging and format conversion The TAU Performance System 19 NAVO, Mar. 24 -25, 2004
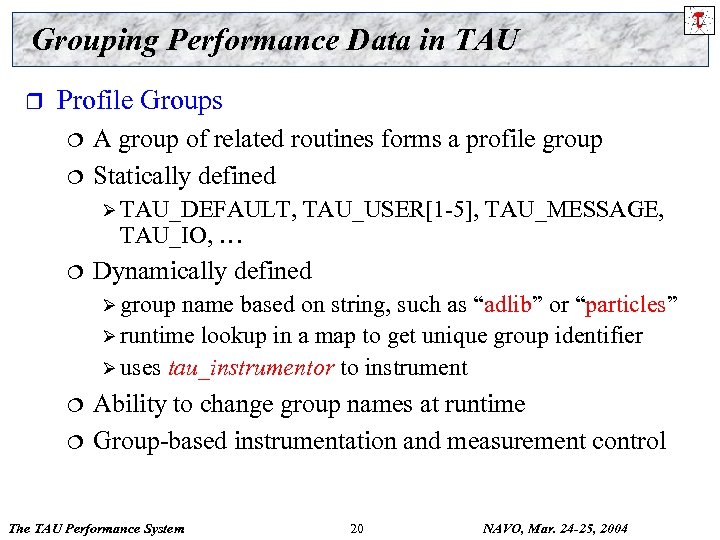 Grouping Performance Data in TAU r Profile Groups ¦ ¦ A group of related routines forms a profile group Statically defined Ø TAU_DEFAULT, TAU_IO, … ¦ TAU_USER[1 -5], TAU_MESSAGE, Dynamically defined Ø group name based on string, such as “adlib” or “particles” Ø runtime lookup in a map to get unique group identifier Ø uses tau_instrumentor to instrument ¦ ¦ Ability to change group names at runtime Group-based instrumentation and measurement control The TAU Performance System 20 NAVO, Mar. 24 -25, 2004
 TAU Analysis r Parallel profile analysis ¦ Pprof Ø parallel ¦ profiler with text-based display Para. Prof Ø Graphical, r scalable, parallel profile analysis and display Trace analysis and visualization ¦ ¦ ¦ Trace merging and clock adjustment (if necessary) Trace format conversion (ALOG, SDDF, VTF, Paraver) Trace visualization using Vampir (Pallas/Intel) The TAU Performance System 21 NAVO, Mar. 24 -25, 2004
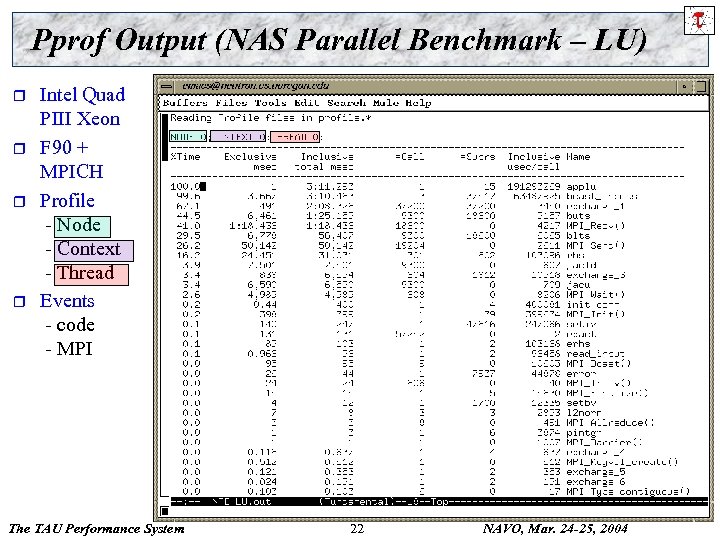 Pprof Output (NAS Parallel Benchmark – LU) r r Intel Quad PIII Xeon F 90 + MPICH Profile - Node - Context - Thread Events - code - MPI The TAU Performance System 22 NAVO, Mar. 24 -25, 2004
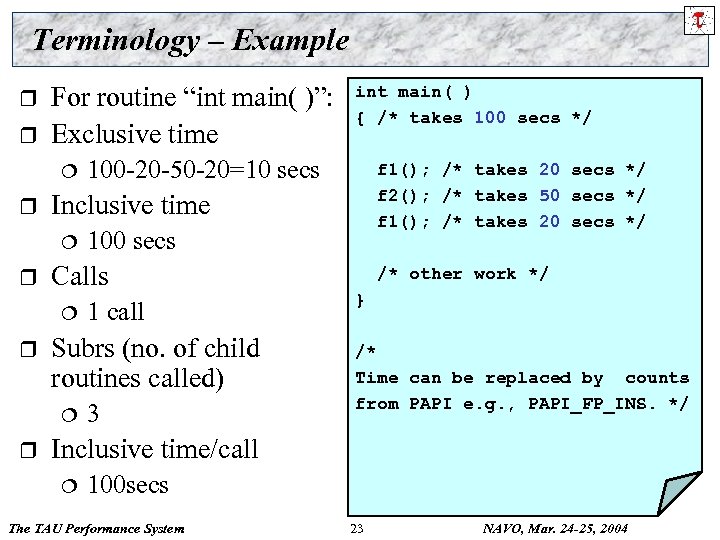 Terminology – Example r r For routine “int main( )”: Exclusive time ¦ r Inclusive time ¦ r 1 call Subrs (no. of child routines called) ¦ r 100 secs Calls ¦ r 100 -20 -50 -20=10 secs 3 int main( ) { /* takes 100 secs */ f 1(); /* takes 20 secs */ f 2(); /* takes 50 secs */ f 1(); /* takes 20 secs */ /* other work */ } /* Time can be replaced by counts from PAPI e. g. , PAPI_FP_INS. */ Inclusive time/call ¦ 100 secs The TAU Performance System 23 NAVO, Mar. 24 -25, 2004
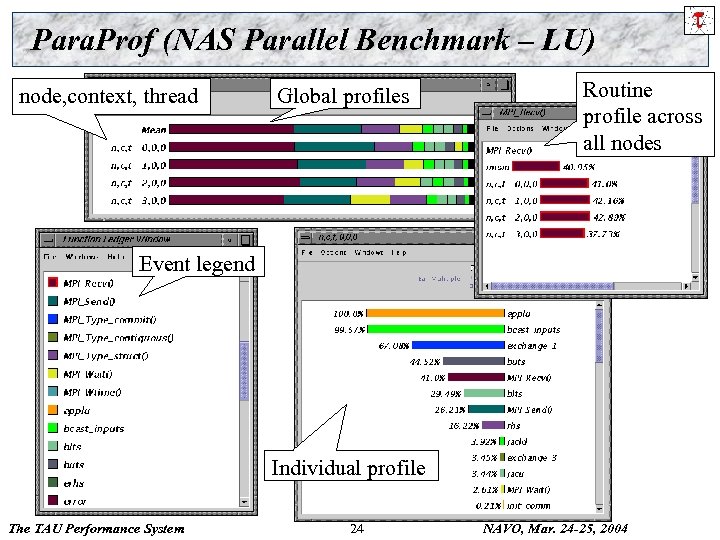 Para. Prof (NAS Parallel Benchmark – LU) node, context, thread Global profiles Routine profile across all nodes Event legend Individual profile The TAU Performance System 24 NAVO, Mar. 24 -25, 2004
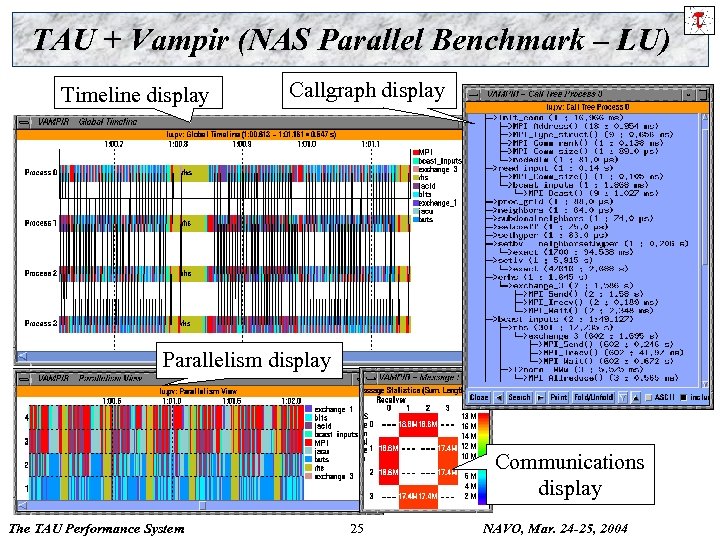 TAU + Vampir (NAS Parallel Benchmark – LU) Timeline display Callgraph display Parallelism display Communications display The TAU Performance System 25 NAVO, Mar. 24 -25, 2004
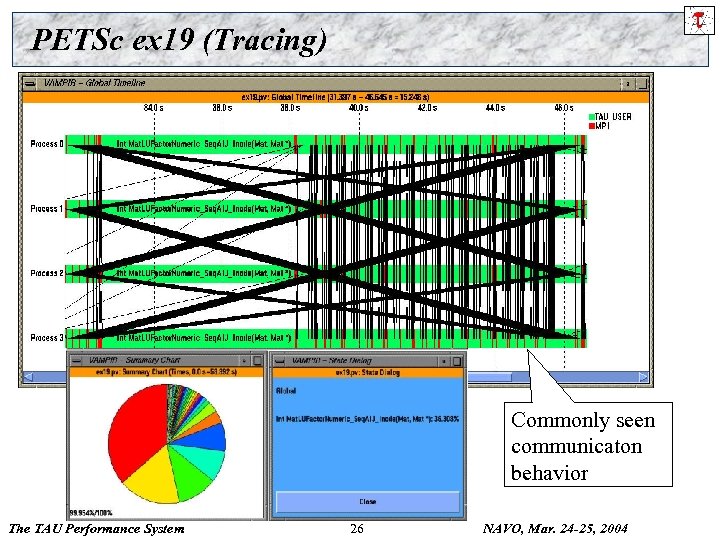 PETSc ex 19 (Tracing) Commonly seen communicaton behavior The TAU Performance System 26 NAVO, Mar. 24 -25, 2004
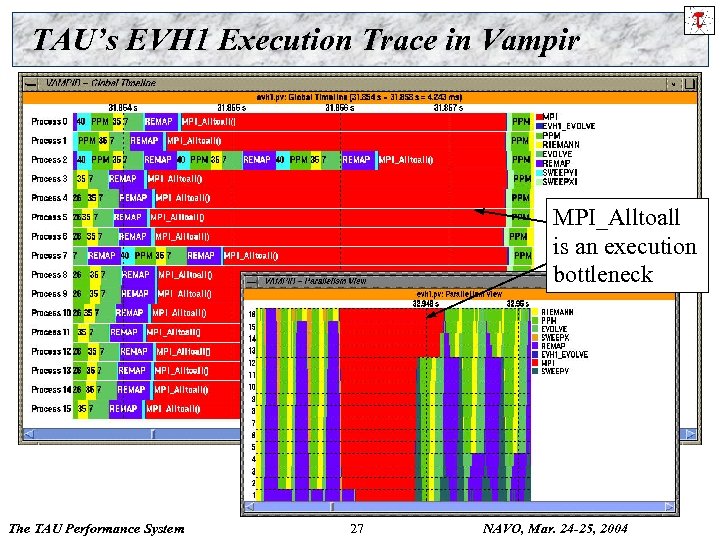 TAU’s EVH 1 Execution Trace in Vampir MPI_Alltoall is an execution bottleneck The TAU Performance System 27 NAVO, Mar. 24 -25, 2004
 Performance Analysis and Visualization r r Analysis of parallel profile and trace measurement Parallel profile analysis ¦ ¦ r r Performance database framework (Perf. DBF) Parallel trace analysis ¦ ¦ r Para. Profile generation from trace data Translation to VTF 3. 0 and EPILOG Integration with VNG (Technical University of Dresden) Online parallel analysis and visualization The TAU Performance System 28 NAVO, Mar. 24 -25, 2004
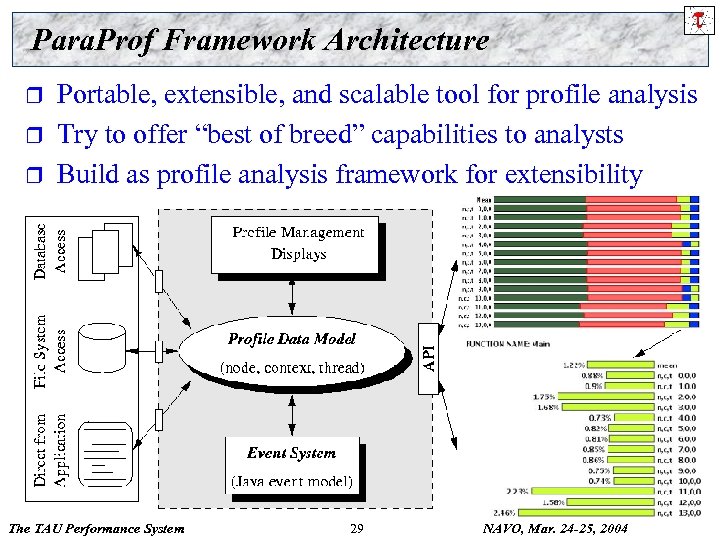 Para. Prof Framework Architecture r r r Portable, extensible, and scalable tool for profile analysis Try to offer “best of breed” capabilities to analysts Build as profile analysis framework for extensibility The TAU Performance System 29 NAVO, Mar. 24 -25, 2004
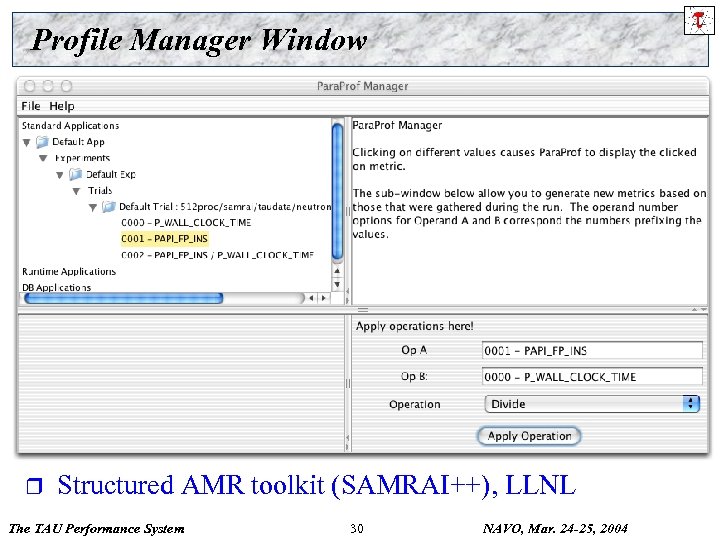 Profile Manager Window r Structured AMR toolkit (SAMRAI++), LLNL The TAU Performance System 30 NAVO, Mar. 24 -25, 2004
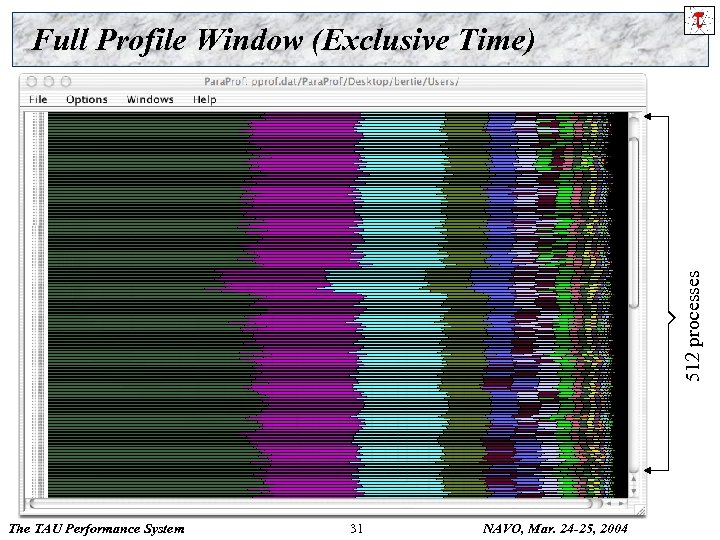 512 processes Full Profile Window (Exclusive Time) The TAU Performance System 31 NAVO, Mar. 24 -25, 2004
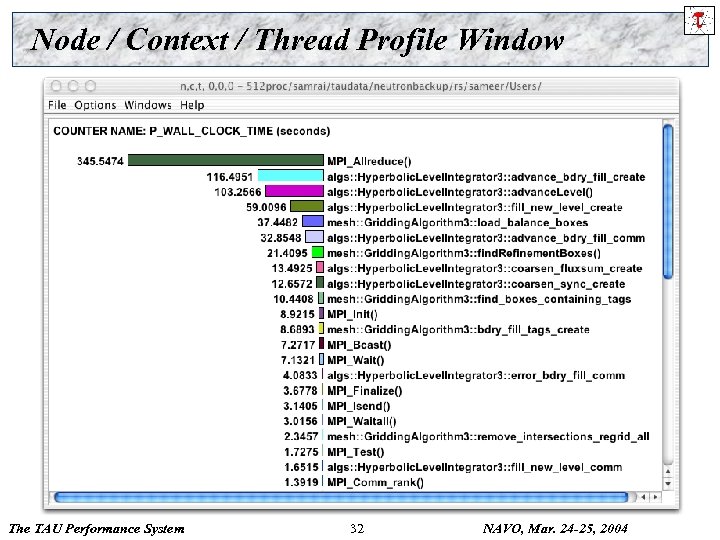 Node / Context / Thread Profile Window The TAU Performance System 32 NAVO, Mar. 24 -25, 2004
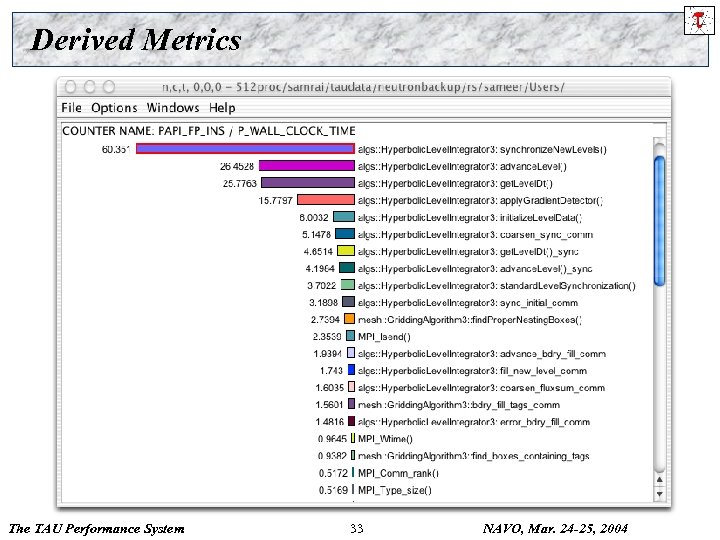 Derived Metrics The TAU Performance System 33 NAVO, Mar. 24 -25, 2004
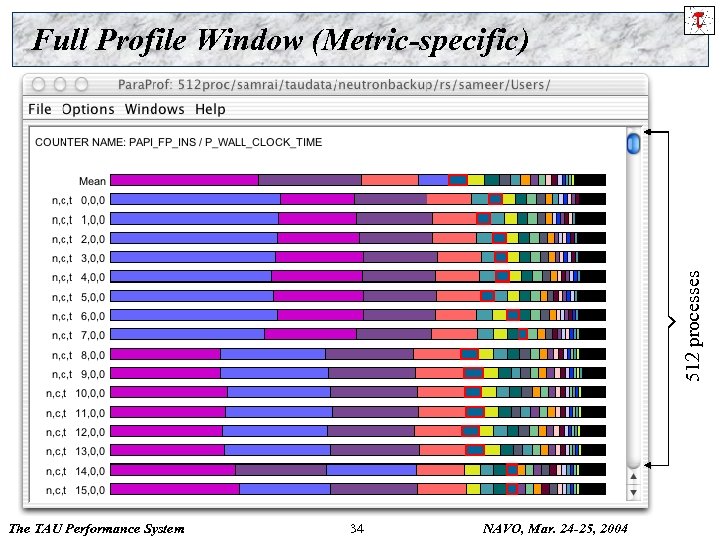 512 processes Full Profile Window (Metric-specific) The TAU Performance System 34 NAVO, Mar. 24 -25, 2004
 Para. Prof Enhancements r r r Readers completely separated from the GUI Access to performance profile database Profile translators ¦ r Callgraph display ¦ r r r prof/gprof style with hyperlinks Integration of 3 D performance plotting library Scalable profile analysis ¦ r mpi. P, papiprof, dynaprof Statistical histograms, cluster analysis, … Generalized programmable analysis engine Cross-experiment analysis The TAU Performance System 35 NAVO, Mar. 24 -25, 2004
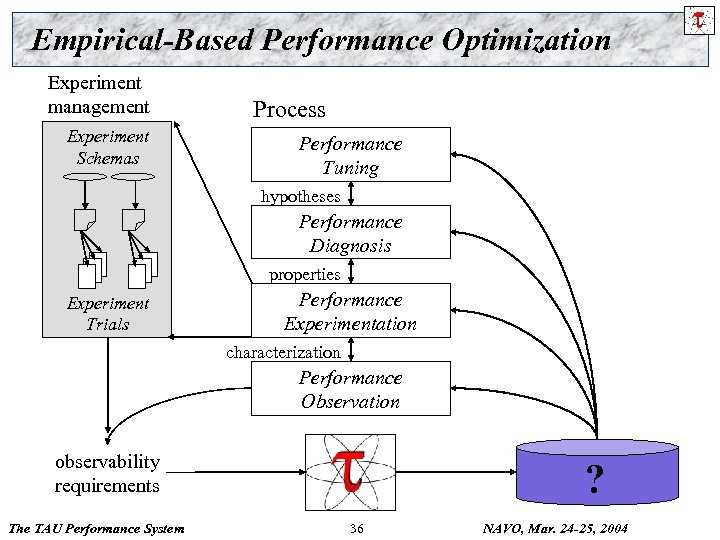 Empirical-Based Performance Optimization Experiment management Experiment Schemas Process Performance Tuning hypotheses Performance Diagnosis properties Experiment Trials Performance Experimentation characterization Performance Observation observability requirements The TAU Performance System ? 36 NAVO, Mar. 24 -25, 2004
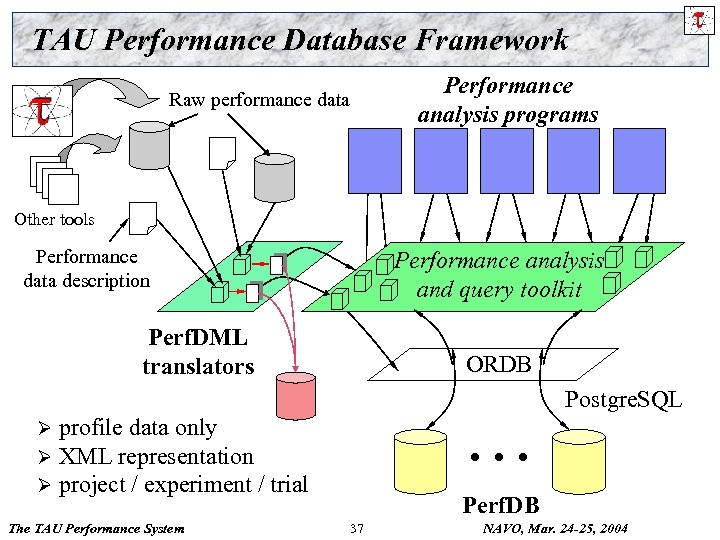 TAU Performance Database Framework Raw performance data Performance analysis programs Other tools Performance data description Performance analysis and query toolkit Perf. DML translators ORDB Postgre. SQL Ø Ø Ø profile data only XML representation project / experiment / trial The TAU Performance System . . . Perf. DB 37 NAVO, Mar. 24 -25, 2004
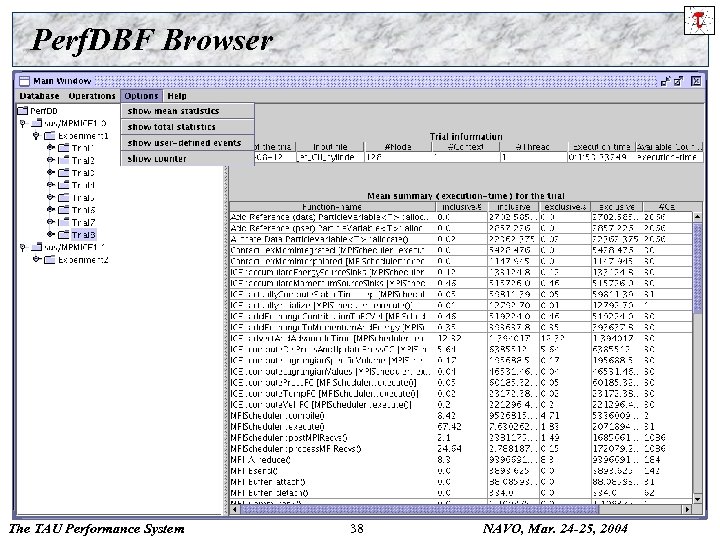 Perf. DBF Browser The TAU Performance System 38 NAVO, Mar. 24 -25, 2004
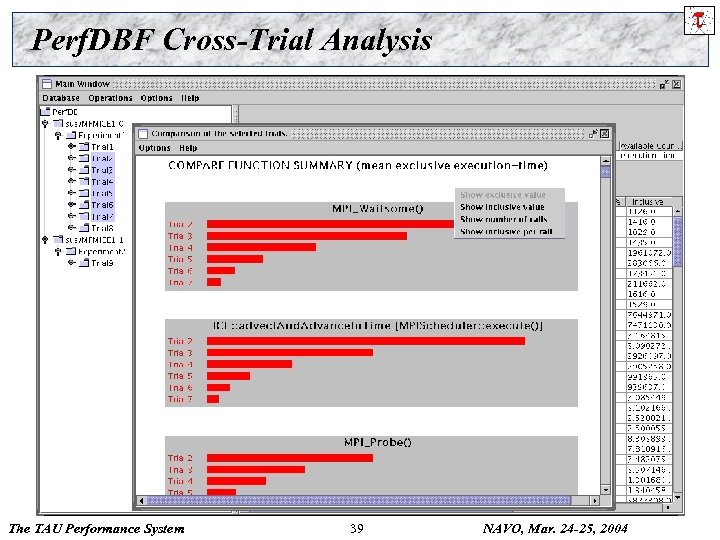 Perf. DBF Cross-Trial Analysis The TAU Performance System 39 NAVO, Mar. 24 -25, 2004
 Using TAU – A tutorial r r Configuration Instrumentation ¦ ¦ ¦ Manual PDT- Source rewriting for C, C++, F 77/90/95 MPI – Wrapper interposition library Open. MP – Directive rewriting Binary Instrumentation Ø Dyninst. API – Runtime/Rewriting binary Ø Java – Runtime instrumentation Ø Python – Runtime instrumentation r r Measurement Performance Analysis The TAU Performance System 40 NAVO, Mar. 24 -25, 2004
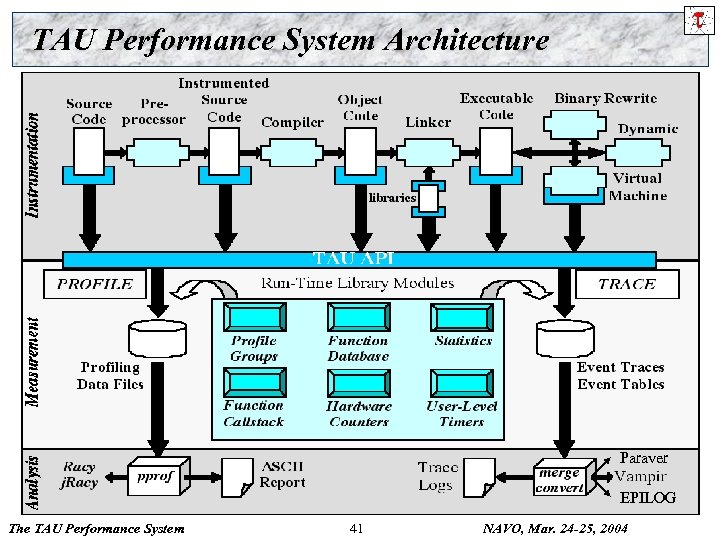 TAU Performance System Architecture Paraver EPILOG The TAU Performance System 41 NAVO, Mar. 24 -25, 2004
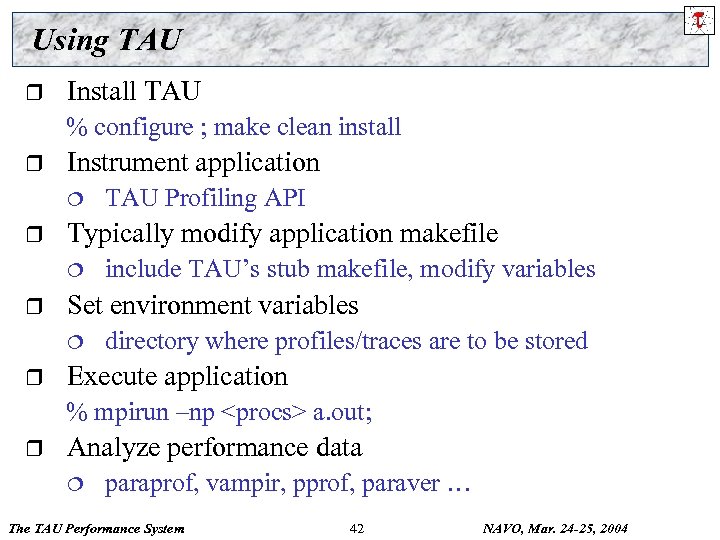 Using TAU r Install TAU % configure ; make clean install r Instrument application ¦ r Typically modify application makefile ¦ r include TAU’s stub makefile, modify variables Set environment variables ¦ r TAU Profiling API directory where profiles/traces are to be stored Execute application % mpirun –np
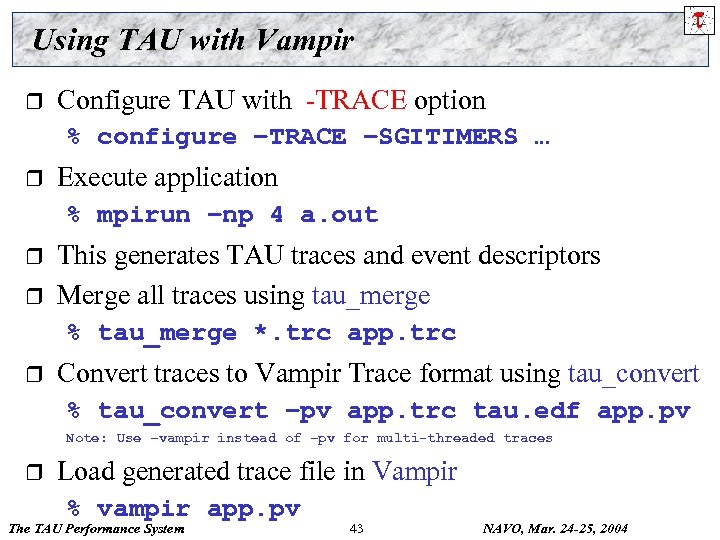 Using TAU with Vampir r Configure TAU with -TRACE option % configure –TRACE –SGITIMERS … r Execute application % mpirun –np 4 a. out r r This generates TAU traces and event descriptors Merge all traces using tau_merge % tau_merge *. trc app. trc r Convert traces to Vampir Trace format using tau_convert % tau_convert –pv app. trc tau. edf app. pv Note: Use –vampir instead of –pv for multi-threaded traces r Load generated trace file in Vampir % vampir app. pv The TAU Performance System 43 NAVO, Mar. 24 -25, 2004
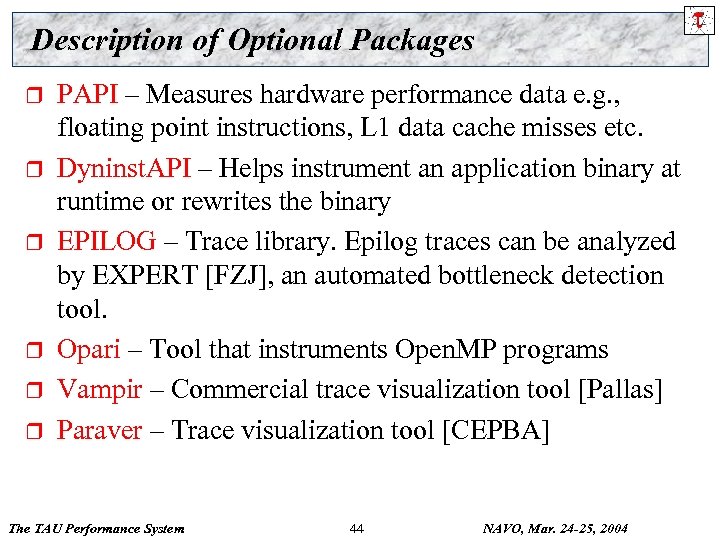 Description of Optional Packages r r r PAPI – Measures hardware performance data e. g. , floating point instructions, L 1 data cache misses etc. Dyninst. API – Helps instrument an application binary at runtime or rewrites the binary EPILOG – Trace library. Epilog traces can be analyzed by EXPERT [FZJ], an automated bottleneck detection tool. Opari – Tool that instruments Open. MP programs Vampir – Commercial trace visualization tool [Pallas] Paraver – Trace visualization tool [CEPBA] The TAU Performance System 44 NAVO, Mar. 24 -25, 2004
![TAU Measurement System Configuration r configure [OPTIONS] ¦ ¦ ¦ {-c++=<CC>, -cc=<cc>} Specify C++ TAU Measurement System Configuration r configure [OPTIONS] ¦ ¦ ¦ {-c++=<CC>, -cc=<cc>} Specify C++](https://present5.com/presentation/e7720d508af828289efce30a37c02f7f/image-45.jpg) TAU Measurement System Configuration r configure [OPTIONS] ¦ ¦ ¦ {-c++=
TAU Measurement System Configuration r configure [OPTIONS] ¦ ¦ ¦ {-c++=
![TAU Measurement System Configuration r configure [OPTIONS] ¦ ¦ ¦ -TRACE Generate binary TAU TAU Measurement System Configuration r configure [OPTIONS] ¦ ¦ ¦ -TRACE Generate binary TAU](https://present5.com/presentation/e7720d508af828289efce30a37c02f7f/image-46.jpg) TAU Measurement System Configuration r configure [OPTIONS] ¦ ¦ ¦ -TRACE Generate binary TAU traces -PROFILE (default) Generate profiles (summary) -PROFILECALLPATH Generate call path profiles -PROFILESTATS Generate std. dev. statistics -MULTIPLECOUNTERS Use hardware counters + time -COMPENSATE Compensate timer overhead -CPUTIME Use usertime+system time -PAPIWALLCLOCK Use PAPI’s wallclock time -PAPIVIRTUAL Use PAPI’s process virtual time -SGITIMERSUse fast IRIX timers -LINUXTIMERS Use fast x 86 Linux timers The TAU Performance System 46 NAVO, Mar. 24 -25, 2004
TAU Measurement System Configuration r configure [OPTIONS] ¦ ¦ ¦ -TRACE Generate binary TAU traces -PROFILE (default) Generate profiles (summary) -PROFILECALLPATH Generate call path profiles -PROFILESTATS Generate std. dev. statistics -MULTIPLECOUNTERS Use hardware counters + time -COMPENSATE Compensate timer overhead -CPUTIME Use usertime+system time -PAPIWALLCLOCK Use PAPI’s wallclock time -PAPIVIRTUAL Use PAPI’s process virtual time -SGITIMERSUse fast IRIX timers -LINUXTIMERS Use fast x 86 Linux timers The TAU Performance System 46 NAVO, Mar. 24 -25, 2004
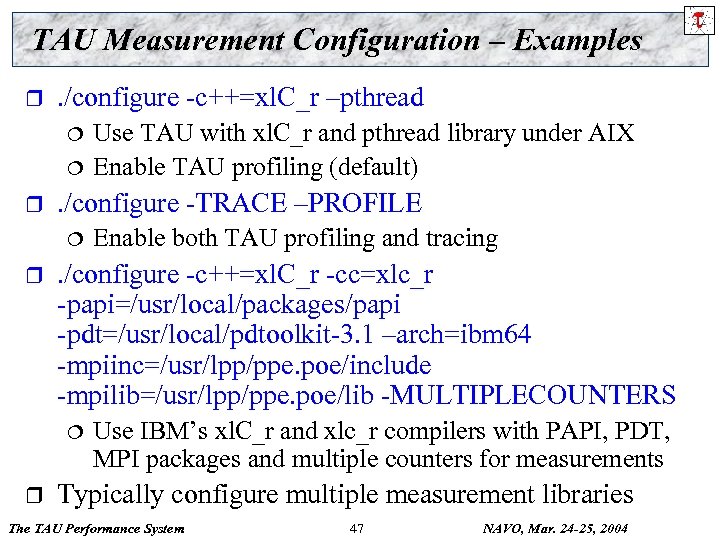 TAU Measurement Configuration – Examples r . /configure -c++=xl. C_r –pthread ¦ ¦ r . /configure -TRACE –PROFILE ¦ r Enable both TAU profiling and tracing . /configure -c++=xl. C_r -cc=xlc_r -papi=/usr/local/packages/papi -pdt=/usr/local/pdtoolkit-3. 1 –arch=ibm 64 -mpiinc=/usr/lpp/ppe. poe/include -mpilib=/usr/lpp/ppe. poe/lib -MULTIPLECOUNTERS ¦ r Use TAU with xl. C_r and pthread library under AIX Enable TAU profiling (default) Use IBM’s xl. C_r and xlc_r compilers with PAPI, PDT, MPI packages and multiple counters for measurements Typically configure multiple measurement libraries The TAU Performance System 47 NAVO, Mar. 24 -25, 2004
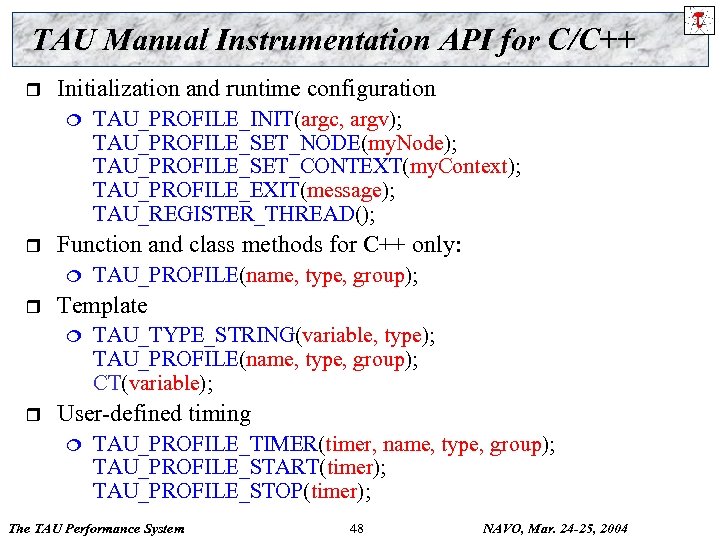 TAU Manual Instrumentation API for C/C++ r Initialization and runtime configuration ¦ r Function and class methods for C++ only: ¦ r TAU_PROFILE(name, type, group); Template ¦ r TAU_PROFILE_INIT(argc, argv); TAU_PROFILE_SET_NODE(my. Node); TAU_PROFILE_SET_CONTEXT(my. Context); TAU_PROFILE_EXIT(message); TAU_REGISTER_THREAD(); TAU_TYPE_STRING(variable, type); TAU_PROFILE(name, type, group); CT(variable); User-defined timing ¦ TAU_PROFILE_TIMER(timer, name, type, group); TAU_PROFILE_START(timer); TAU_PROFILE_STOP(timer); The TAU Performance System 48 NAVO, Mar. 24 -25, 2004
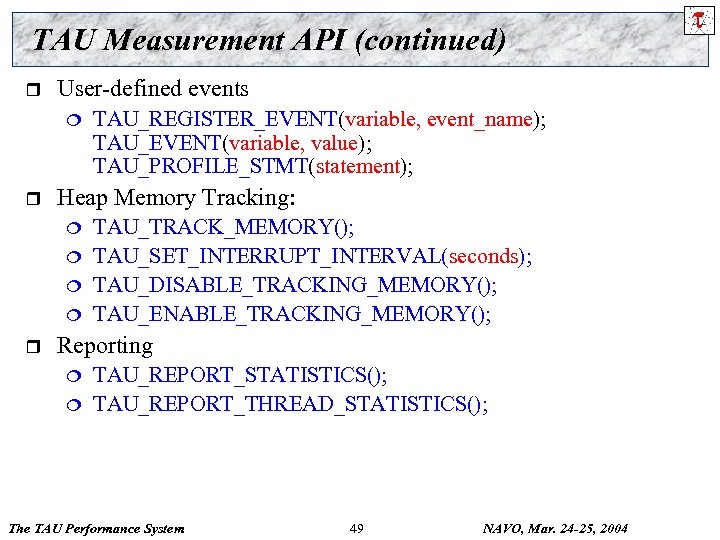 TAU Measurement API (continued) r User-defined events ¦ r Heap Memory Tracking: ¦ ¦ r TAU_REGISTER_EVENT(variable, event_name); TAU_EVENT(variable, value); TAU_PROFILE_STMT(statement); TAU_TRACK_MEMORY(); TAU_SET_INTERRUPT_INTERVAL(seconds); TAU_DISABLE_TRACKING_MEMORY(); TAU_ENABLE_TRACKING_MEMORY(); Reporting ¦ ¦ TAU_REPORT_STATISTICS(); TAU_REPORT_THREAD_STATISTICS(); The TAU Performance System 49 NAVO, Mar. 24 -25, 2004
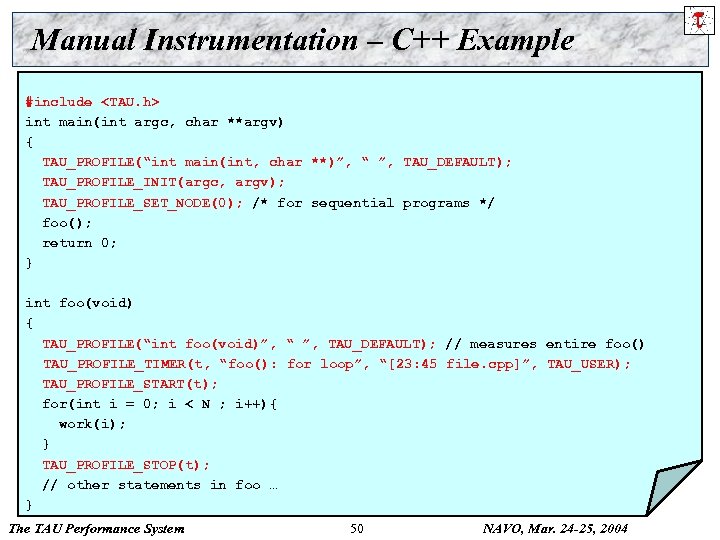 Manual Instrumentation – C++ Example #include
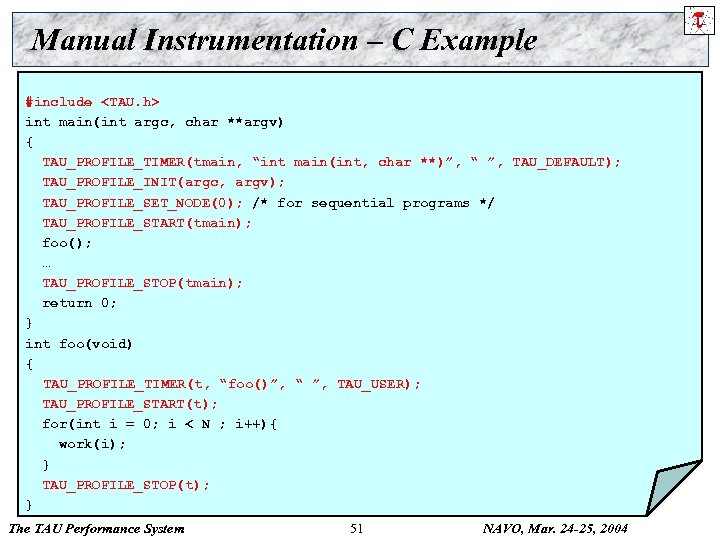 Manual Instrumentation – C Example #include
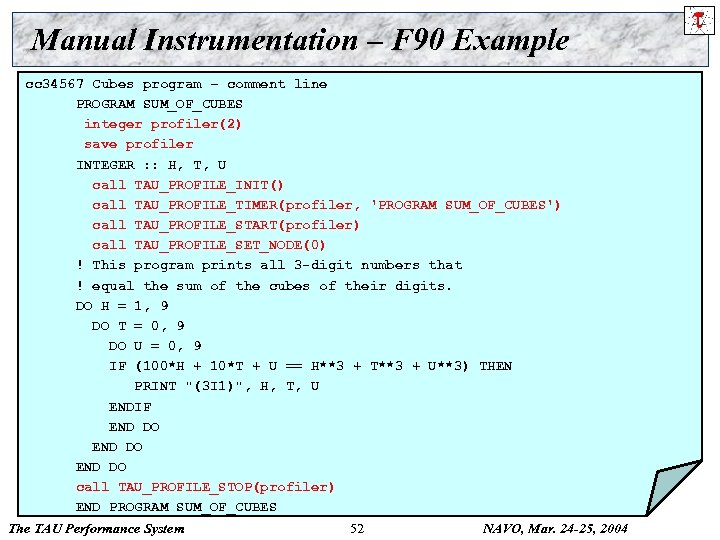 Manual Instrumentation – F 90 Example cc 34567 Cubes program – comment line PROGRAM SUM_OF_CUBES integer profiler(2) save profiler INTEGER : : H, T, U call TAU_PROFILE_INIT() call TAU_PROFILE_TIMER(profiler, 'PROGRAM SUM_OF_CUBES') call TAU_PROFILE_START(profiler) call TAU_PROFILE_SET_NODE(0) ! This program prints all 3 -digit numbers that ! equal the sum of the cubes of their digits. DO H = 1, 9 DO T = 0, 9 DO U = 0, 9 IF (100*H + 10*T + U == H**3 + T**3 + U**3) THEN PRINT "(3 I 1)", H, T, U ENDIF END DO call TAU_PROFILE_STOP(profiler) END PROGRAM SUM_OF_CUBES The TAU Performance System 52 NAVO, Mar. 24 -25, 2004
![Compiling % configure [options] % make clean install Creates <arch>/lib/Makefile. tau<options> stub Makefile and Compiling % configure [options] % make clean install Creates <arch>/lib/Makefile. tau<options> stub Makefile and](https://present5.com/presentation/e7720d508af828289efce30a37c02f7f/image-53.jpg) Compiling % configure [options] % make clean install Creates
Compiling % configure [options] % make clean install Creates
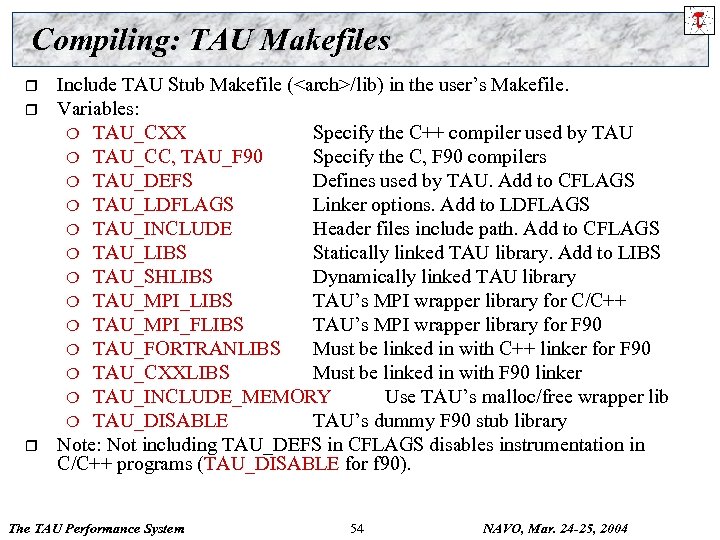 Compiling: TAU Makefiles r r r Include TAU Stub Makefile (
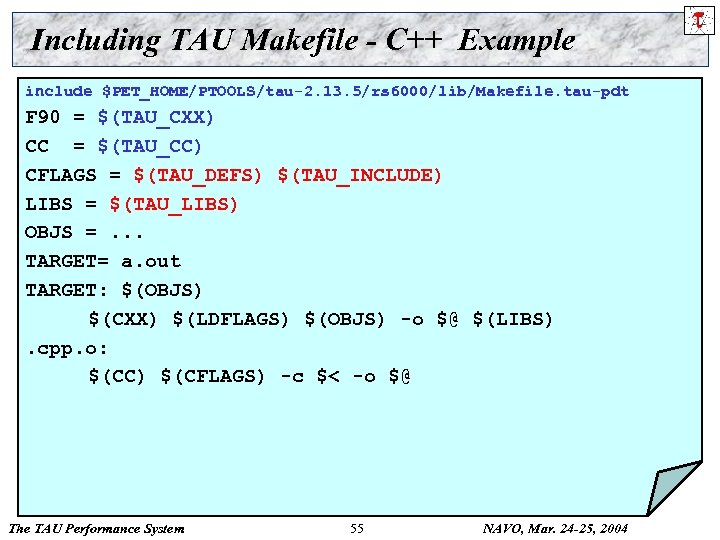 Including TAU Makefile - C++ Example include $PET_HOME/PTOOLS/tau-2. 13. 5/rs 6000/lib/Makefile. tau-pdt F 90 = $(TAU_CXX) CC = $(TAU_CC) CFLAGS = $(TAU_DEFS) $(TAU_INCLUDE) LIBS = $(TAU_LIBS) OBJS =. . . TARGET= a. out TARGET: $(OBJS) $(CXX) $(LDFLAGS) $(OBJS) -o $@ $(LIBS). cpp. o: $(CC) $(CFLAGS) -c $< -o $@ The TAU Performance System 55 NAVO, Mar. 24 -25, 2004
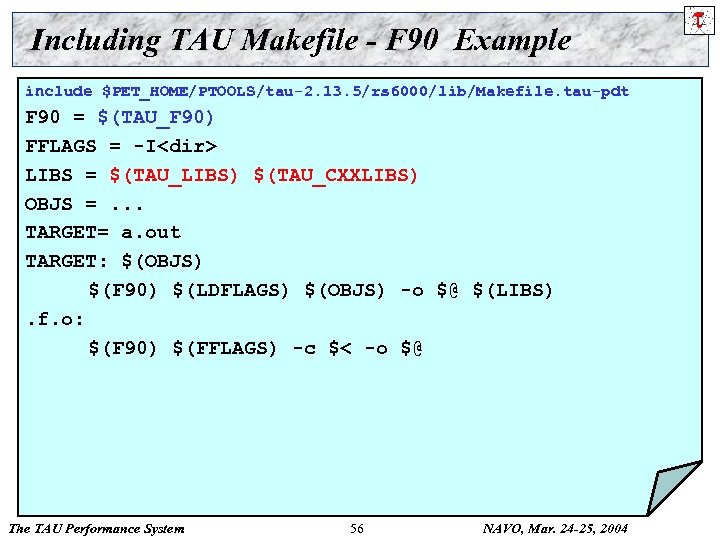 Including TAU Makefile - F 90 Example include $PET_HOME/PTOOLS/tau-2. 13. 5/rs 6000/lib/Makefile. tau-pdt F 90 = $(TAU_F 90) FFLAGS = -I
 Including TAU Makefile - F 90 Example include $PET_HOME/PTOOLS/tau-2. 13. 5/rs 6000/lib/Makefile. tau-pdt F 90 = $(TAU_F 90) FFLAGS = -I
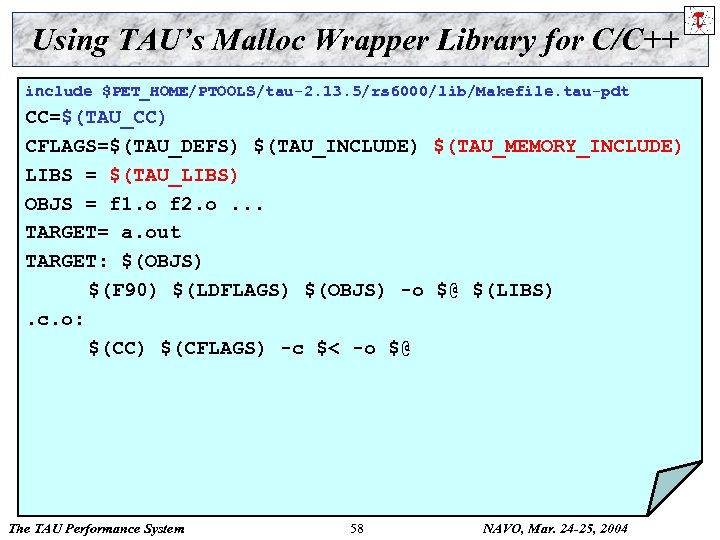 Using TAU’s Malloc Wrapper Library for C/C++ include $PET_HOME/PTOOLS/tau-2. 13. 5/rs 6000/lib/Makefile. tau-pdt CC=$(TAU_CC) CFLAGS=$(TAU_DEFS) $(TAU_INCLUDE) $(TAU_MEMORY_INCLUDE) LIBS = $(TAU_LIBS) OBJS = f 1. o f 2. o. . . TARGET= a. out TARGET: $(OBJS) $(F 90) $(LDFLAGS) $(OBJS) -o $@ $(LIBS). c. o: $(CC) $(CFLAGS) -c $< -o $@ The TAU Performance System 58 NAVO, Mar. 24 -25, 2004
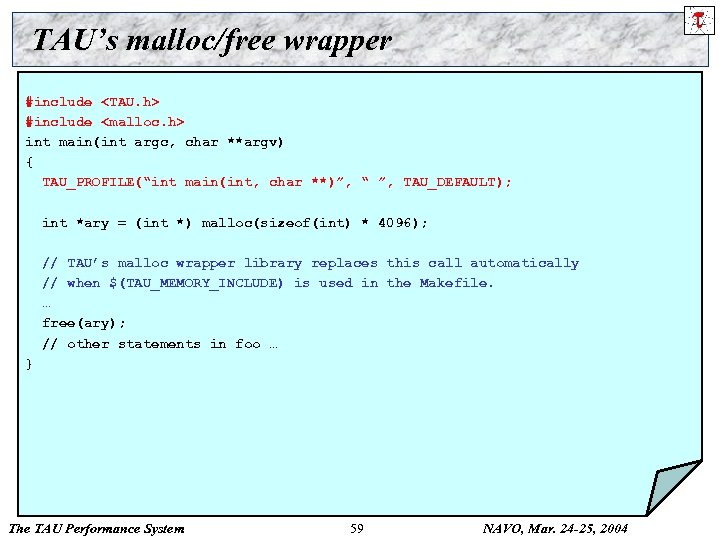 TAU’s malloc/free wrapper #include
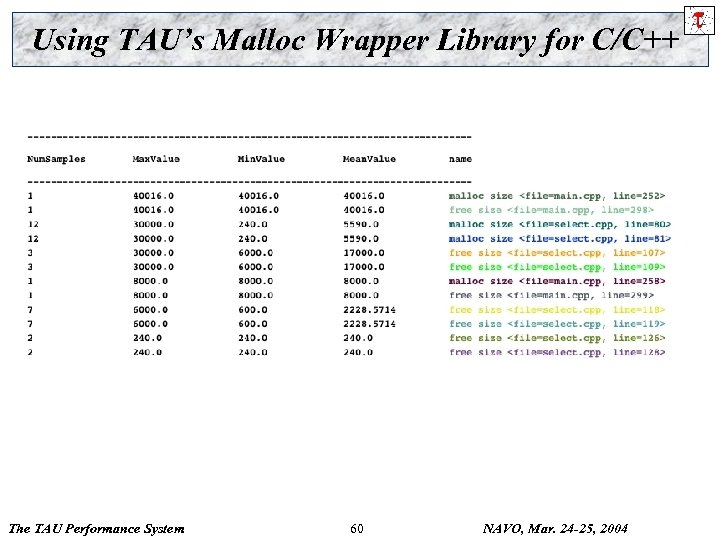 Using TAU’s Malloc Wrapper Library for C/C++ The TAU Performance System 60 NAVO, Mar. 24 -25, 2004
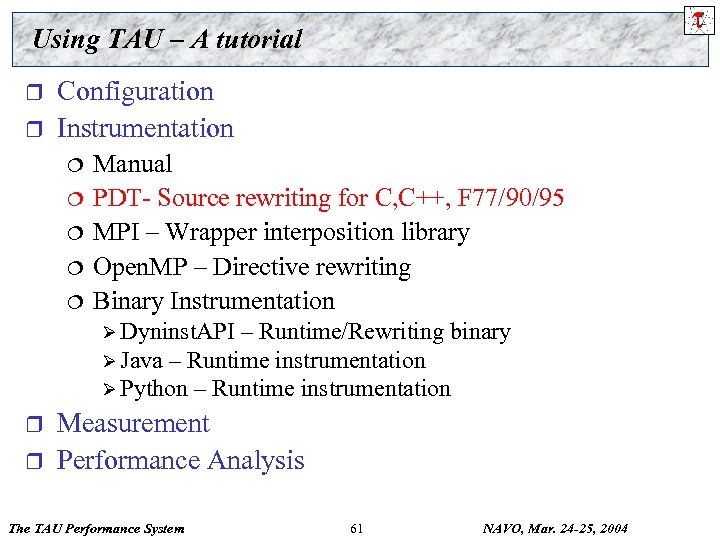 Using TAU – A tutorial r r Configuration Instrumentation ¦ ¦ ¦ Manual PDT- Source rewriting for C, C++, F 77/90/95 MPI – Wrapper interposition library Open. MP – Directive rewriting Binary Instrumentation Ø Dyninst. API – Runtime/Rewriting binary Ø Java – Runtime instrumentation Ø Python – Runtime instrumentation r r Measurement Performance Analysis The TAU Performance System 61 NAVO, Mar. 24 -25, 2004
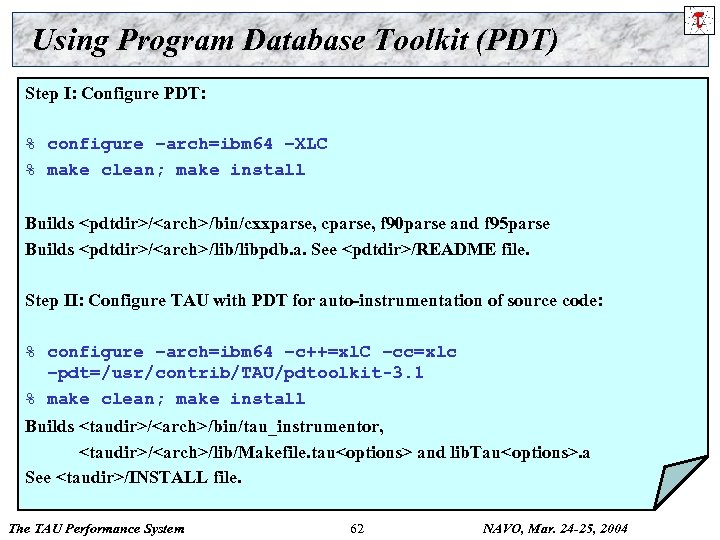 Using Program Database Toolkit (PDT) Step I: Configure PDT: % configure –arch=ibm 64 –XLC % make clean; make install Builds
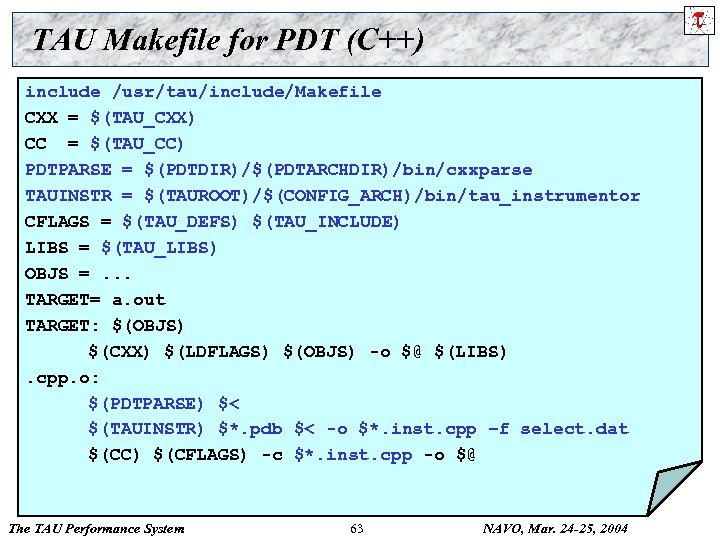 TAU Makefile for PDT (C++) include /usr/tau/include/Makefile CXX = $(TAU_CXX) CC = $(TAU_CC) PDTPARSE = $(PDTDIR)/$(PDTARCHDIR)/bin/cxxparse TAUINSTR = $(TAUROOT)/$(CONFIG_ARCH)/bin/tau_instrumentor CFLAGS = $(TAU_DEFS) $(TAU_INCLUDE) LIBS = $(TAU_LIBS) OBJS =. . . TARGET= a. out TARGET: $(OBJS) $(CXX) $(LDFLAGS) $(OBJS) -o $@ $(LIBS). cpp. o: $(PDTPARSE) $< $(TAUINSTR) $*. pdb $< -o $*. inst. cpp –f select. dat $(CC) $(CFLAGS) -c $*. inst. cpp -o $@ The TAU Performance System 63 NAVO, Mar. 24 -25, 2004
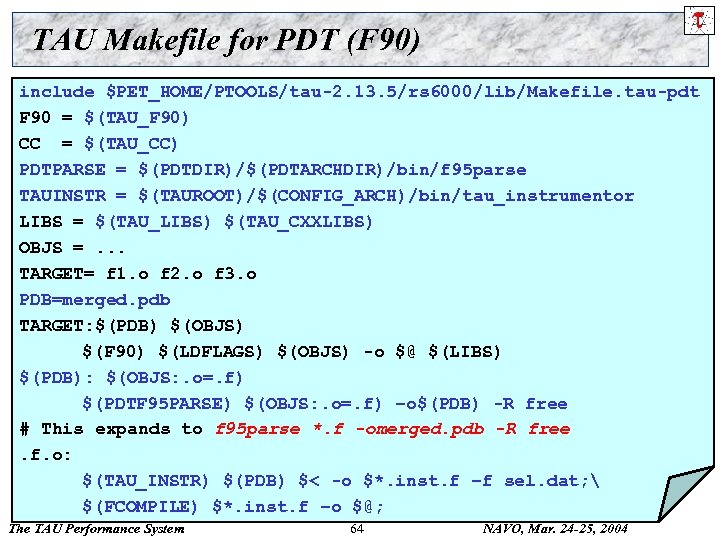 TAU Makefile for PDT (F 90) include $PET_HOME/PTOOLS/tau-2. 13. 5/rs 6000/lib/Makefile. tau-pdt F 90 = $(TAU_F 90) CC = $(TAU_CC) PDTPARSE = $(PDTDIR)/$(PDTARCHDIR)/bin/f 95 parse TAUINSTR = $(TAUROOT)/$(CONFIG_ARCH)/bin/tau_instrumentor LIBS = $(TAU_LIBS) $(TAU_CXXLIBS) OBJS =. . . TARGET= f 1. o f 2. o f 3. o PDB=merged. pdb TARGET: $(PDB) $(OBJS) $(F 90) $(LDFLAGS) $(OBJS) -o $@ $(LIBS) $(PDB): $(OBJS: . o=. f) $(PDTF 95 PARSE) $(OBJS: . o=. f) –o$(PDB) -R free # This expands to f 95 parse *. f -omerged. pdb -R free. f. o: $(TAU_INSTR) $(PDB) $< -o $*. inst. f –f sel. dat; $(FCOMPILE) $*. inst. f –o $@; The TAU Performance System 64 NAVO, Mar. 24 -25, 2004
![Using PDT: tau_instrumentor % tau_instrumentor Usage : tau_instrumentor <pdbfile> <sourcefile> [-o <outputfile>] [-noinline] [ Using PDT: tau_instrumentor % tau_instrumentor Usage : tau_instrumentor <pdbfile> <sourcefile> [-o <outputfile>] [-noinline] [](https://present5.com/presentation/e7720d508af828289efce30a37c02f7f/image-65.jpg) Using PDT: tau_instrumentor % tau_instrumentor Usage : tau_instrumentor
Using PDT: tau_instrumentor % tau_instrumentor Usage : tau_instrumentor
 Using TAU – A tutorial r r Configuration Instrumentation ¦ ¦ ¦ Manual PDT- Source rewriting for C, C++, F 77/90/95 MPI – Wrapper interposition library Open. MP – Directive rewriting Binary Instrumentation Ø Dyninst. API – Runtime/Rewriting binary Ø Java – Runtime instrumentation Ø Python – Runtime instrumentation r r Measurement Performance Analysis The TAU Performance System 66 NAVO, Mar. 24 -25, 2004
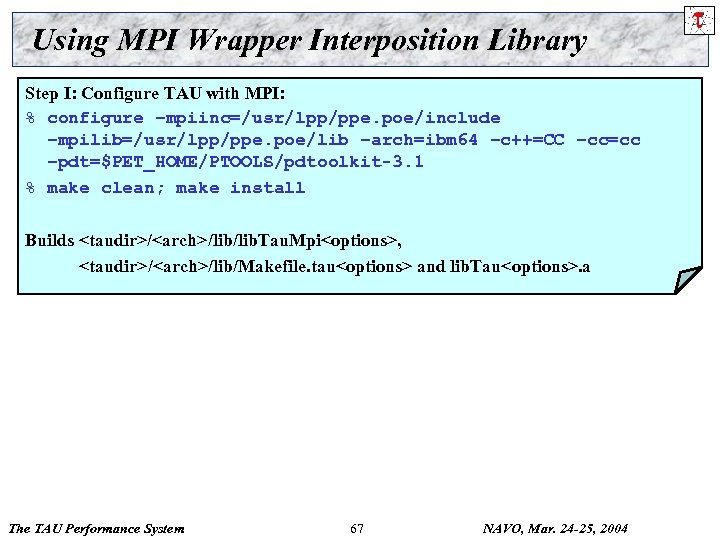 Using MPI Wrapper Interposition Library Step I: Configure TAU with MPI: % configure –mpiinc=/usr/lpp/ppe. poe/include –mpilib=/usr/lpp/ppe. poe/lib –arch=ibm 64 –c++=CC –cc=cc –pdt=$PET_HOME/PTOOLS/pdtoolkit-3. 1 % make clean; make install Builds
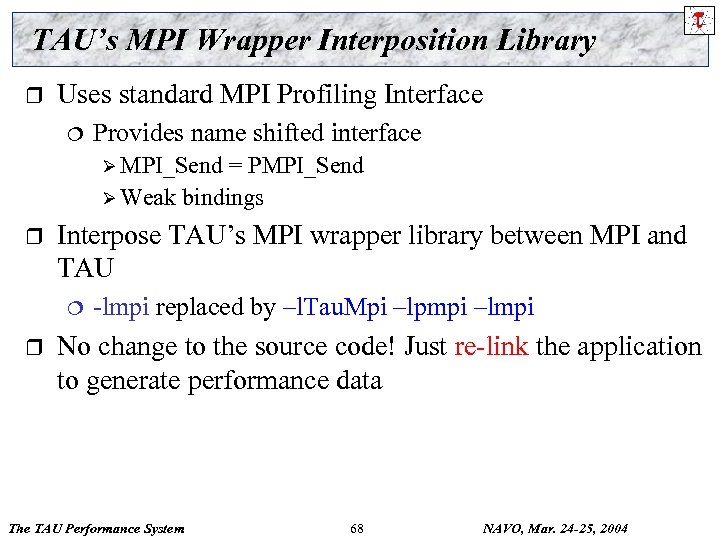 TAU’s MPI Wrapper Interposition Library r Uses standard MPI Profiling Interface ¦ Provides name shifted interface Ø MPI_Send = PMPI_Send Ø Weak bindings r Interpose TAU’s MPI wrapper library between MPI and TAU ¦ r -lmpi replaced by –l. Tau. Mpi –lpmpi –lmpi No change to the source code! Just re-link the application to generate performance data The TAU Performance System 68 NAVO, Mar. 24 -25, 2004
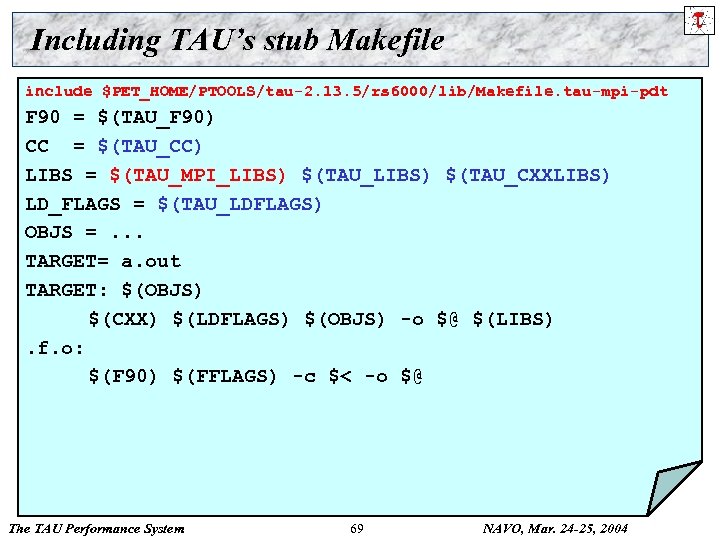 Including TAU’s stub Makefile include $PET_HOME/PTOOLS/tau-2. 13. 5/rs 6000/lib/Makefile. tau-mpi-pdt F 90 = $(TAU_F 90) CC = $(TAU_CC) LIBS = $(TAU_MPI_LIBS) $(TAU_CXXLIBS) LD_FLAGS = $(TAU_LDFLAGS) OBJS =. . . TARGET= a. out TARGET: $(OBJS) $(CXX) $(LDFLAGS) $(OBJS) -o $@ $(LIBS). f. o: $(F 90) $(FFLAGS) -c $< -o $@ The TAU Performance System 69 NAVO, Mar. 24 -25, 2004
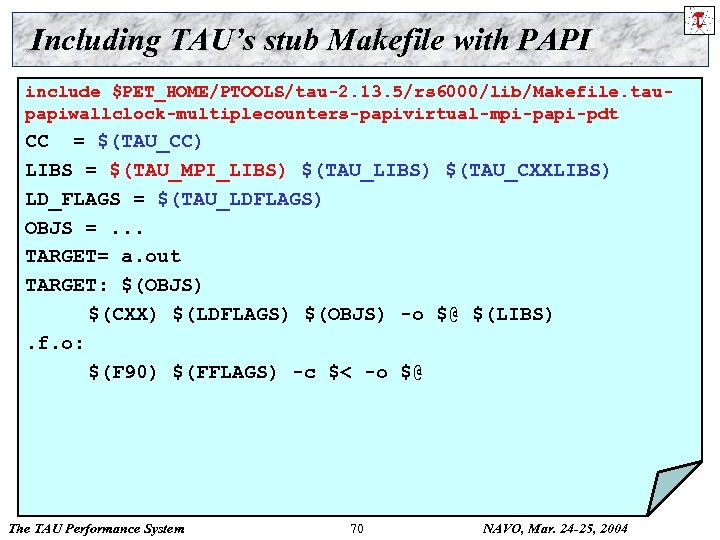 Including TAU’s stub Makefile with PAPI include $PET_HOME/PTOOLS/tau-2. 13. 5/rs 6000/lib/Makefile. taupapiwallclock-multiplecounters-papivirtual-mpi-papi-pdt CC = $(TAU_CC) LIBS = $(TAU_MPI_LIBS) $(TAU_CXXLIBS) LD_FLAGS = $(TAU_LDFLAGS) OBJS =. . . TARGET= a. out TARGET: $(OBJS) $(CXX) $(LDFLAGS) $(OBJS) -o $@ $(LIBS). f. o: $(F 90) $(FFLAGS) -c $< -o $@ The TAU Performance System 70 NAVO, Mar. 24 -25, 2004
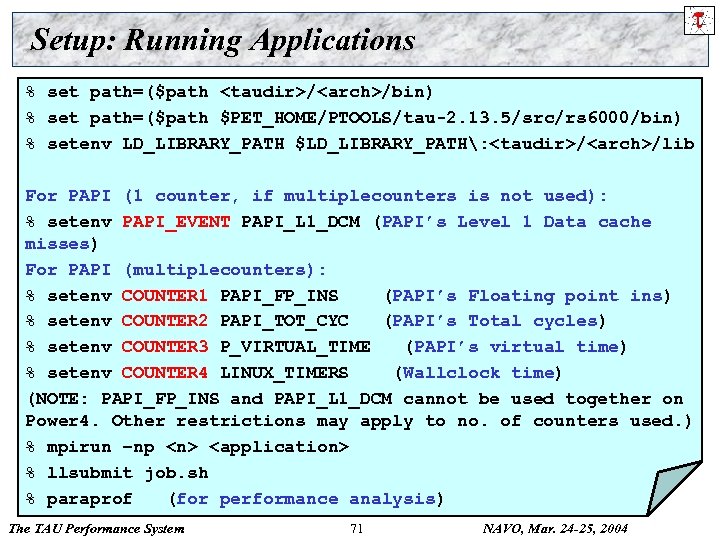 Setup: Running Applications % set path=($path
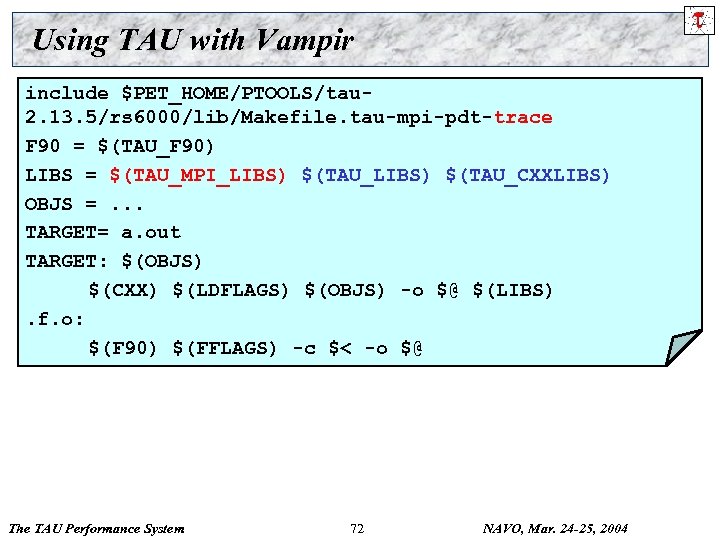 Using TAU with Vampir include $PET_HOME/PTOOLS/tau 2. 13. 5/rs 6000/lib/Makefile. tau-mpi-pdt-trace F 90 = $(TAU_F 90) LIBS = $(TAU_MPI_LIBS) $(TAU_CXXLIBS) OBJS =. . . TARGET= a. out TARGET: $(OBJS) $(CXX) $(LDFLAGS) $(OBJS) -o $@ $(LIBS). f. o: $(F 90) $(FFLAGS) -c $< -o $@ The TAU Performance System 72 NAVO, Mar. 24 -25, 2004
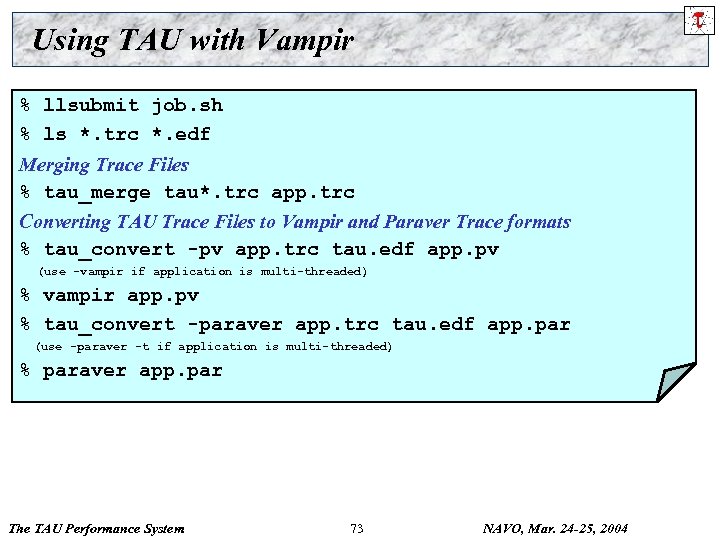 Using TAU with Vampir % llsubmit job. sh % ls *. trc *. edf Merging Trace Files % tau_merge tau*. trc app. trc Converting TAU Trace Files to Vampir and Paraver Trace formats % tau_convert -pv app. trc tau. edf app. pv (use -vampir if application is multi-threaded) % vampir app. pv % tau_convert -paraver app. trc tau. edf app. par (use -paraver -t if application is multi-threaded) % paraver app. par The TAU Performance System 73 NAVO, Mar. 24 -25, 2004
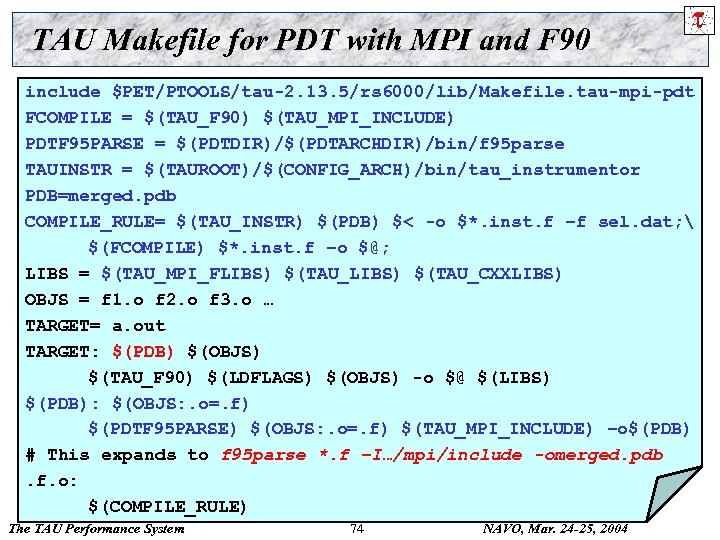 TAU Makefile for PDT with MPI and F 90 include $PET/PTOOLS/tau-2. 13. 5/rs 6000/lib/Makefile. tau-mpi-pdt FCOMPILE = $(TAU_F 90) $(TAU_MPI_INCLUDE) PDTF 95 PARSE = $(PDTDIR)/$(PDTARCHDIR)/bin/f 95 parse TAUINSTR = $(TAUROOT)/$(CONFIG_ARCH)/bin/tau_instrumentor PDB=merged. pdb COMPILE_RULE= $(TAU_INSTR) $(PDB) $< -o $*. inst. f –f sel. dat; $(FCOMPILE) $*. inst. f –o $@; LIBS = $(TAU_MPI_FLIBS) $(TAU_CXXLIBS) OBJS = f 1. o f 2. o f 3. o … TARGET= a. out TARGET: $(PDB) $(OBJS) $(TAU_F 90) $(LDFLAGS) $(OBJS) -o $@ $(LIBS) $(PDB): $(OBJS: . o=. f) $(PDTF 95 PARSE) $(OBJS: . o=. f) $(TAU_MPI_INCLUDE) –o$(PDB) # This expands to f 95 parse *. f –I…/mpi/include -omerged. pdb. f. o: $(COMPILE_RULE) The TAU Performance System 74 NAVO, Mar. 24 -25, 2004
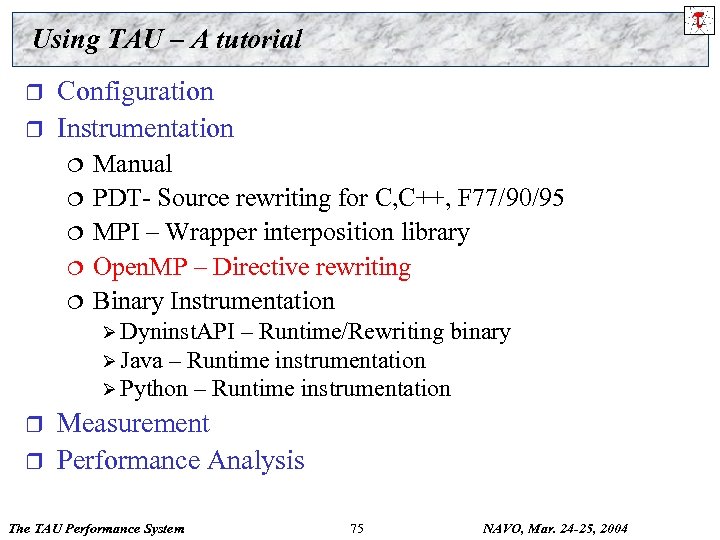 Using TAU – A tutorial r r Configuration Instrumentation ¦ ¦ ¦ Manual PDT- Source rewriting for C, C++, F 77/90/95 MPI – Wrapper interposition library Open. MP – Directive rewriting Binary Instrumentation Ø Dyninst. API – Runtime/Rewriting binary Ø Java – Runtime instrumentation Ø Python – Runtime instrumentation r r Measurement Performance Analysis The TAU Performance System 75 NAVO, Mar. 24 -25, 2004
![Using Opari with TAU Step I: Configure KOJAK/opari [Download from http: //www. fz-juelich. de/zam/kojak/] Using Opari with TAU Step I: Configure KOJAK/opari [Download from http: //www. fz-juelich. de/zam/kojak/]](https://present5.com/presentation/e7720d508af828289efce30a37c02f7f/image-76.jpg) Using Opari with TAU Step I: Configure KOJAK/opari [Download from http: //www. fz-juelich. de/zam/kojak/] % cd kojak-0. 99; cp mf/Makefile. defs. ibm Makefile. defs; edit Makefile % make Builds opari Step II: Configure TAU with Opari (used here with MPI and PDT) % configure –opari=/usr/contrib/TAU/kojak-0. 99/opari -mpiinc=/usr/lpp/ppe. poe/include –mpilib=/usr/lpp/ppe. poe/lib –pdt=/usr/contrib/TAU/pdtoolkit-3. 1 % make clean; make install The TAU Performance System 76 NAVO, Mar. 24 -25, 2004
Using Opari with TAU Step I: Configure KOJAK/opari [Download from http: //www. fz-juelich. de/zam/kojak/] % cd kojak-0. 99; cp mf/Makefile. defs. ibm Makefile. defs; edit Makefile % make Builds opari Step II: Configure TAU with Opari (used here with MPI and PDT) % configure –opari=/usr/contrib/TAU/kojak-0. 99/opari -mpiinc=/usr/lpp/ppe. poe/include –mpilib=/usr/lpp/ppe. poe/lib –pdt=/usr/contrib/TAU/pdtoolkit-3. 1 % make clean; make install The TAU Performance System 76 NAVO, Mar. 24 -25, 2004
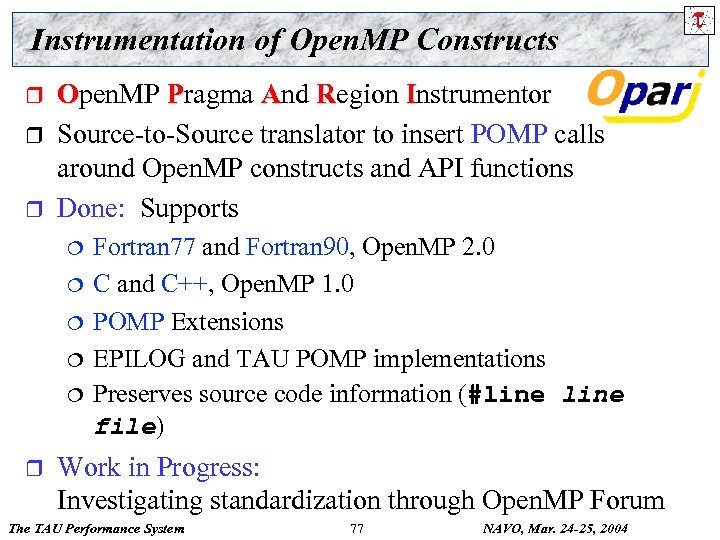 Instrumentation of Open. MP Constructs r r r Open. MP Pragma And Region Instrumentor Source-to-Source translator to insert POMP calls around Open. MP constructs and API functions Done: Supports ¦ ¦ ¦ r Fortran 77 and Fortran 90, Open. MP 2. 0 C and C++, Open. MP 1. 0 POMP Extensions EPILOG and TAU POMP implementations Preserves source code information (#line file) Work in Progress: Investigating standardization through Open. MP Forum The TAU Performance System 77 NAVO, Mar. 24 -25, 2004
 Open. MP API Instrumentation r Transform ¦ ¦ omp_#_lock() pomp_#_lock() omp_#_nest_lock() pomp_#_nest_lock() [ # = init | destroy | set | unset | test ] r POMP version ¦ ¦ Calls omp version internally Can do extra stuff before and after call The TAU Performance System 78 NAVO, Mar. 24 -25, 2004
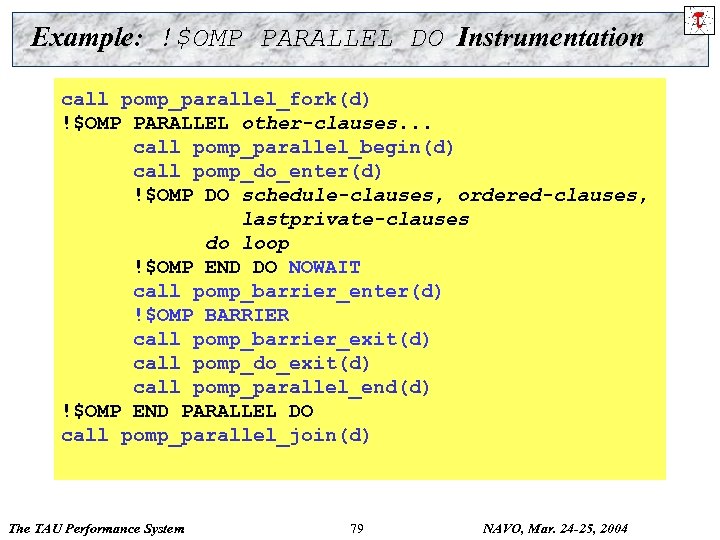 Example: !$OMP PARALLEL DO Instrumentation call pomp_parallel_fork(d) !$OMP PARALLEL other-clauses. . . !$OMP PARALLEL DO clauses. . . call pomp_parallel_begin(d) call pomp_do_enter(d) !$OMP DO schedule-clauses, ordered-clauses, lastprivate-clauses do loop NOWAIT !$OMP END DO call pomp_barrier_enter(d) !$OMP BARRIER call pomp_barrier_exit(d) call pomp_do_exit(d) call pomp_parallel_end(d) !$OMP END PARALLEL DO call pomp_parallel_join(d) The TAU Performance System 79 NAVO, Mar. 24 -25, 2004
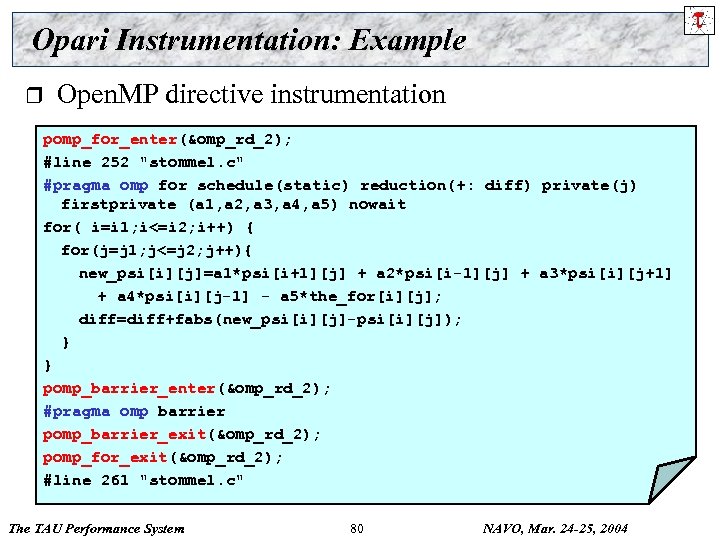 Opari Instrumentation: Example r Open. MP directive instrumentation pomp_for_enter(&omp_rd_2); #line 252 "stommel. c" #pragma omp for schedule(static) reduction(+: diff) private(j) firstprivate (a 1, a 2, a 3, a 4, a 5) nowait for( i=i 1; i<=i 2; i++) { for(j=j 1; j<=j 2; j++){ new_psi[i][j]=a 1*psi[i+1][j] + a 2*psi[i-1][j] + a 3*psi[i][j+1] + a 4*psi[i][j-1] - a 5*the_for[i][j]; diff=diff+fabs(new_psi[i][j]-psi[i][j]); } } pomp_barrier_enter(&omp_rd_2); #pragma omp barrier pomp_barrier_exit(&omp_rd_2); pomp_for_exit(&omp_rd_2); #line 261 "stommel. c" The TAU Performance System 80 NAVO, Mar. 24 -25, 2004
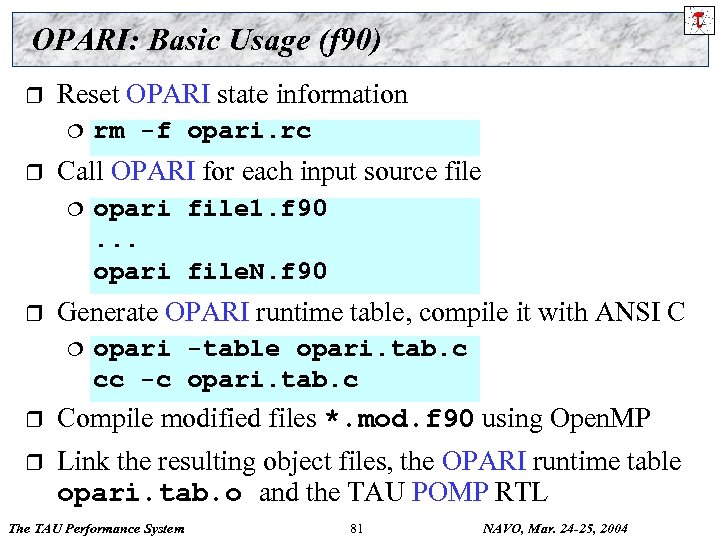 OPARI: Basic Usage (f 90) r Reset OPARI state information ¦ r Call OPARI for each input source file ¦ r rm -f opari. rc opari file 1. f 90. . . opari file. N. f 90 Generate OPARI runtime table, compile it with ANSI C ¦ opari -table opari. tab. c cc -c opari. tab. c r Compile modified files *. mod. f 90 using Open. MP r Link the resulting object files, the OPARI runtime table opari. tab. o and the TAU POMP RTL The TAU Performance System 81 NAVO, Mar. 24 -25, 2004
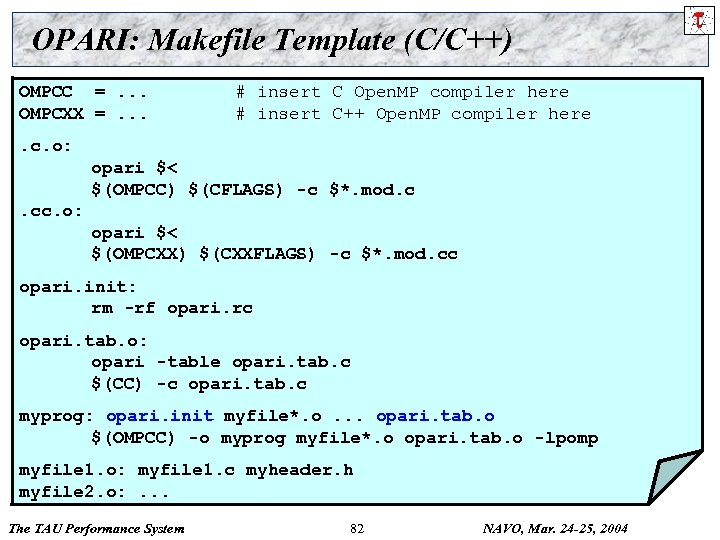 OPARI: Makefile Template (C/C++) OMPCC =. . . OMPCXX =. . . # insert C Open. MP compiler here # insert C++ Open. MP compiler here . c. o: opari $< $(OMPCC) $(CFLAGS) -c $*. mod. c. cc. o: opari $< $(OMPCXX) $(CXXFLAGS) -c $*. mod. cc opari. init: rm -rf opari. rc opari. tab. o: opari -table opari. tab. c $(CC) -c opari. tab. c myprog: opari. init myfile*. o. . . opari. tab. o $(OMPCC) -o myprog myfile*. o opari. tab. o -lpomp myfile 1. o: myfile 1. c myheader. h myfile 2. o: . . . The TAU Performance System 82 NAVO, Mar. 24 -25, 2004
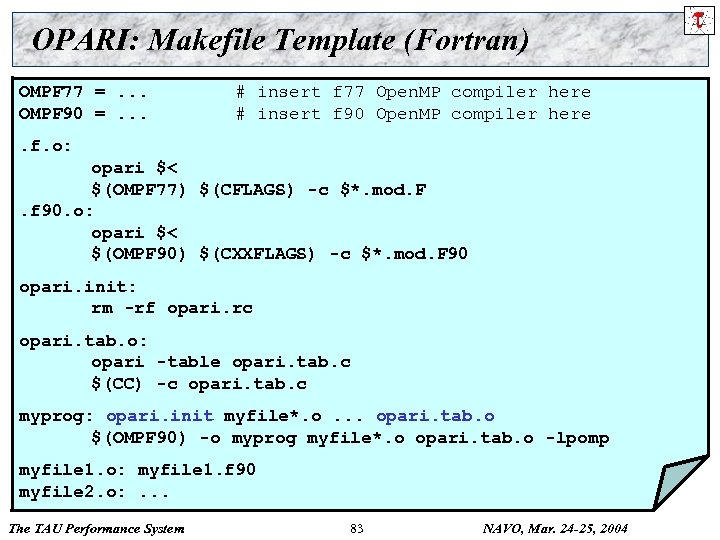 OPARI: Makefile Template (Fortran) OMPF 77 =. . . OMPF 90 =. . . # insert f 77 Open. MP compiler here # insert f 90 Open. MP compiler here . f. o: opari $< $(OMPF 77) $(CFLAGS) -c $*. mod. F. f 90. o: opari $< $(OMPF 90) $(CXXFLAGS) -c $*. mod. F 90 opari. init: rm -rf opari. rc opari. tab. o: opari -table opari. tab. c $(CC) -c opari. tab. c myprog: opari. init myfile*. o. . . opari. tab. o $(OMPF 90) -o myprog myfile*. o opari. tab. o -lpomp myfile 1. o: myfile 1. f 90 myfile 2. o: . . . The TAU Performance System 83 NAVO, Mar. 24 -25, 2004
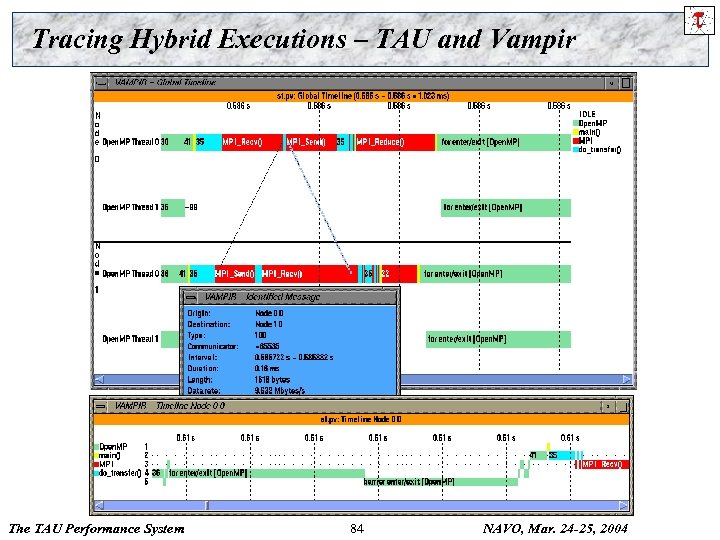 Tracing Hybrid Executions – TAU and Vampir The TAU Performance System 84 NAVO, Mar. 24 -25, 2004
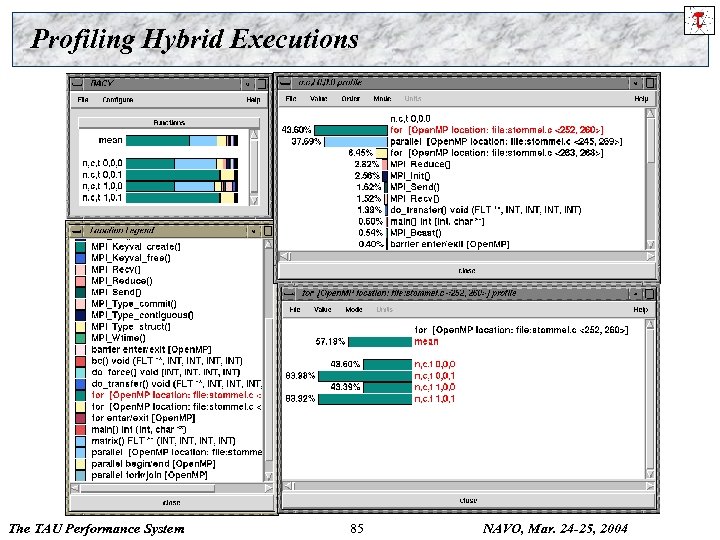 Profiling Hybrid Executions The TAU Performance System 85 NAVO, Mar. 24 -25, 2004
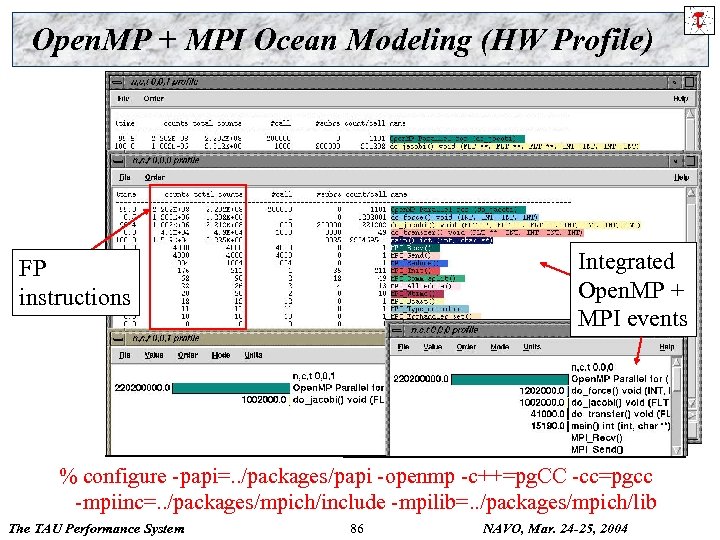 Open. MP + MPI Ocean Modeling (HW Profile) Integrated Open. MP + MPI events FP instructions % configure -papi=. . /packages/papi -openmp -c++=pg. CC -cc=pgcc -mpiinc=. . /packages/mpich/include -mpilib=. . /packages/mpich/lib The TAU Performance System 86 NAVO, Mar. 24 -25, 2004
 Using TAU – A tutorial r r Configuration Instrumentation ¦ ¦ ¦ Manual PDT- Source rewriting for C, C++, F 77/90/95 MPI – Wrapper interposition library Open. MP – Directive rewriting Binary Instrumentation Ø Dyninst. API – Runtime/Rewriting binary Ø Java – Runtime instrumentation Ø Python – Runtime instrumentation r r Measurement Performance Analysis The TAU Performance System 87 NAVO, Mar. 24 -25, 2004
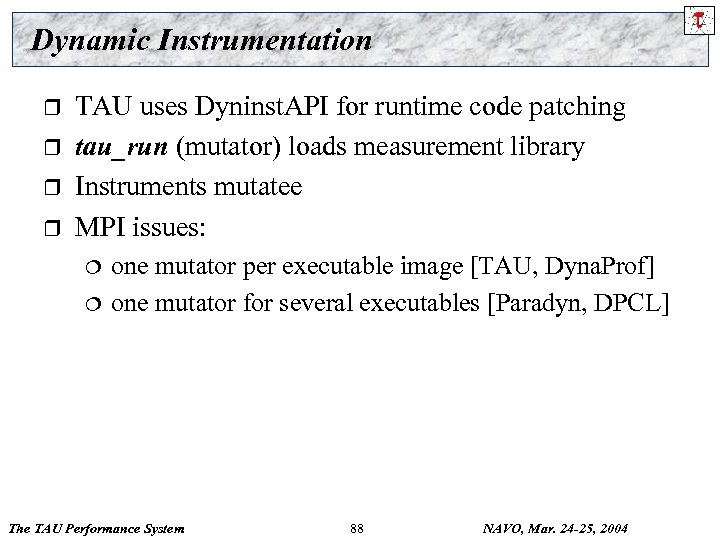 Dynamic Instrumentation r r TAU uses Dyninst. API for runtime code patching tau_run (mutator) loads measurement library Instruments mutatee MPI issues: ¦ ¦ one mutator per executable image [TAU, Dyna. Prof] one mutator for several executables [Paradyn, DPCL] The TAU Performance System 88 NAVO, Mar. 24 -25, 2004
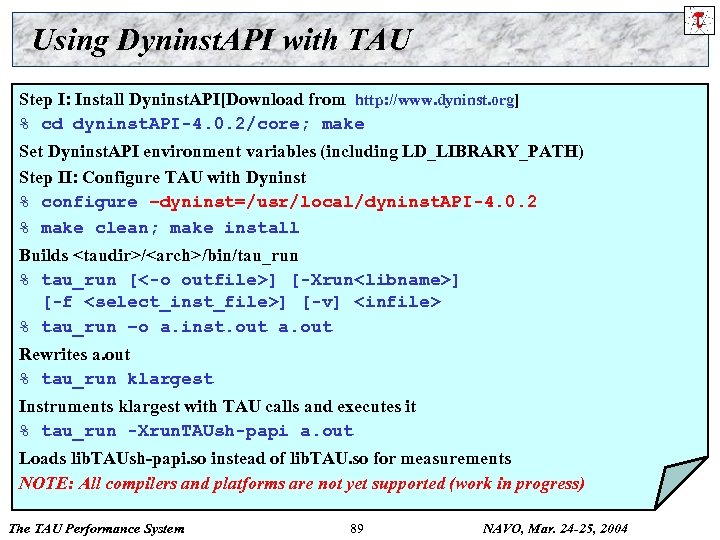 Using Dyninst. API with TAU Step I: Install Dyninst. API[Download from http: //www. dyninst. org] % cd dyninst. API-4. 0. 2/core; make Set Dyninst. API environment variables (including LD_LIBRARY_PATH) Step II: Configure TAU with Dyninst % configure –dyninst=/usr/local/dyninst. API-4. 0. 2 % make clean; make install Builds
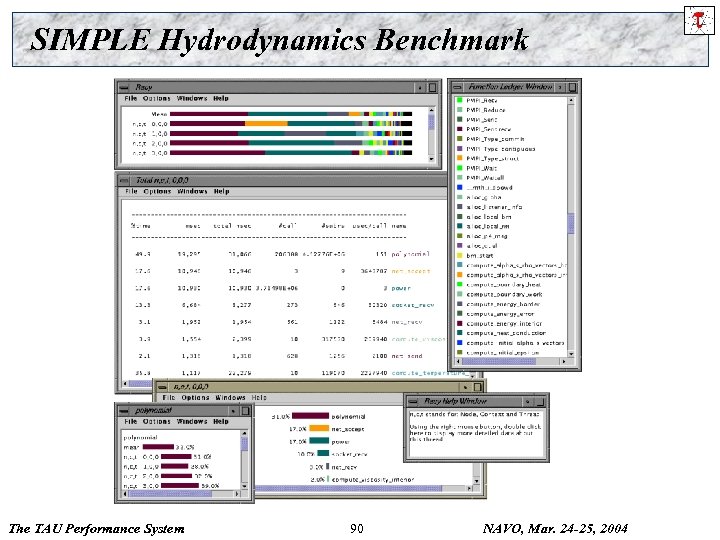 SIMPLE Hydrodynamics Benchmark The TAU Performance System 90 NAVO, Mar. 24 -25, 2004
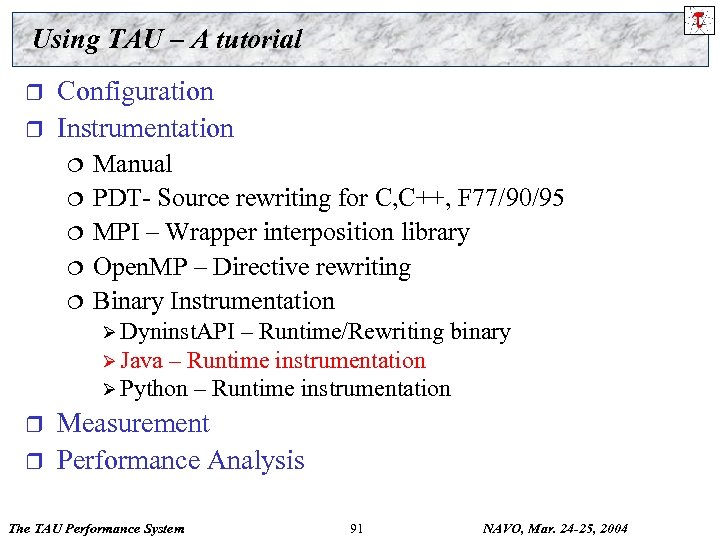 Using TAU – A tutorial r r Configuration Instrumentation ¦ ¦ ¦ Manual PDT- Source rewriting for C, C++, F 77/90/95 MPI – Wrapper interposition library Open. MP – Directive rewriting Binary Instrumentation Ø Dyninst. API – Runtime/Rewriting binary Ø Java – Runtime instrumentation Ø Python – Runtime instrumentation r r Measurement Performance Analysis The TAU Performance System 91 NAVO, Mar. 24 -25, 2004
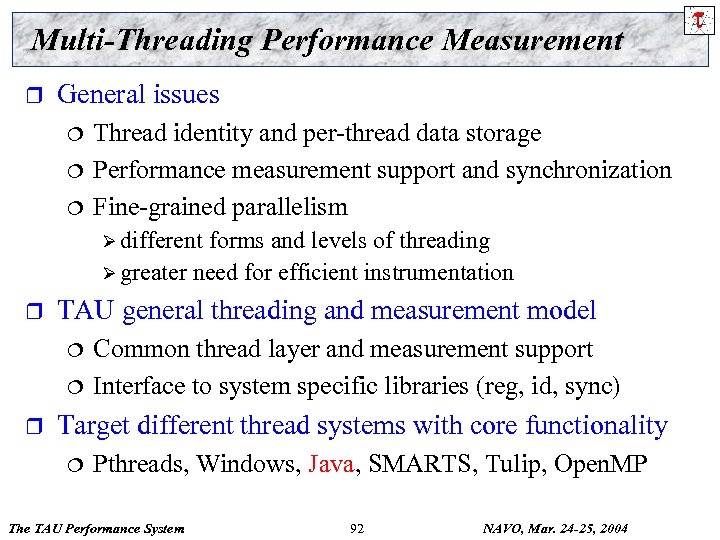 Multi-Threading Performance Measurement r General issues ¦ ¦ ¦ Thread identity and per-thread data storage Performance measurement support and synchronization Fine-grained parallelism Ø different forms and levels of threading Ø greater need for efficient instrumentation r TAU general threading and measurement model ¦ ¦ r Common thread layer and measurement support Interface to system specific libraries (reg, id, sync) Target different thread systems with core functionality ¦ Pthreads, Windows, Java, SMARTS, Tulip, Open. MP The TAU Performance System 92 NAVO, Mar. 24 -25, 2004
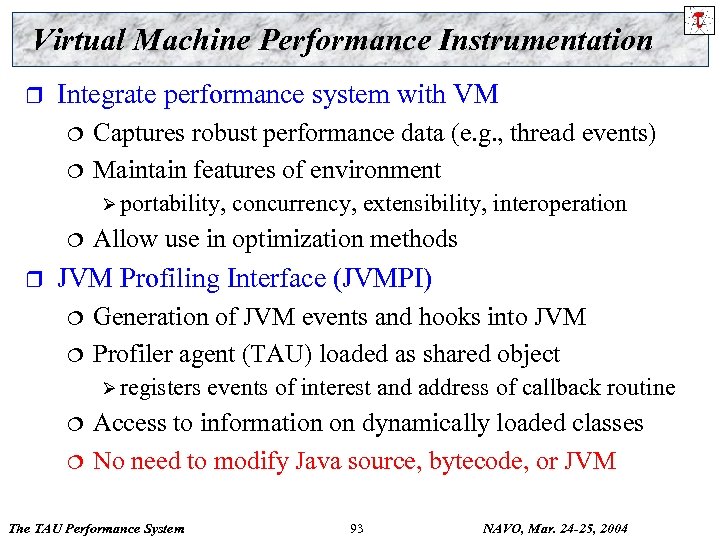 Virtual Machine Performance Instrumentation r Integrate performance system with VM ¦ ¦ Captures robust performance data (e. g. , thread events) Maintain features of environment Ø portability, ¦ r concurrency, extensibility, interoperation Allow use in optimization methods JVM Profiling Interface (JVMPI) ¦ ¦ Generation of JVM events and hooks into JVM Profiler agent (TAU) loaded as shared object Ø registers ¦ ¦ events of interest and address of callback routine Access to information on dynamically loaded classes No need to modify Java source, bytecode, or JVM The TAU Performance System 93 NAVO, Mar. 24 -25, 2004
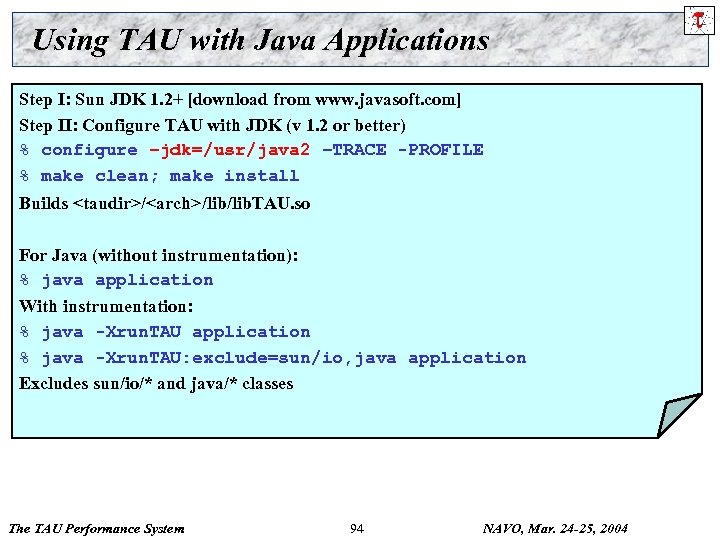 Using TAU with Java Applications Step I: Sun JDK 1. 2+ [download from www. javasoft. com] Step II: Configure TAU with JDK (v 1. 2 or better) % configure –jdk=/usr/java 2 –TRACE -PROFILE % make clean; make install Builds
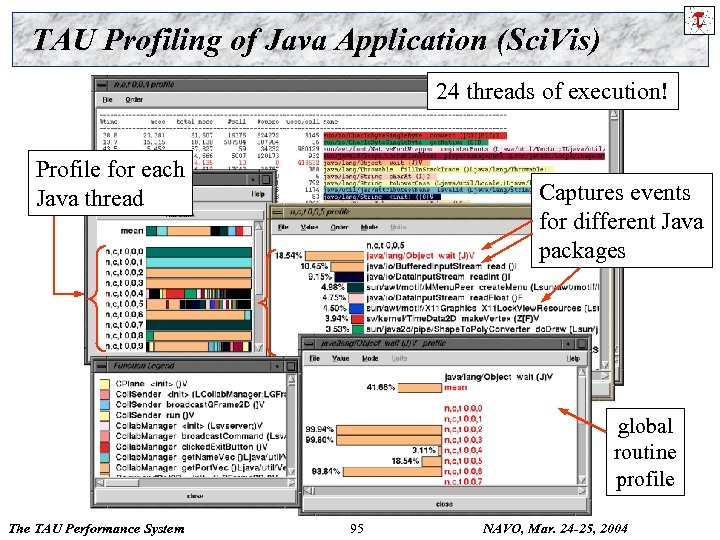 TAU Profiling of Java Application (Sci. Vis) 24 threads of execution! Profile for each Java thread Captures events for different Java packages global routine profile The TAU Performance System 95 NAVO, Mar. 24 -25, 2004
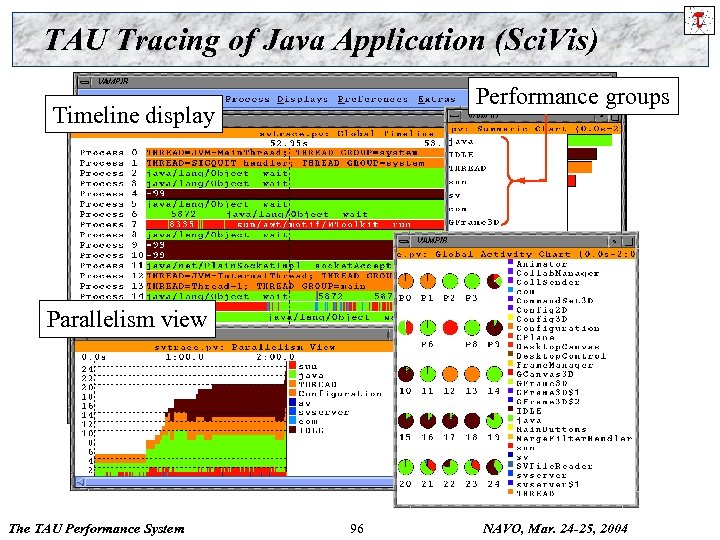 TAU Tracing of Java Application (Sci. Vis) Performance groups Timeline display Parallelism view The TAU Performance System 96 NAVO, Mar. 24 -25, 2004
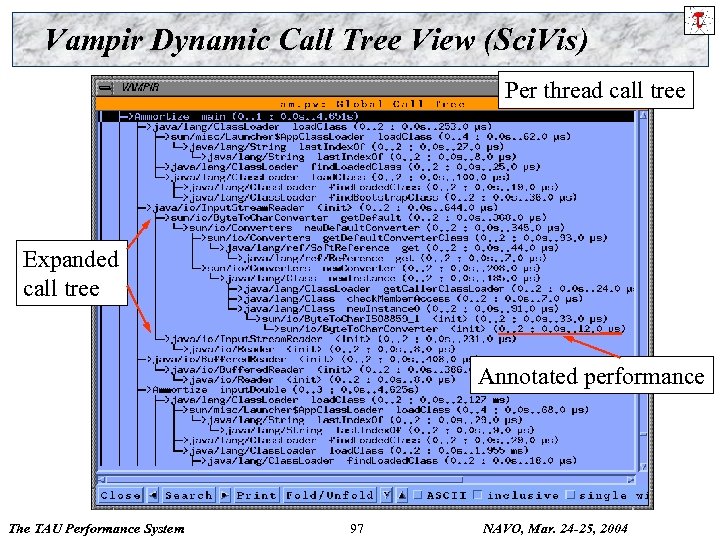 Vampir Dynamic Call Tree View (Sci. Vis) Per thread call tree Expanded call tree Annotated performance The TAU Performance System 97 NAVO, Mar. 24 -25, 2004
 Using TAU – A tutorial r r Configuration Instrumentation ¦ ¦ ¦ Manual PDT- Source rewriting for C, C++, F 77/90/95 MPI – Wrapper interposition library Open. MP – Directive rewriting Binary Instrumentation Ø Dyninst. API – Runtime/Rewriting binary Ø Java – Runtime instrumentation Ø Python – Runtime instrumentation r r Measurement Performance Analysis The TAU Performance System 98 NAVO, Mar. 24 -25, 2004
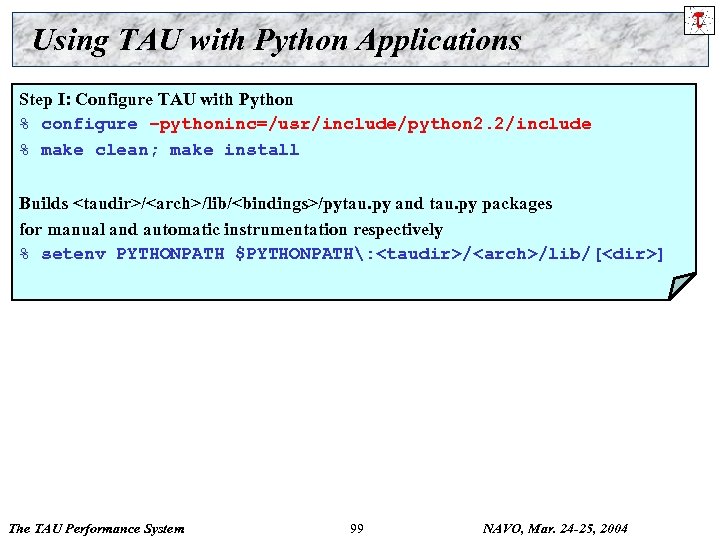 Using TAU with Python Applications Step I: Configure TAU with Python % configure –pythoninc=/usr/include/python 2. 2/include % make clean; make install Builds
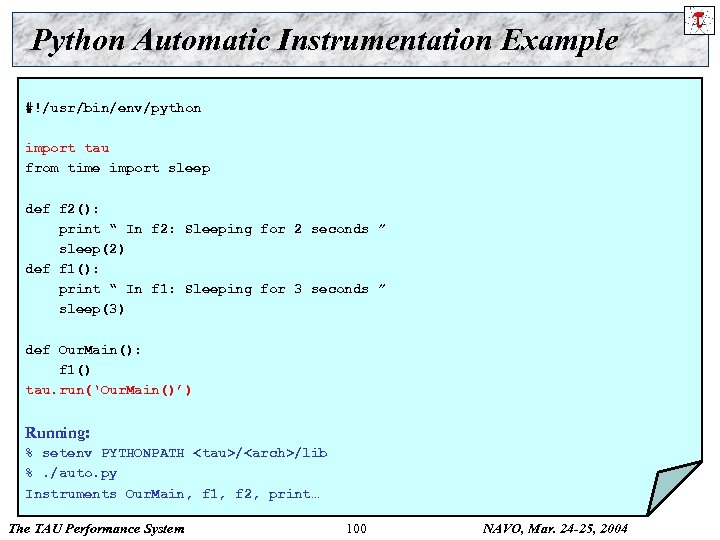 Python Automatic Instrumentation Example #!/usr/bin/env/python import tau from time import sleep def f 2(): print “ In f 2: Sleeping for 2 seconds ” sleep(2) def f 1(): print “ In f 1: Sleeping for 3 seconds ” sleep(3) def Our. Main(): f 1() tau. run(‘Our. Main()’) Running: % setenv PYTHONPATH
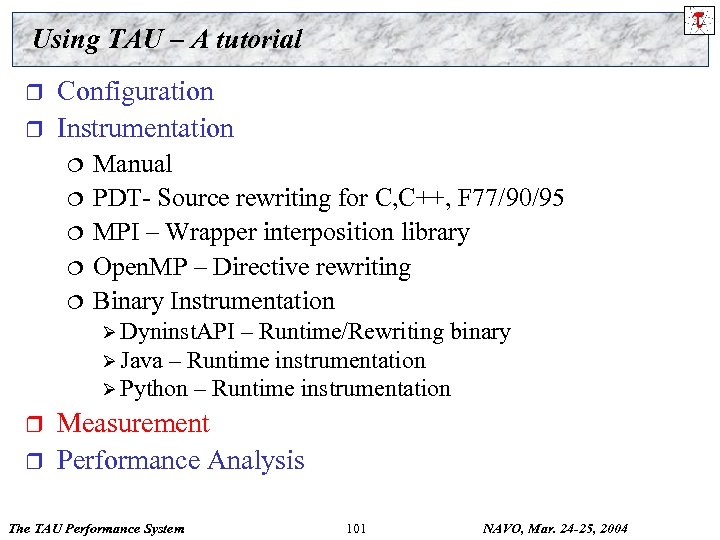 Using TAU – A tutorial r r Configuration Instrumentation ¦ ¦ ¦ Manual PDT- Source rewriting for C, C++, F 77/90/95 MPI – Wrapper interposition library Open. MP – Directive rewriting Binary Instrumentation Ø Dyninst. API – Runtime/Rewriting binary Ø Java – Runtime instrumentation Ø Python – Runtime instrumentation r r Measurement Performance Analysis The TAU Performance System 101 NAVO, Mar. 24 -25, 2004
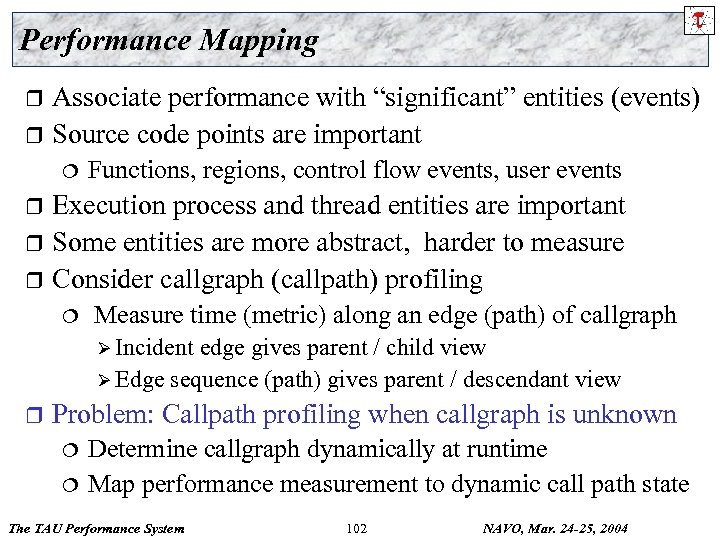 Performance Mapping Associate performance with “significant” entities (events) r Source code points are important r ¦ Functions, regions, control flow events, user events Execution process and thread entities are important r Some entities are more abstract, harder to measure r Consider callgraph (callpath) profiling r ¦ Measure time (metric) along an edge (path) of callgraph Ø Incident edge gives parent / child view Ø Edge sequence (path) gives parent / descendant view r Problem: Callpath profiling when callgraph is unknown Determine callgraph dynamically at runtime ¦ Map performance measurement to dynamic call path state ¦ The TAU Performance System 102 NAVO, Mar. 24 -25, 2004
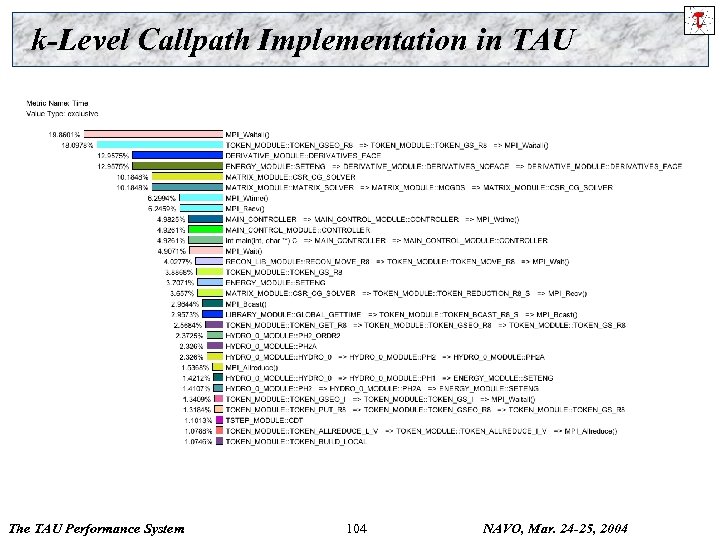
 k-Level Callpath Implementation in TAU r r TAU maintains a performance event (routine) callstack Profiled routine (child) looks in callstack for parent ¦ ¦ Previous profiled performance event is the parent A callpath profile structure created first time parent calls TAU records parent in a callgraph map for child String representing k-level callpath used as its key Ø r Map returns pointer to callpath profile structure ¦ ¦ r r r “a( )=>b( )=>c()” : name for time spent in “c” when called by “b” when “b” is called by “a” k-level callpath is profiled using this profiling data Set environment variable TAU_CALLPATH_DEPTH to depth Build upon TAU’s performance mapping technology Measurement is independent of instrumentation Use –PROFILECALLPATH to configure TAU The TAU Performance System 103 NAVO, Mar. 24 -25, 2004
 k-Level Callpath Implementation in TAU The TAU Performance System 104 NAVO, Mar. 24 -25, 2004
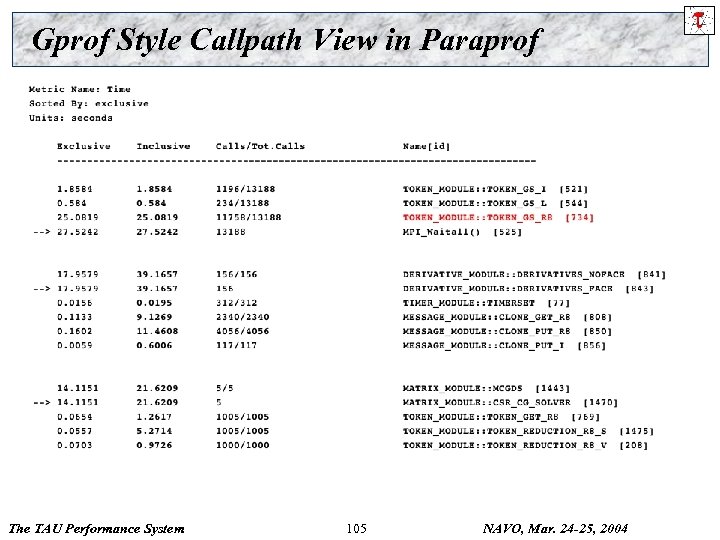 Gprof Style Callpath View in Paraprof The TAU Performance System 105 NAVO, Mar. 24 -25, 2004
 Compensation of Instrumentation Overhead r r r Runtime estimation of a single timer overhead Evaluation of number of timer calls along a calling path Compensation by subtracting timer overhead Recalculation of performance metrics to improve the accuracy of measurements Configure TAU with –COMPENSATE configuration option The TAU Performance System 106 NAVO, Mar. 24 -25, 2004
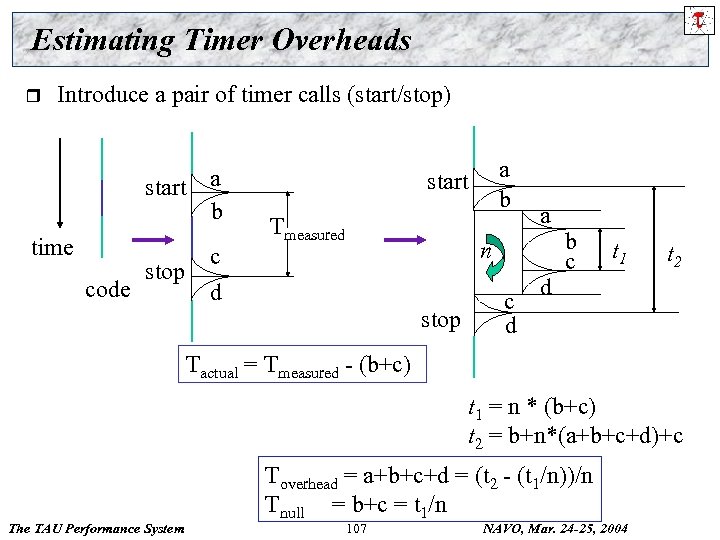 Estimating Timer Overheads r Introduce a pair of timer calls (start/stop) start a b time code stop c d a b start Tmeasured a n stop c d d b c t 1 t 2 Tactual = Tmeasured - (b+c) t 1 = n * (b+c) t 2 = b+n*(a+b+c+d)+c The TAU Performance System Toverhead = a+b+c+d = (t 2 - (t 1/n))/n Tnull = b+c = t 1/n 107 NAVO, Mar. 24 -25, 2004
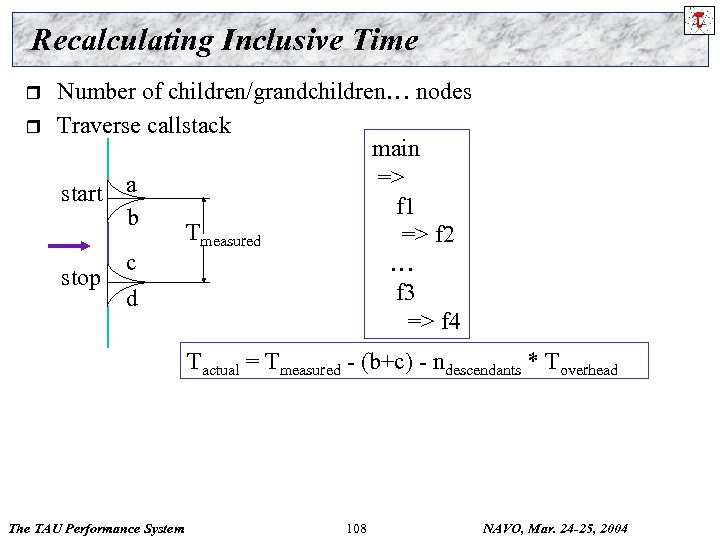 Recalculating Inclusive Time r r Number of children/grandchildren… nodes Traverse callstack main => a start f 1 b Tmeasured => f 2 c … stop f 3 d => f 4 Tactual = Tmeasured - (b+c) - ndescendants * Toverhead The TAU Performance System 108 NAVO, Mar. 24 -25, 2004
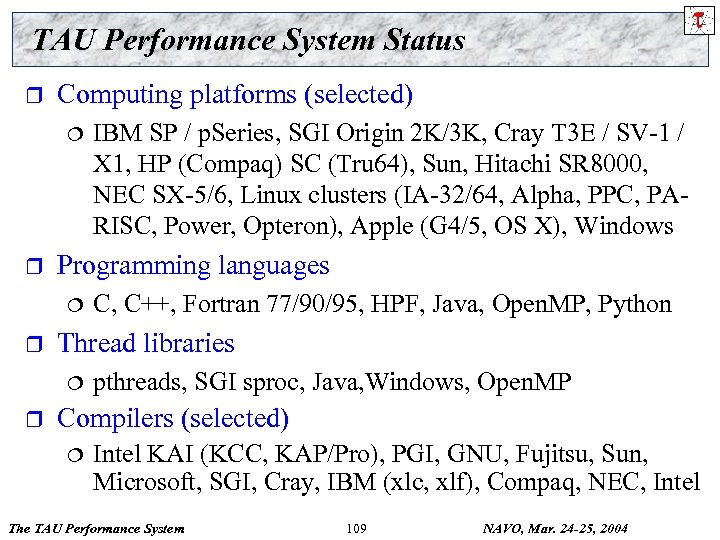 TAU Performance System Status r Computing platforms (selected) ¦ r Programming languages ¦ r C, C++, Fortran 77/90/95, HPF, Java, Open. MP, Python Thread libraries ¦ r IBM SP / p. Series, SGI Origin 2 K/3 K, Cray T 3 E / SV-1 / X 1, HP (Compaq) SC (Tru 64), Sun, Hitachi SR 8000, NEC SX-5/6, Linux clusters (IA-32/64, Alpha, PPC, PARISC, Power, Opteron), Apple (G 4/5, OS X), Windows pthreads, SGI sproc, Java, Windows, Open. MP Compilers (selected) ¦ Intel KAI (KCC, KAP/Pro), PGI, GNU, Fujitsu, Sun, Microsoft, SGI, Cray, IBM (xlc, xlf), Compaq, NEC, Intel The TAU Performance System 109 NAVO, Mar. 24 -25, 2004
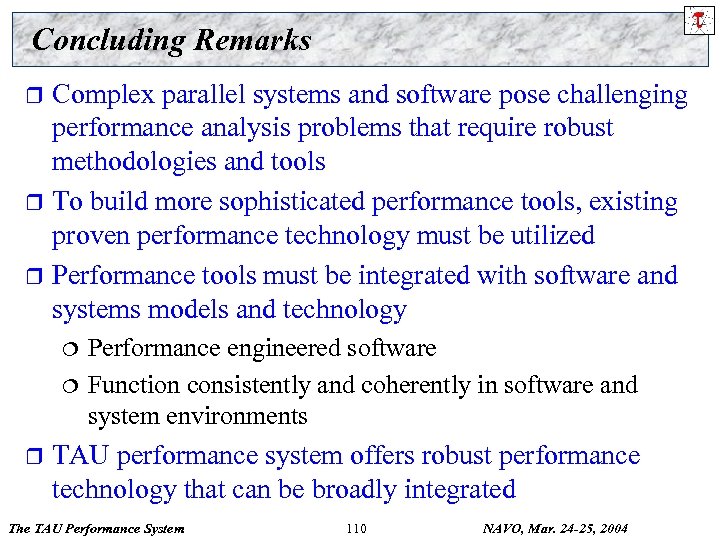 Concluding Remarks Complex parallel systems and software pose challenging performance analysis problems that require robust methodologies and tools r To build more sophisticated performance tools, existing proven performance technology must be utilized r Performance tools must be integrated with software and systems models and technology r Performance engineered software ¦ Function consistently and coherently in software and system environments ¦ r TAU performance system offers robust performance technology that can be broadly integrated The TAU Performance System 110 NAVO, Mar. 24 -25, 2004
 Support Acknowledgements r r Department of Energy (DOE) ¦ Office of Science contracts ¦ University of Utah DOE ASCI Level 1 sub-contract ¦ DOE ASCI Level 3 (LANL, LLNL) NSF National Young Investigator (NYI) award Research Centre Juelich ¦ John von Neumann Institute for Computing ¦ Dr. Bernd Mohr Los Alamos National Laboratory The TAU Performance System 111 NAVO, Mar. 24 -25, 2004


