fe307b1bc139263ed094db0c3dc9701c.ppt
- Количество слайдов: 30
 The TAU Performance System Sameer Shende, Allen D. Malony, Robert Bell University of Oregon
 Overview r Introduction ¦ r Tuning and Analysis Utilities (TAU) ¦ ¦ r Definitions, general problem Configuration Instrumentation Measurement Analysis Conclusions
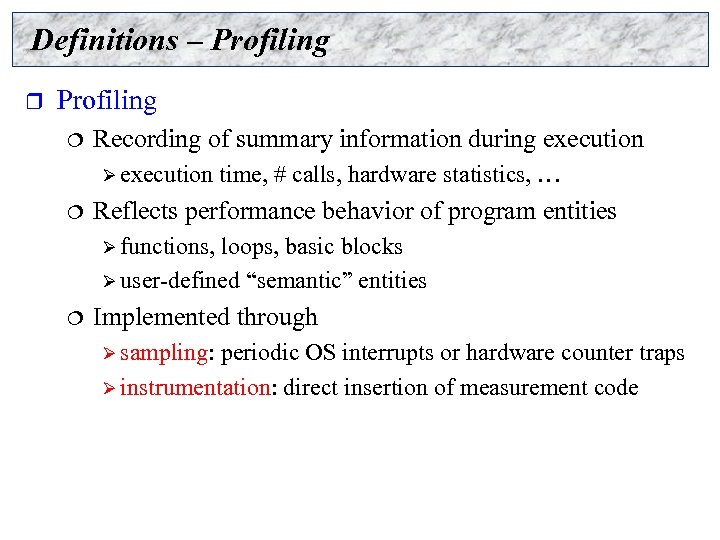 Definitions – Profiling r Profiling ¦ Recording of summary information during execution Ø execution ¦ time, # calls, hardware statistics, … Reflects performance behavior of program entities Ø functions, loops, basic blocks Ø user-defined “semantic” entities ¦ Implemented through Ø sampling: periodic OS interrupts or hardware counter traps Ø instrumentation: direct insertion of measurement code
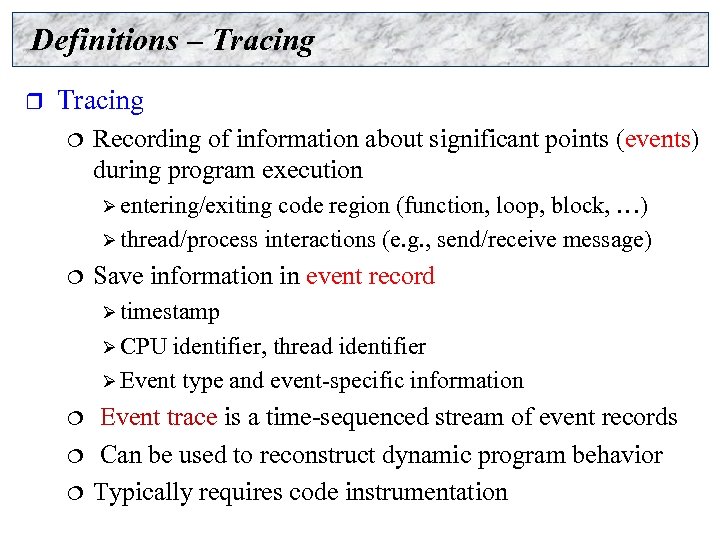 Definitions – Tracing r Tracing ¦ Recording of information about significant points (events) during program execution Ø entering/exiting code region (function, loop, block, …) Ø thread/process interactions (e. g. , send/receive message) ¦ Save information in event record Ø timestamp Ø CPU identifier, thread identifier Ø Event type and event-specific information ¦ ¦ ¦ Event trace is a time-sequenced stream of event records Can be used to reconstruct dynamic program behavior Typically requires code instrumentation
 TAU Performance System r r r Tuning and Analysis Utilities Performance system framework for scalable parallel and distributed highperformance computing Targets a general complex system computation model ¦ nodes / contexts / threads ¦ Multi-level: system / software / parallelism ¦ Measurement and analysis abstraction Integrated toolkit for performance instrumentation, measurement, analysis, and visualization ¦ Portable, configurable performance profiling/tracing facility ¦ Open software approach University of Oregon, LANL, FZJ Germany http: //www. cs. uoregon. edu/research/paracomp/tau
 Strategies for Empirical Performance Evaluation r Empirical performance evaluation as a series of performance experiments ¦ ¦ Experiment trials describing instrumentation and measurement requirements Where/When/How axes of empirical performance space Ø where are performance measurements made in program l routines, loops, statements… Ø when is performance instrumentation done l compile-time, while pre-processing, runtime… Ø how are performance measurement/instrumentation chosen l profiling with hw counters, tracing, callpath profiling…
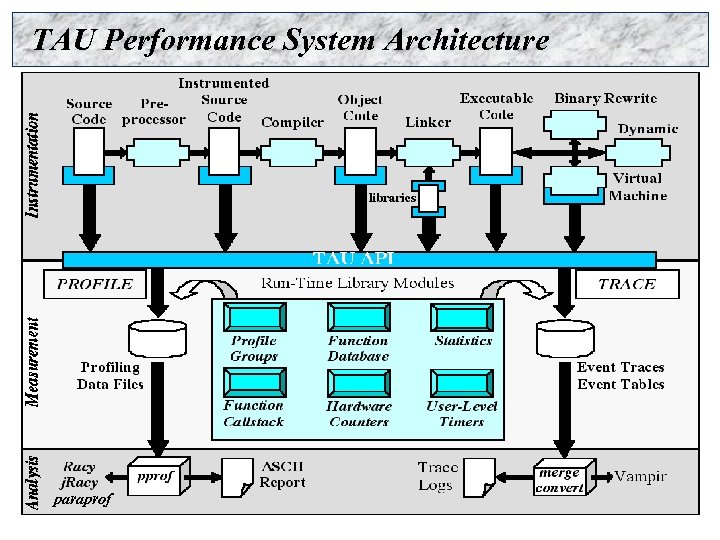 TAU Performance System Architecture paraprof
 TAU Instrumentation r Flexible instrumentation mechanisms at multiple levels ¦ Source code Ø manual Ø automatic ¦ using Program Database Toolkit (PDT), OPARI Object code Ø wrapper interposition library (e. g. , MPI using PMPI) Ø statically linked Ø dynamically linked (e. g. , Virtual machine instrumentation) Ø fast breakpoints (compiler generated) ¦ Executable code Ø dynamic instrumentation (pre-execution) using Dyn. Inst. API
 TAU Instrumentation (continued) r r Targets common measurement interface (TAU API) Object-based design and implementation (C++) ¦ ¦ ¦ r r Program units: function, classes, templates, blocks… Uniquely identify functions and templates C, Fortran, Java, Python, Component (CCA) instrumentation variants Shares information: cooperation between interfaces Taps information at multiple levels Provides grouping of events at each level Provides selective instrumentation at each level
 Program Database Toolkit (PDT) r r r Program code analysis framework for developing sourcebased tools High-level interface to source code information Integrated toolkit for source code parsing, database creation, and database query ¦ ¦ ¦ r r commercial grade front end parsers portable IL analyzer, database format, and access API open software approach for tool development Target and integrate multiple source languages Use in TAU to build automated performance instrumentation tools
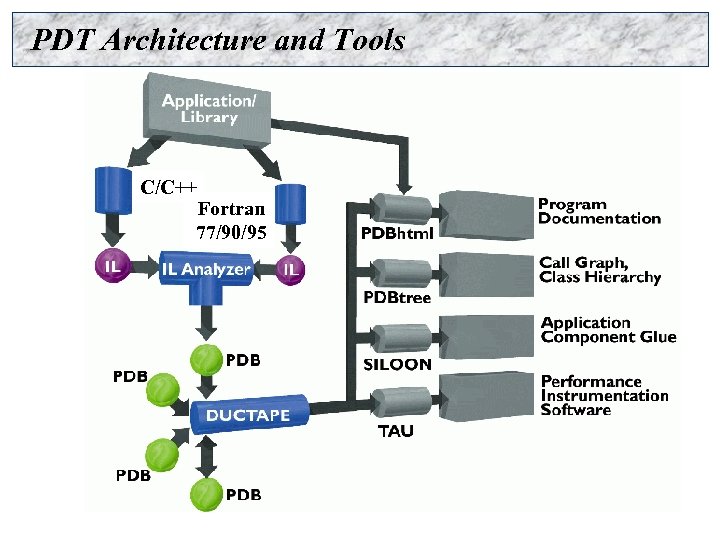 PDT Architecture and Tools C/C++ Fortran 77/90/95
 PDT Status r Program Database Toolkit (Version 3. 0, web download) ¦ ¦ ¦ r EDG C++ front end (Version 2. 45. 2) Mutek Fortran 90 front end (Version 2. 4. 1) Cleanscape Fortran Lint (Version 5. 00. 14) C++ and Fortran 90 IL Analyzer DUCTAPE library Standard C++ system header files (KCC Version 4. 0 f) PDT-constructed tools ¦ Automatic TAU performance instrumentation Ø ¦ ¦ r C, C++, Fortran 77, and Fortran 90 XMLGEN – PDB to XML translation tool Program analysis support for SILOON and CHASM Availability ¦ ¦ Binaries for IBM, Cray X 1, T 3 E, HP Tru 64, SGI, Sun, Windows, Hitachi, Linux, Mac OS X. http: //www. cs. uoregon. edu/research/paracomp/pdtoolkit
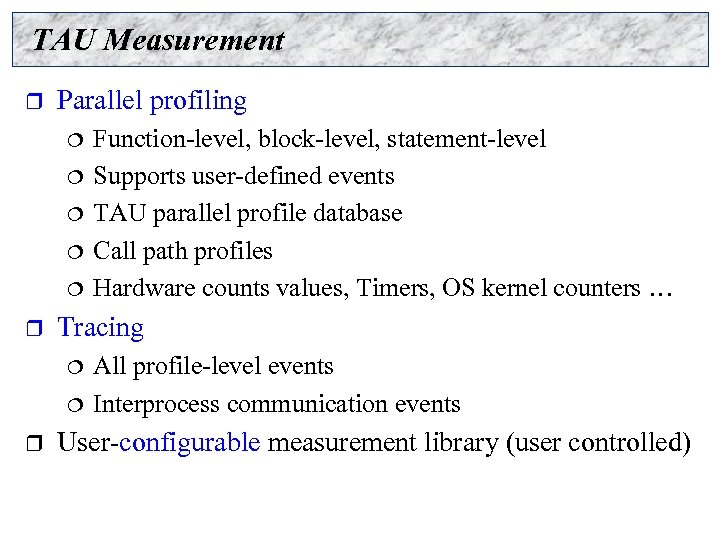 TAU Measurement r Parallel profiling ¦ ¦ ¦ r Tracing ¦ ¦ r Function-level, block-level, statement-level Supports user-defined events TAU parallel profile database Call path profiles Hardware counts values, Timers, OS kernel counters … All profile-level events Interprocess communication events User-configurable measurement library (user controlled)
![TAU Measurement System Configuration r configure [OPTIONS] ¦ ¦ ¦ {-c++=<CC>, -cc=<cc>} Specify C++ TAU Measurement System Configuration r configure [OPTIONS] ¦ ¦ ¦ {-c++=<CC>, -cc=<cc>} Specify C++](https://present5.com/presentation/fe307b1bc139263ed094db0c3dc9701c/image-14.jpg) TAU Measurement System Configuration r configure [OPTIONS] ¦ ¦ ¦ {-c++=
TAU Measurement System Configuration r configure [OPTIONS] ¦ ¦ ¦ {-c++=
![TAU Measurement System Configuration r configure [OPTIONS] ¦ ¦ ¦ ¦ ¦ -TRACE Generate TAU Measurement System Configuration r configure [OPTIONS] ¦ ¦ ¦ ¦ ¦ -TRACE Generate](https://present5.com/presentation/fe307b1bc139263ed094db0c3dc9701c/image-15.jpg) TAU Measurement System Configuration r configure [OPTIONS] ¦ ¦ ¦ ¦ ¦ -TRACE Generate binary TAU traces -PROFILE (default) Generate profiles (summary) -PROFILECALLPATH Generate call path profiles -PROFILESTATS Generate std. dev. statistics -MULTIPLECOUNTERS Use hardware counters + time -CPUTIME Use usertime+system time -PAPIWALLCLOCK Use PAPI’s wallclock time -PAPIVIRTUAL Use PAPI’s process virtual time -CRAYTIMERS Use fast Cray X 1 timers -LINUXTIMERS Use fast x 86 Linux timers
TAU Measurement System Configuration r configure [OPTIONS] ¦ ¦ ¦ ¦ ¦ -TRACE Generate binary TAU traces -PROFILE (default) Generate profiles (summary) -PROFILECALLPATH Generate call path profiles -PROFILESTATS Generate std. dev. statistics -MULTIPLECOUNTERS Use hardware counters + time -CPUTIME Use usertime+system time -PAPIWALLCLOCK Use PAPI’s wallclock time -PAPIVIRTUAL Use PAPI’s process virtual time -CRAYTIMERS Use fast Cray X 1 timers -LINUXTIMERS Use fast x 86 Linux timers
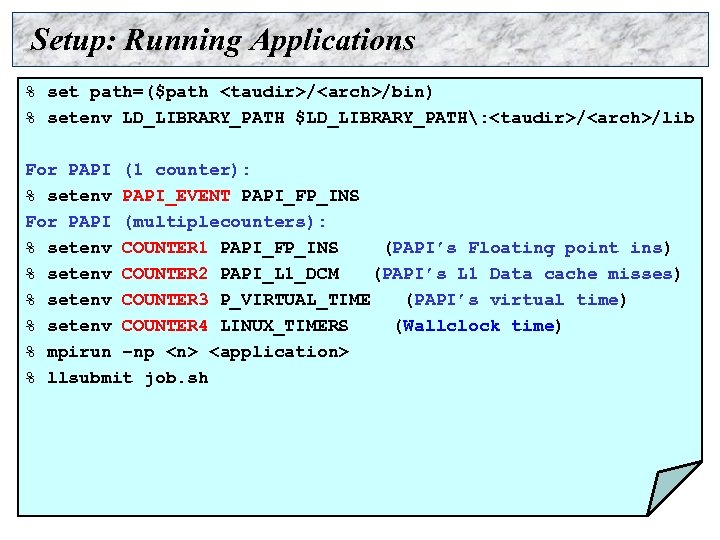
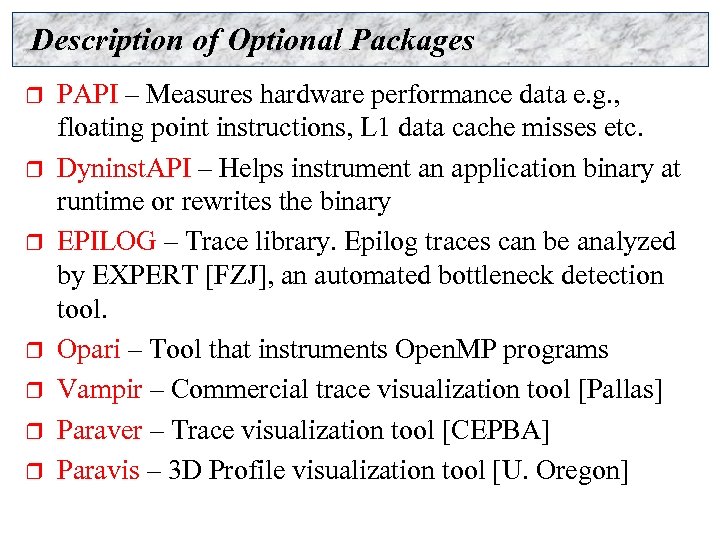 Description of Optional Packages r r r r PAPI – Measures hardware performance data e. g. , floating point instructions, L 1 data cache misses etc. Dyninst. API – Helps instrument an application binary at runtime or rewrites the binary EPILOG – Trace library. Epilog traces can be analyzed by EXPERT [FZJ], an automated bottleneck detection tool. Opari – Tool that instruments Open. MP programs Vampir – Commercial trace visualization tool [Pallas] Paraver – Trace visualization tool [CEPBA] Paravis – 3 D Profile visualization tool [U. Oregon]
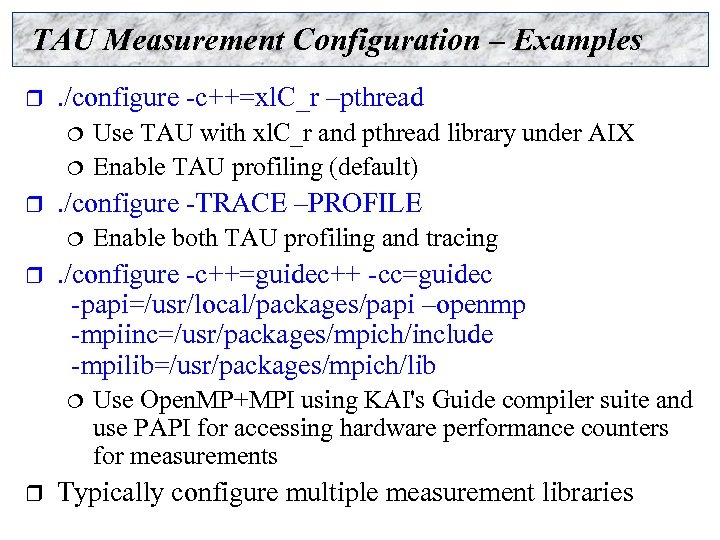 TAU Measurement Configuration – Examples r . /configure -c++=xl. C_r –pthread ¦ ¦ r . /configure -TRACE –PROFILE ¦ r Enable both TAU profiling and tracing . /configure -c++=guidec++ -cc=guidec -papi=/usr/local/packages/papi –openmp -mpiinc=/usr/packages/mpich/include -mpilib=/usr/packages/mpich/lib ¦ r Use TAU with xl. C_r and pthread library under AIX Enable TAU profiling (default) Use Open. MP+MPI using KAI's Guide compiler suite and use PAPI for accessing hardware performance counters for measurements Typically configure multiple measurement libraries
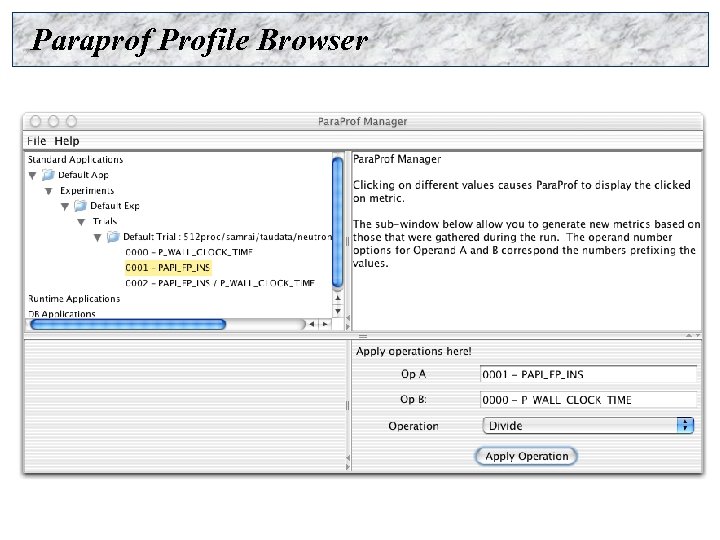
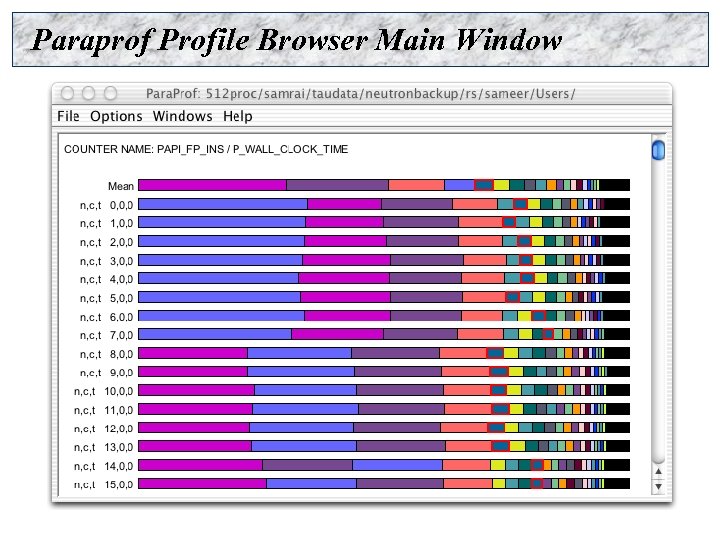
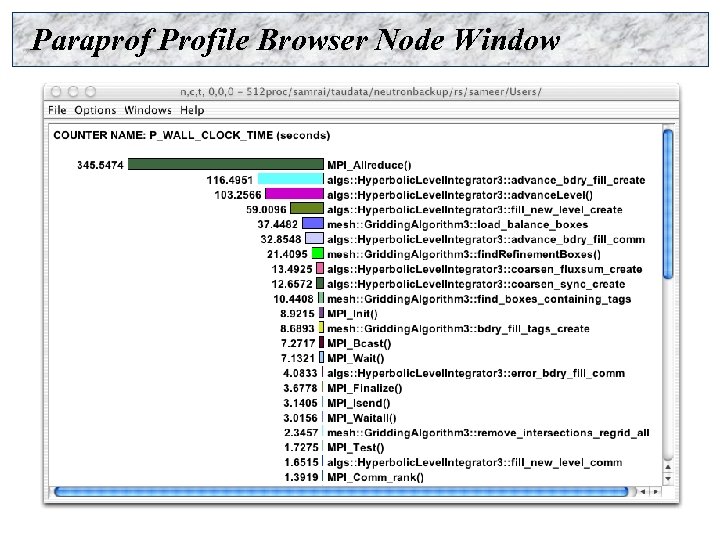
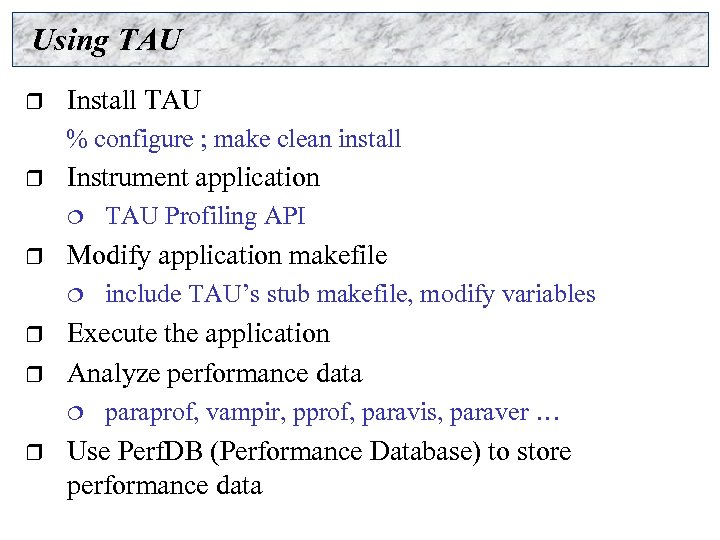 Using TAU r Install TAU % configure ; make clean install r Instrument application ¦ r Modify application makefile ¦ r r include TAU’s stub makefile, modify variables Execute the application Analyze performance data ¦ r TAU Profiling API paraprof, vampir, pprof, paravis, paraver … Use Perf. DB (Performance Database) to store performance data
 Setup: Running Applications % set path=($path
 Paraprof Profile Browser
 Paraprof Profile Browser Main Window
 Paraprof Profile Browser Node Window
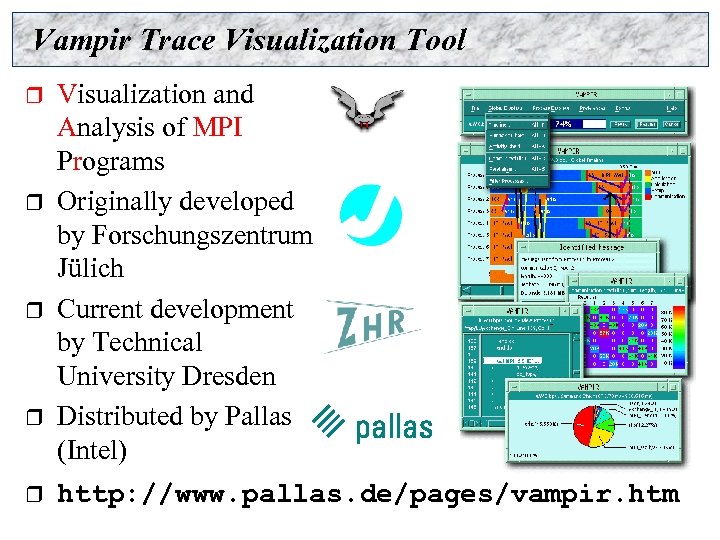 Vampir Trace Visualization Tool r r r Visualization and Analysis of MPI Programs Originally developed by Forschungszentrum Jülich Current development by Technical University Dresden Distributed by Pallas (Intel) http: //www. pallas. de/pages/vampir. htm
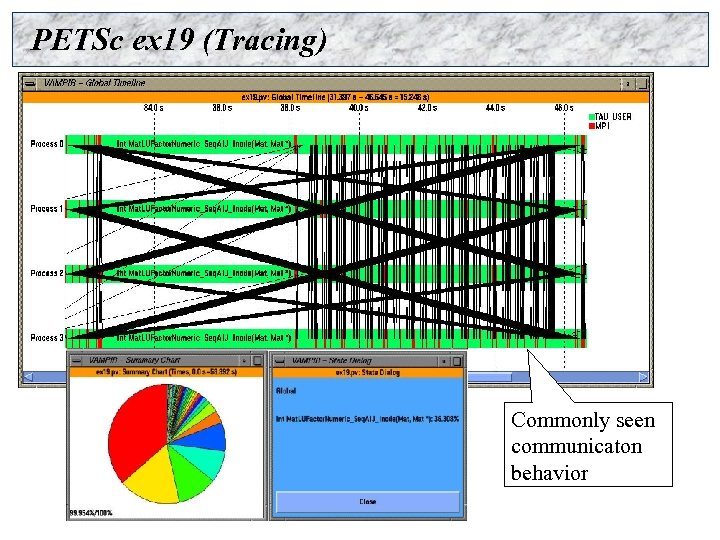 PETSc ex 19 (Tracing) Commonly seen communicaton behavior
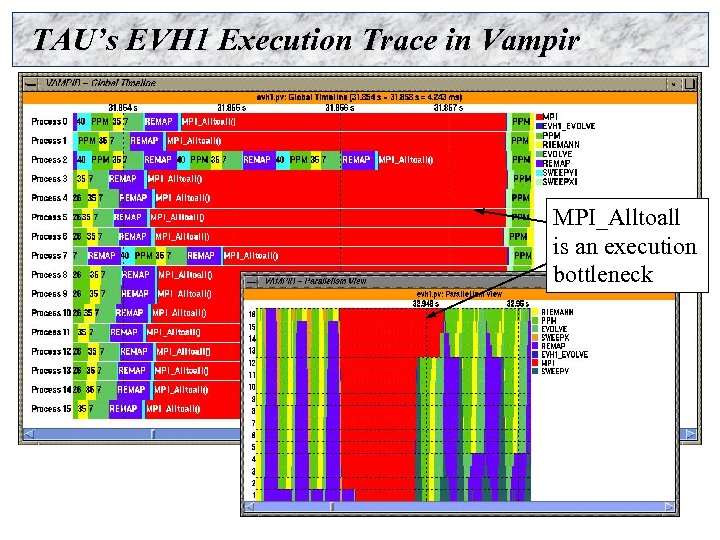 TAU’s EVH 1 Execution Trace in Vampir MPI_Alltoall is an execution bottleneck
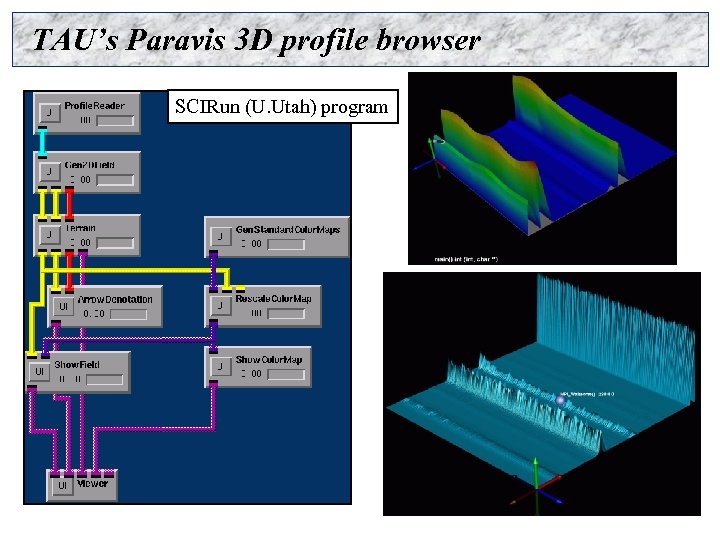 TAU’s Paravis 3 D profile browser SCIRun (U. Utah) program
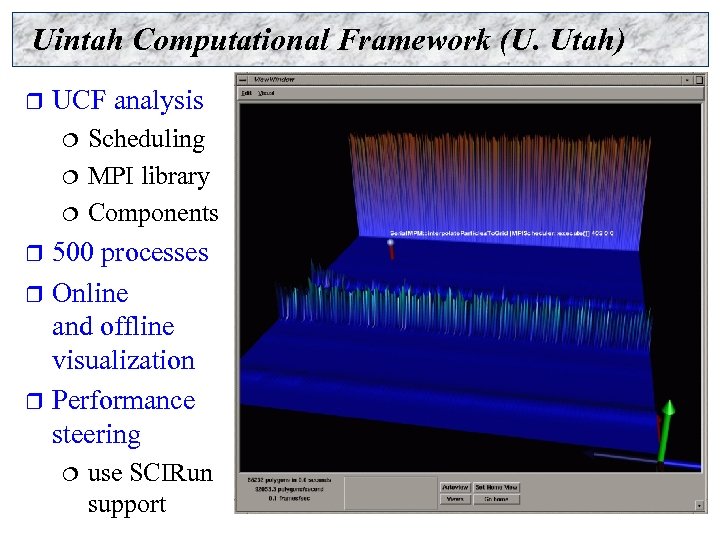 Uintah Computational Framework (U. Utah) r UCF analysis Scheduling ¦ MPI library ¦ Components ¦ 500 processes r Online and offline visualization r Performance steering r ¦ use SCIRun support
 TAU Performance System Status r Computing platforms ¦ r Programming languages ¦ r pthreads, Java, Windows, Tulip, SMARTS, Open. MP Compilers ¦ r C, C++, Fortran 77/90, HPF, Java, Python Thread libraries ¦ r IBM SP, SGI Origin 2 K/3 K, ASCI Red, Apple, Cray X 1, SV 1, T 3 E, HP/Compaq SC, HP Superdome, Sun, Windows, Linux (IA-32, Opteron, IA-64, Alpha…), NEC, Hitachi, … Cray, KAI, PGI, GNU, Fujitsu, Sun, Microsoft, SGI, Cray, IBM, HP -Compaq, NEC, Hitachi, HP, Absoft, NAGWare, Intel… Version 2. 13 available from: ¦ http: //www. cs. uoregon. edu/research/paracomp/tau
 Concluding Remarks Complex software and parallel computing systems pose challenging performance analysis problems that require robust methodologies and tools r To build more sophisticated performance tools, existing proven performance technology must be utilized r Performance tools must be integrated with software and systems models and technology r Performance engineered software ¦ Function consistently and coherently in software and system environments ¦
 Support Acknowledgements r r Department of Energy (DOE) ¦ Office of Science contracts ¦ University of Utah DOE ASCI Level 1 sub-contract ¦ DOE ASCI Level 3 (LANL, LLNL) NSF National Young Investigator (NYI) award Research Centre Juelich ¦ John von Neumann Institute for Computing ¦ Dr. Bernd Mohr Los Alamos National Laboratory


