cb064b080782ebbccb993ac0b763ac6a.ppt
- Количество слайдов: 21


The State of the Public Transportation Industry Flora Castillo APTA Chair Board Member, NJ TRANSIT April 22, 2013

Ridership Growth Seattle, WA 4. 1 Salt Lake City, UT 3. 6% Indianapolis, IN 9. 4% Denver, CO 2. 7% Columbus, OH 10. 1% Albuquerque, NM 7. 2% Nashville, TN 7. 3% Pittsburgh, PA 4. 7% Riverside, CA 7% Phoenix, AZ San Diego, 3% CA 7% Canton, OH 8. 9% Dallas, TX 10% New Orleans, LA 8. 3% Ft. Myers 19. 7%
 (17%) (22%)")
Public Transportation Use Growing Faster Than Population and Highway Use (1995 -2012) (17%) (22%) (34%) 4

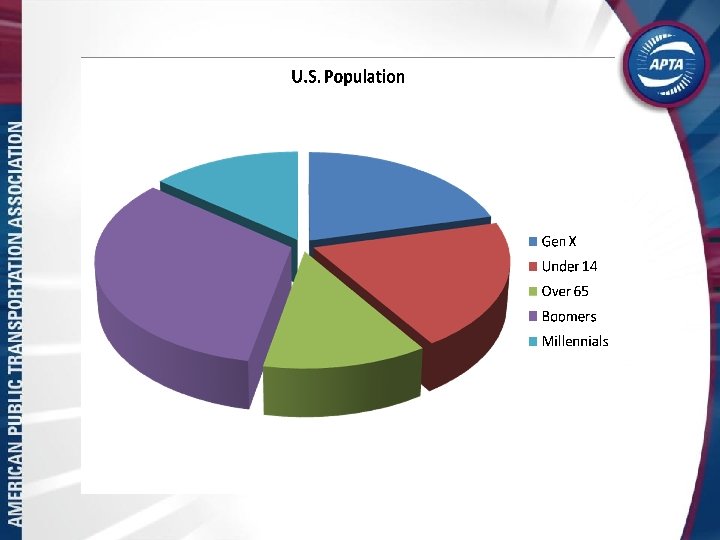
Public Transportation in the U. S. • 53% of trips on buses • 42% of trips on rail • 5% on other modes 5

Commuter Rail Has Grown 1970: 9 systems 2012: 29 systems 6

Light Rail Is Booming 1970: 7 systems 2012: 36 systems 7

Public Transit’s Economic Clout $57 billion industry Directly employs more than 400, 000 people Supports 1. 9 million public & private sector jobs 8

White House Panel on Women In Transportation

APTA’s Veteran and Military Family Resource Center apta. com/veterans


Signing Ceremony for MAP-21

Increase in Percentage of Alternative Fueled Buses 20% 18% 16% Percent of Bus Fleet 14% 12% 10% 8% 6% 4% 2% 0% 1996 1999 Natural Gas 2002 Hybrid 2005 2008 Biodiesel and Other 2011


Young People Postponing Driving Percent of U. S. Population between 16 and 19 with driver's license 77% 19 92% 68% 18 Age 86% 49% 17 75% 31% 16 50% 0% 10% 20% 30% 40% 2008 50% 60% 1978 70% 80% 90% 100%

Public Transit Vital to Mobility

State of Disrepair

Public Transit Infrastructure Graded a “D”

A Vision of What’s Ahead

Thank You!
cb064b080782ebbccb993ac0b763ac6a.ppt