

6fcfd174f88e29e892647be19262b17d.ppt
- Количество слайдов: 90
 The Same River Twice: Applied Climatology in a Changing Environment Kelly T. Redmond Western Regional Climate Center Desert Research Institute Reno Nevada 17 th AMS Conference on Applied Climatology Whistler BC 2008 August 11 -14
 BAMS, March 1997
 “No man ever sets foot in the same river twice, for it’s not the same river and he’s not the same man. ” Heraclitus of Ephesus 535 -475 BC
 Starting point: “Applied Climatology: A Glorious Past – An Uncertain Future” Stan Changnon, 1995, 9 th AMS Conference on Applied Climatology, Dallas, January 15 -20 Issues 1) Whether data and information were being effectively used 2) Significant problems with data 3) Gaps between users (or potential users) and providers of data and information. 4) Concern about an uncertain future for applied climate 5) Field in the midst of an identity crisis, thus not sufficiently appreciated or understood
 AMS 14 th Conference on Applied Climatology The Lifelong Work of Stan Changnon 13 January 2004 What’s new ? (ktr) External (world at large) Computing The Web Powerpoint everywhere An increasingly interdisciplinary mindset Health of the environment concerns Climate change prospects Service mentality resurrected Internal (to climate services community) State climate programs more active and visible Regional Climate Center program Regional Integrated Sciences and Assessments program
 And a second look: “Applied Climatology: The Golden Age Has Begun” Stan Changnon, 2005. Bulletin of the American Meteorological Society, July, 86(7), 915 -919. Even so, still some issues: 1) Teaching of applied climatology still too limited 2) Adequacy of instrumentation and data collection 3) Outreach and awareness still not sufficient 4) Better information on impacts of extremes 5) Need better information on climate change effects
: “My interpretation is that applied climatology describes,") What is applied climatology? Stan Changnon (2005): “My interpretation is that applied climatology describes, defines, interprets, and explains the relationships between climate conditions and countless weather-sensitive activities. ” Its work ranges over four basic areas: 1) Design of structures and planning of activities 2) Assessments of current and past conditions, including evaluation of extreme events 3) Study of the relationships between weather / climate conditions and those in other parts of the physical and socioeconomic worlds 4) Operation of weather-sensitive systems that employ climatic information in making decisions
What is applied climatology? Stan Changnon (2005): “My interpretation is that applied climatology describes, defines, interprets, and explains the relationships between climate conditions and countless weather-sensitive activities. ” Its work ranges over four basic areas: 1) Design of structures and planning of activities 2) Assessments of current and past conditions, including evaluation of extreme events 3) Study of the relationships between weather / climate conditions and those in other parts of the physical and socioeconomic worlds 4) Operation of weather-sensitive systems that employ climatic information in making decisions
 What is changing? Many of the underlying issues remain the same, but what is changing is the context. 1) Changes in climate (the physical system) 2) Changes in the understanding of climate 3) Changes in needs for climate information Old, familiar needs New needs, new applications, more sophisticated applications
 Five themes of interest 1. Climate stationarity, evolving statistics, challenges /opportunities 2. Observational underpinnings for climate applications 3. Quality control, and quality control of quality control 4. Mountain climates, and related scale issues 5. The role of a National Climate Service
 A preliminary: Applications as forecasts An implicit assumption that has pervaded much of applied climatology Past is Prologue Past statistics = Future statistics The decision that uses the information is about the future Therefore, past values often de facto forecasts Not explicitly recognized as such Past is considered reliable guide to the future Climate stationarity is implicit in this assumption Huge societal investments ($B, $$$B) Bulletin 17 B
 National Research Council January 1999
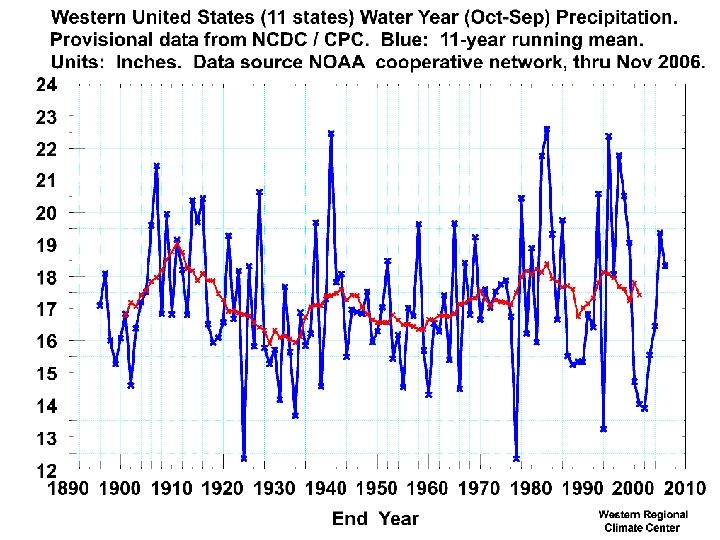
 Water Year Oct-Sep Precip South Coastal California 1895/96 thru 2006/07
 Karl and Knight, 1998. Fraction of annual total from upper 10 th percentile, US Average.
") IDF curves for Bagdad (Arizona!)
IDF curves for Bagdad (Arizona!)
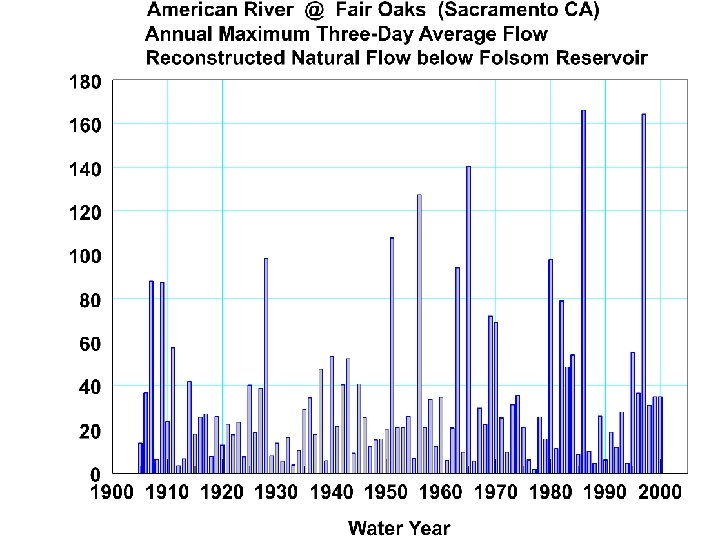
 1414 Years Redmond, K. T. , Y. Enzel, P. K. House, and F. Biondi, 2002. Climate variability and flood frequency at decadal to millennial time scales. pp. 21 -45, in Principles and Applications of Paleoflood Hydrology, editors: P. K. House, R. H. Webb, and V. R. Baker, American Geophysical Union, 385 pp.
 Redmond, K. T. , Y. Enzel, P. K. House, and F. Biondi, 2002. Climate variability and flood frequency at decadal to millennial time scales. pp. 21 -45, in Principles and Applications of Paleoflood Hydrology, editors: P. K. House, R. H. Webb, and V. R. Baker, American Geophysical Union, 385 pp.
 1. “Stationarity is dead” * Stationarity was never really fully alive. “The history of climate is a nonstationary time series. ” * Corollary: There are no true climatic “normals”. * P. C. D. Milly, Julio Betancourt, Malin Falkenmark, Robert M. Hirsch, Zbigniew W. Kundzewicz, Dennis P. Lettenmaier, Ronald J. Stouffer, 2008. Stationarity is dead: Whither water management? . Science, 319 (5863), 573 -574, 1 Feb 2008. * Reid A. Bryson, 1997. The Paradigm of Climatology: An Essay. Bulletin of the American Meteorological Society, 78(3), 449 -455.
 Courtesy of Mike Dettinger, USGS / Scripps. Yesterday Tomorrow Dettinger MD. 2005. From climate change spaghetti to climate-change distributions for 21 st Century California. San Francisco Estuary and Watershed Science. Vol. 3, Issue 1, (March 2005), Article 4. http: //repositories. cdlib. org/jmie/sfews/vol 3/iss 1/art 4
 Stationarity, if even alive, is not feeling well … “under the weather” The “present future” will slowly depart from its “prior future” Stationarity slowly but progressively becoming a less valid assumption How much until this departure is “significant” ? (not so much in statistical terms, but in practical terms) Major question looming: How do we adjust all the statistics of the past to reflect the expected future? This is a very big challenge / opportunity for Applied Climatology A growth industry Methodology Application of that methodology Acceptance of that methodology
: Is it") 2. Observations: Real climate change versus fake climate change Change (and variability): Is it observational methodology, or is it climate ? ? ? Is it perception or is it reality ? Is it the perceiver or the perceived ? Do we trust the data ? ? ? The bigger (real) question: Is what we think we believe really true ? ?
2. Observations: Real climate change versus fake climate change Change (and variability): Is it observational methodology, or is it climate ? ? ? Is it perception or is it reality ? Is it the perceiver or the perceived ? Do we trust the data ? ? ? The bigger (real) question: Is what we think we believe really true ? ?
 Observations: A perpetual preoccupation among applied climatologists Consistency through time as a hallmark of climate observations. A necessity, not just a convenience. What is the depth of our commitment to this issue? The value of an observational record increases nonlinearly with its length. Some things can only be discovered from long records. 1. Keep observations going. 2. QC – Keep obs honest and accurate and representative (side question: representative of what ? )
 Yosemite Valley TMAX 1950 Yosemite South Entrance TMAX 2005 1950 2005 John Abatzoglou
 Double Mass comparison of Yosemite Valley and South Entrance TMAX 1950 2005
 Kelly Redmond Ctsy: surfacestations. org
 Chinle Airport, Arizona. HCNM prospect. View to the North, East, West, and South.
 HCNM Grid 50 km Radius Green CRN Red TBD Yellow Survey Done Blue In prog
 HCN-M Bonus. Security Guards !! Dave Simeral, WRCC
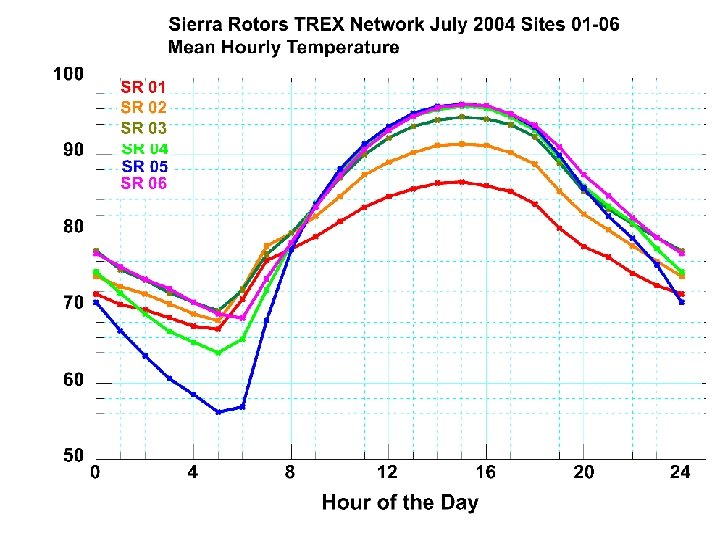
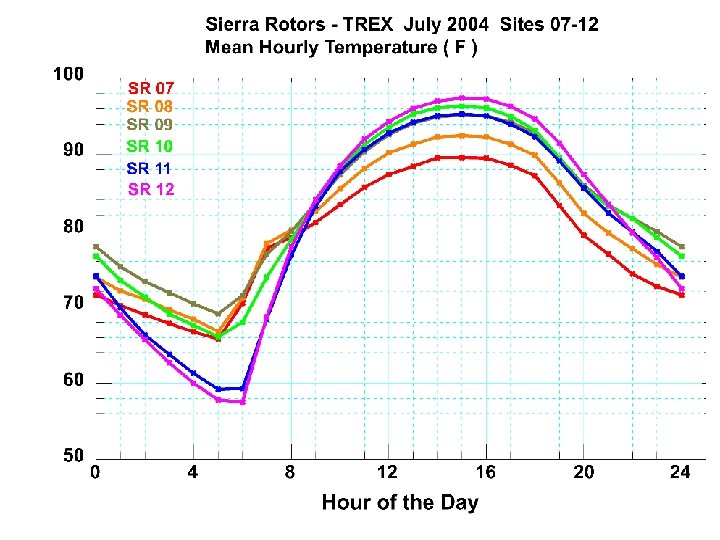
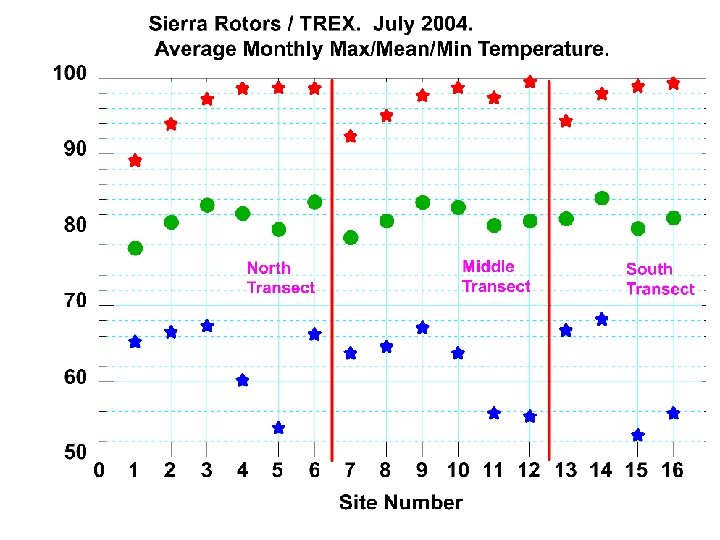
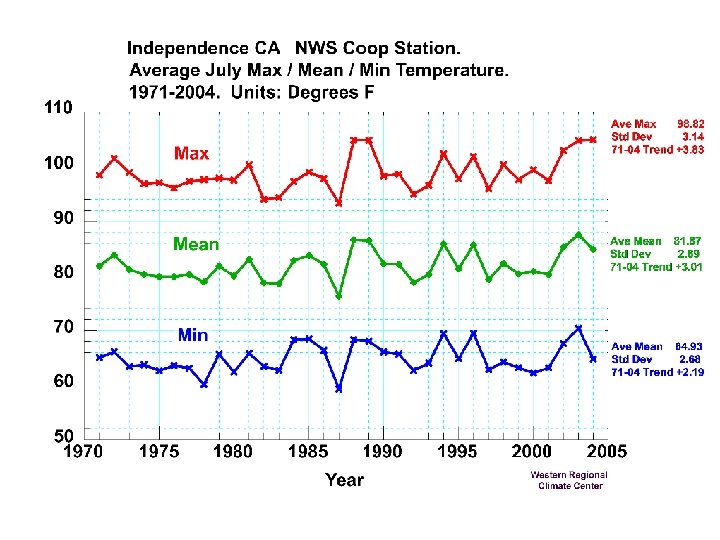
 TREX – Terrain Induced Rotors Experiment Independence CA Owens Valley 6 mi 10 km
 TREX – Terrain Induced Rotors Experiment Independence CA Owens Valley 1 km 1 mile
 Elevation Transect Across Owens Valley south of Independence CA Vertical Exaggeration Approximately 4 X
 TREX Site 05 Looking South
 TREX Site 05 Looking West
 TREX Site 05 Looking North
 TREX Site 05 Looking East
 Kunkel, Robinson, Easterling, Hubbard, Palecki, Redmond
 Kunkel, Robinson, Easterling, Hubbard, Palecki, Redmond
 Kunkel, Robinson, Easterling, Hubbard, Palecki, Redmond
 The Price of Data Quality is Eternal Vigilance. - Thomas Cooperative Observer Jefferson
 3. The Essence of Quality Control The evaluation and improvement of imperfect data by making use of other imperfect data.
") QC: Observation quality Type I errors : Reject good values (“good” = correct, valid) Type II errors : Accept bad values (“bad” = incorrect, not valid) Often is a trade-off between Type I and Type II error detection Mis-edits: presently, with SOD, about 60 % are bad edits of good data Vetting of QC process. QC the QC. Matte Menne and Imke Durre. Bias detection. Catching subtle errors. PRISM Nipher example. QC in mountains and complex terrain. Scale issues. Fine scale structure in climate averages. Fine scale structure in the spatial correlation field. Differences among elements in the spatial correlation field. Time scale differences in the spatial correlation field. Upwind versus downwind precipitation correlation fields.
QC: Observation quality Type I errors : Reject good values (“good” = correct, valid) Type II errors : Accept bad values (“bad” = incorrect, not valid) Often is a trade-off between Type I and Type II error detection Mis-edits: presently, with SOD, about 60 % are bad edits of good data Vetting of QC process. QC the QC. Matte Menne and Imke Durre. Bias detection. Catching subtle errors. PRISM Nipher example. QC in mountains and complex terrain. Scale issues. Fine scale structure in climate averages. Fine scale structure in the spatial correlation field. Differences among elements in the spatial correlation field. Time scale differences in the spatial correlation field. Upwind versus downwind precipitation correlation fields.
 QC: Observation quality - 2 Spatial correlation structures Time scale dependent Seasonal Asymmetries – topographic orientation and elevation Surface state – presence / absence of snow cover Baker / Rainier, Corvallis Water Bureau, Pescadero floods “Official” records versus credible records
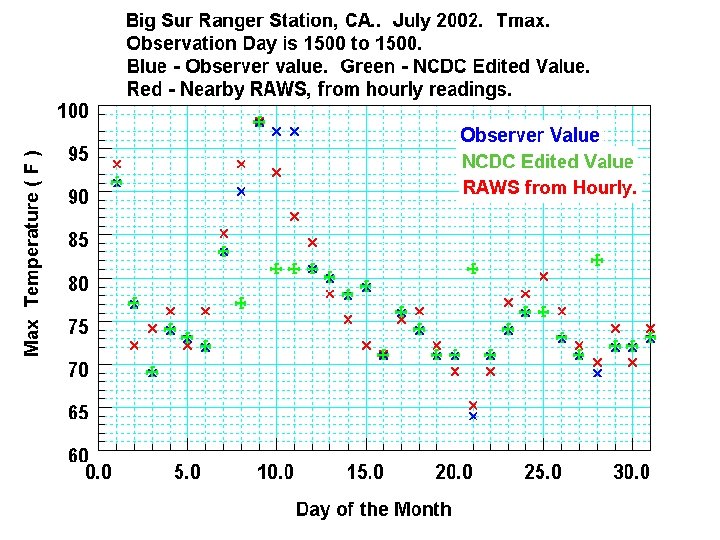
 Big Sur Ranger Station COOP RAWS
 K. Redmond, 2003. p 29 -48, Water and Climate in the Western United States. U Colorado Press.
 K. Redmond, 2003. p 29 -48, Water and Climate in the Western United States. U Colorado Press.
 1971 -72 Oct – Apr 700 mb Height Departure From Average Snowy at Rainier Paradise K. Redmond, WRCC, with CDC graphics.
 1998 -99 Oct – Apr 700 mb Height Departure From Average Snowy at Mt Baker Ski Area K. Redmond, WRCC, with CDC graphics.
 K. Redmond, WRCC, with De. Lorme graphics.") Mount Baker Snowfall 1141+ inches (1998 -1999) K. Redmond, WRCC, with De. Lorme graphics.
Mount Baker Snowfall 1141+ inches (1998 -1999) K. Redmond, WRCC, with De. Lorme graphics.
 K. Redmond, WRCC, with De. Lorme graphics.") Mount Rainier Snowfall 1122 inches (1971 -1972) K. Redmond, WRCC, with De. Lorme graphics.
Mount Rainier Snowfall 1122 inches (1971 -1972) K. Redmond, WRCC, with De. Lorme graphics.
 4. Mountain climate relations to human society CIRMOUNT (Consortium for Integrated Climate Research in Western Mountains) High elevation climate behavior matters to low elevation populations Footprint of civilization extends upstream to headwaters Large populations depend on mountain resources Mountain climate understanding: Climate base state, and its variability, in complex or elevated terrain is accessible to physical understanding. Is not sufficient to simply say “it’s too complicated”
 Mt Warren Summit Station 12, 327 ft
 Mean Annual Freezing Level near Maricopa CA. Fig ctsy John Abatzoglou.
 20 February 2007
 White Mtn Summit, 14246 ft Reconfigured July 2004
 White Mountain Research Station Summit Station. 14, 245 feet. White diamond. North American Regional Reanalysis grid. 32 km, 3 -hourly, 29 levels. John Abatzoglou Kelly Redmond
 White Mountain Summit Temperature. 14, 245 feet. Reconstructed from Global Reanalysis. 99 % of NARR-derived temperatures are within +/- 3 Deg C. ~1000 days of coincident values. Mean Annual Temperature 1958 -2007 Trend 0. 24 C/decade, 30% greater than California Statewide. Trends greatest above 6000 feet. Freezing level In spring: trend 1958 -2008 170 ft/decade 52 m/decade Days with Mean Daily Temperature Above Freezing ( 0 C ) John Abatzoglou Kelly Redmond
 Elements of Applied Climatology Observations Operational products Tools Interactions with users Outreach, training and education Learning from and advising the research infrastructure Pipeline to and from the national research infrastructure Public and private activities Providing what is needed versus what is wanted The skill in Applied Climatology is in distinguishing between these Additional western consideration Knowledge of the 3 -dimensional field of evolving climate at a scale of 0. 5 -1. 0 km
 - 1 Thoughts after Vail June") Applied Climatology and a National Climate Service (NCS) - 1 Thoughts after Vail June 2008 Workshop Needs and applications are increasing and diversifying General feeling that the present structure Is not delivering all that is needed Is not able to deliver all that is needed Needs to be more responsive Is not internally wired and interconnected well enough Does not understand enough about the decision environment Does not have sufficient problem focus: user pull vs. provider push Climate Change is the motivation …. . Increasingly embraced by the public New problem, novelty factor Unprecedented type of problem The play is bigger than any actor No single entity has a corner on the problem Multi-partner solutions needed …. . But, climate change not necessary to justify NCS
Applied Climatology and a National Climate Service (NCS) - 1 Thoughts after Vail June 2008 Workshop Needs and applications are increasing and diversifying General feeling that the present structure Is not delivering all that is needed Is not able to deliver all that is needed Needs to be more responsive Is not internally wired and interconnected well enough Does not understand enough about the decision environment Does not have sufficient problem focus: user pull vs. provider push Climate Change is the motivation …. . Increasingly embraced by the public New problem, novelty factor Unprecedented type of problem The play is bigger than any actor No single entity has a corner on the problem Multi-partner solutions needed …. . But, climate change not necessary to justify NCS
 - 2 Agencies and organizations are") Applied Climatology and a National Climate Service (NCS) - 2 Agencies and organizations are looking (pleading) for help Adaptation a major theme (Roger) Long tradition of improving adaptation to the present climate More and better data, and access to data, are constant refrain Turning data into information Big need for tools Drought and NIDIS as a good test case Boldness and vision vs. Incrementalism (Vail meeting, Eileen) Western and mountain needs, in addition Data quality, completeness, density, accessibility, scale issues (Chris) Fine scale structure in temporal evolution of 3 -D spatial patterns (Chris, Jessica) Need to observe Need to describe Need to understand
Applied Climatology and a National Climate Service (NCS) - 2 Agencies and organizations are looking (pleading) for help Adaptation a major theme (Roger) Long tradition of improving adaptation to the present climate More and better data, and access to data, are constant refrain Turning data into information Big need for tools Drought and NIDIS as a good test case Boldness and vision vs. Incrementalism (Vail meeting, Eileen) Western and mountain needs, in addition Data quality, completeness, density, accessibility, scale issues (Chris) Fine scale structure in temporal evolution of 3 -D spatial patterns (Chris, Jessica) Need to observe Need to describe Need to understand
 But, if you are inside a box and thinking, could you be described as thinking outside the box? Or, conversely, if you were outside of a box and thinking, would all your thinking be outside the box? Or, if you were outside the box and wanted to think of something that is inside the box, would that be impossible? The mind reels. Glen Courtesy Glen Conner, Kentucky State Climatologist Emeritus, 2007 Oct 15
 Let’s be creative !!!
 Thank You.
 Discards
 Whale Point, 400 ft Highlands Peak, 2500 ft
 2006 California Heat Wave Highlands Pk 2500 ft Whale Pt 400 ft
 Winter Summer Maricopa CA Spring Autumn
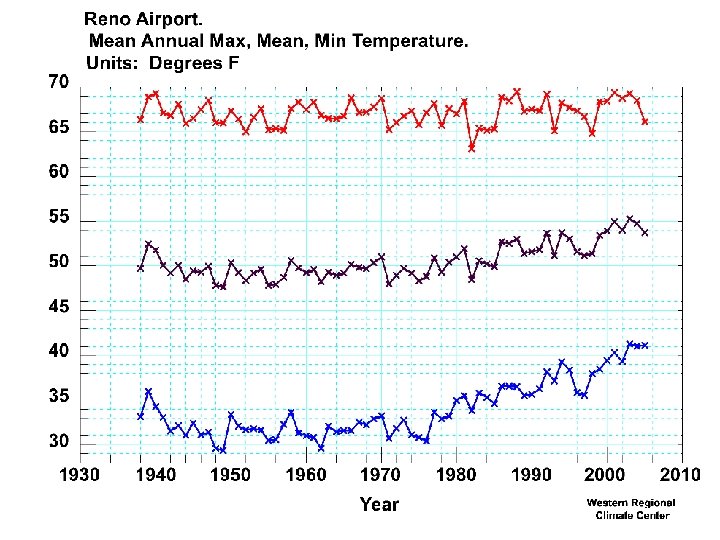
 Approximate Urban / Downtown “Heat Bubble” KRNO ASOS (between runways) Temporary") Reno Airport (KRNO) Approximate Urban / Downtown “Heat Bubble” KRNO ASOS (between runways) Temporary ASOS (“not windy enough”) *********** Temperature differences can be 6 -8 degrees F from one end of runway to the other, at night.
Reno Airport (KRNO) Approximate Urban / Downtown “Heat Bubble” KRNO ASOS (between runways) Temporary ASOS (“not windy enough”) *********** Temperature differences can be 6 -8 degrees F from one end of runway to the other, at night.
 and Highlands Peak (2500 ft), Big Sur. 2 miles apart.") Whale Point (400 ft) and Highlands Peak (2500 ft), Big Sur. 2 miles apart. Whale Point 400 ft Highlands Peak 2500 ft
Whale Point (400 ft) and Highlands Peak (2500 ft), Big Sur. 2 miles apart. Whale Point 400 ft Highlands Peak 2500 ft
 Big Sur, Whale Point, Big Creek UC Reserve, 400 ft
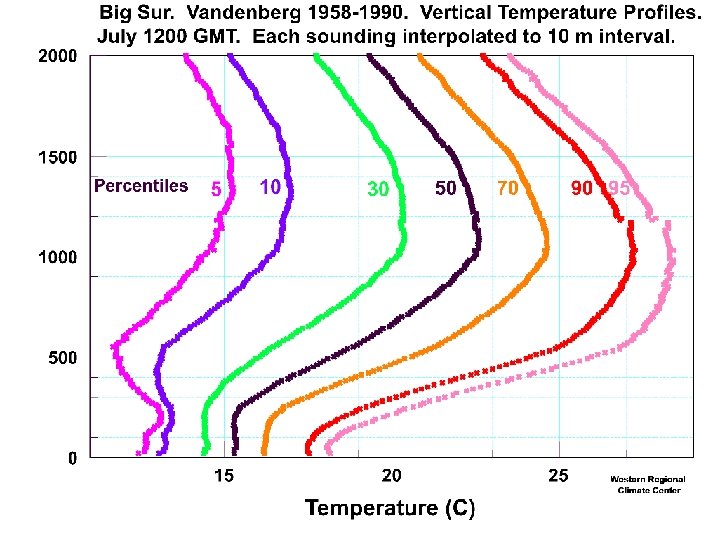
 1971 -2000 (1") July Maximum Temperature -- Central California Coast 1961 -1990 (4 km) 1971 -2000 (1 km)
July Maximum Temperature -- Central California Coast 1961 -1990 (4 km) 1971 -2000 (1 km)
 Kunkel, Robinson, Easterling, Hubbard, Palecki, Redmond
 Extreme Precipitation Index 1 -Day United States 1895 -2000. Selected durations 5 -Day And Return periods (1, 5, 20 yrs) (Station density effects removed) 10 -Day 30 -Day Ken E. Kunkel, Dave R. Easterling, Kelly T Redmond, and Ken G. Hubbard, 2003. Temporal variations of extreme precipitation events in the United States: 1895 -2000. Geophysical Research Letters, 30: 1717.