

14262a4855a2a8eedf43124f7729eab0.ppt
- Количество слайдов: 98
 The Role of World Class Marketing in Successful Businesses by Professor Malcolm Mc. Donald Cranfield School of Management South Africa 2003
 Strategic Marketing Masterclass – its role in profitable growth Day 1 by Professor Malcolm Mc. Donald Cranfield School of Management
 Strategic Marketing Planning
 1. Strategic Marketing Planning The objectives for this module are: l to illustrate the crucial link between marketing and other business functions, particularly finance l to spell out the specific role of strategic marketing planning in creating profitable growth l to spell out the process for doing this Outputs/deliverables l focus on and augment best practice marketing planning skills l improve understanding of the techniques involved
 Programme l Key issues facing organisations l How excellent companies are responding l Strategic marketing planning for profit growth l Where to start l How to do it l The Process
 Thought Starters Deliverables from your strategic marketing plan: l l l Can you list your key target markets? (in order of priority) Can you describe (quantitatively and qualitatively) the value that is required by each of your key target markets? In each of these key target markets, can you describe how your organisation creates this value? Do the relevant senior people in your organisation understand support the above three points? Are all the relevant functions in your company organised in a way that is supportive of delivering the value required by the customer?
 The purpose of strategic marketing planning The overall purpose of strategic marketing planning, and its principal focus is the identification and creation of sustainable competitive advantage © Professor Malcolm Mc. Donald, Cranfield School of Management
 Financial Risk Low High Business Risk Low Adapted from Srikanthan, Cranfield School of Management
 Financial Risk and Return High 1 Return 2 3 Low Adapted from Srikanthan, Cranfield School of Management Risk High
 Differentiation High Price Sales Revenue High Volume") The route to Sustainable Competitive Advantage (SCA) Differentiation High Price Sales Revenue High Volume Economies of Scale Learning Curve Operations Lower Costs Financial Gearing Interest Cover Working Capital Ratio Operational Leverage From Srikanthan, Cranfield School of Management Low Business Risk Low Financial Risk High Cash Flows Positive NPV SCA
The route to Sustainable Competitive Advantage (SCA) Differentiation High Price Sales Revenue High Volume Economies of Scale Learning Curve Operations Lower Costs Financial Gearing Interest Cover Working Capital Ratio Operational Leverage From Srikanthan, Cranfield School of Management Low Business Risk Low Financial Risk High Cash Flows Positive NPV SCA
 Strategy Effective Ineffective Efficient Die Thrive Die Survive Tactics Inefficient © Professor Malcolm Mc. Donald, Cranfield School of Management
 Thrive Die (slowly) Survive Tactics Inefficient © Professor") Strategy Ineffective Efficient Effective Die (quickly) Thrive Die (slowly) Survive Tactics Inefficient © Professor Malcolm Mc. Donald, Cranfield School of Management
Strategy Ineffective Efficient Effective Die (quickly) Thrive Die (slowly) Survive Tactics Inefficient © Professor Malcolm Mc. Donald, Cranfield School of Management
 A Salesperson Clever Lazy Hard Working Stupid © Professor Malcolm Mc. Donald, Cranfield School of Management
 Thrive Die (slowly) Survive Tactics Inefficient © Professor") Strategy Ineffective Efficient Effective Die (quickly) Thrive Die (slowly) Survive Tactics Inefficient © Professor Malcolm Mc. Donald, Cranfield School of Management
Strategy Ineffective Efficient Effective Die (quickly) Thrive Die (slowly) Survive Tactics Inefficient © Professor Malcolm Mc. Donald, Cranfield School of Management
 The need for a strategic marketing plan © Professor Malcolm Mc. Donald, Cranfield School of Management
 High Relative cost Low High Niche Outstanding Success Disaster Lowest cost Differentiation Low © Professor Malcolm Mc. Donald, Cranfield School of Management
 Sales revenue = RONA Sales revenue X") Operating income Net assets Operating income (ROS) Sales revenue = RONA Sales revenue X Net assets © Professor Malcolm Mc. Donald, Cranfield School of Management (Asset turnover)
Operating income Net assets Operating income (ROS) Sales revenue = RONA Sales revenue X Net assets © Professor Malcolm Mc. Donald, Cranfield School of Management (Asset turnover)
 Challenges l Market Maturity l Globalisation l Customer power © Professor Malcolm Mc. Donald, Cranfield School of Management
 Market Maturity © Professor Malcolm Mc. Donald, Cranfield School of Management
 Non-cumulative diffusion pattern 34% Early majority 34% Late majority 13. 5% Early adopters 16% Laggards Time of adoption 2. 5% Innovators Adapted from Everett Rogers
 Generalised cumulative and non -cumulative diffusion patterns Cumulative production of adopters Cumulative diffusion pattern 1. 00 Cumulative pattern 0. 80 0. 60 0. 40 Non-cumulative diffusion pattern 0. 20 0. 0 Time of adoption 34% Early majority 34% Late majority 13. 5% Early adopters 16% Laggards Time of adoption 2. 5% Innovators
 Globalisation © Professor Malcolm Mc. Donald, Cranfield School of Management
 © Professor Malcolm Mc. Donald, Cranfield School of Management
 Leaders 2 nd tier Guerillas © Professor Malcolm Mc. Donald, Cranfield School of Management
 Leaders ? Guerillas © Professor Malcolm Mc. Donald, Cranfield School of Management
 l l Production l Sales l Accountancy l Fads l © Professor Malcolm Mc. Donald, Cranfield School of Management Technology Marketing
 The Corporate Zit © Professor Malcolm Mc. Donald, Cranfield School of Management
 C C © Professor Malcolm Mc. Donald, Cranfield School of Management
 (Efficiency) Product/ Service Processes Customers Professional Marketing") How excellent companies are responding (Core Value) (Efficiency) Product/ Service Processes Customers Professional Marketing (Understanding Market Needs) People (Creativity)
How excellent companies are responding (Core Value) (Efficiency) Product/ Service Processes Customers Professional Marketing (Understanding Market Needs) People (Creativity)
 The value chain Provider Customer © Professor Malcolm Mc. Donald, Cranfield School of Management Consumer
 38 27 25 High 20 13") Quality and share both drive profitability ROI (%) 38 27 25 High 20 13 21 14 High 60% 25% Relative Market Share Source: PIMS 20 -1% 7 Low 40% Relative Product Quality
Quality and share both drive profitability ROI (%) 38 27 25 High 20 13 21 14 High 60% 25% Relative Market Share Source: PIMS 20 -1% 7 Low 40% Relative Product Quality
 Are you getting these essential deliverables from your strategic marketing plan? Score out of 10 Market structure and segmentation · Is there a clear and unambiguous definition of the market we are interested in serving? · Is it clearly mapped, showing product/service flows, volumes/values in total, our shares and critical conclusions for our organisation? · Are the segments clearly described and quantified? These must be groups of customers with the same or similar needs, not sectors. · Are the real needs of these segments properly quantified with the relative importance of these needs clearly identified? Differentiation · Is there a clear and quantified analysis of how well our company satisfies these needs compared to competitors? · Are the opportunities and threats clearly identified by segment? © Professor Malcolm Mc. Donald, Cranfield School of Management
 Detailed checklist of essential deliverables from a strategic marketing plan Score out of 10 Scope · Are all the segments classified according to their relative potential for growth in profits over the next three years and according to our company’s relative competitive position in each? · Are the objectives consistent with their position in the portfolio? (volume, value, market share, profit) · Are the strategies (including products, services and solutions) consistent with the objectives? · Are the measurement metrics proposed relevant to the objectives and strategies? · Are the key issues for action for all departments clearly spelled out as key issues to be addressed? Value capture · Do the objectives and strategies add up to the profit goals required by our company? · Does the budget follow on logically and clearly from all the above, or is it merely an add on? © Professor Malcolm Mc. Donald, Cranfield School of Management
 Strategic marketing planning l What is our purpose? l What is our Market? l Who are our customers? l What are our products? l What does the customer need? l l What are our strategies? – What new products should be developed? – How should we price our products? – What should our channel be? strategies How well do our products satisfy these needs? – What service levels should we provide for our different customer groups? What are our objectives? – How should we communicate with our target markets? How can we allocate our resources optimally? l How should we measure the effectiveness of our plan?
 Key areas for improvements in strategic marketing planning General comments A strategic marketing plan should be a clear and simple summary of key market trends, key target segments, the value required by each of them, how we intend to create superior value (to competitors), with a clear prioritisation of marketing objectives and strategies, together with the financial consequences. Frequently, they are diffuse, confusing compilations of unconnected individual sections.
 Key areas for improvements in strategic marketing planning Specific comments l l l l Market overviews contain substantially more information than is necessary, with no hint of the implications for marketing activity. Key segments are rarely identified. ‘Segments’ are often sectors or products, rather than groups of customers with similar needs. The competitive situation is not well analysed and plans appear to assume no activity or reaction by competitors. SWOT analyses rarely pin down convincingly the value that is required by segments. They are frequently too general to lead to any actionable prepositions. Our own distinctive competences are rarely isolated and built on. SWOTs are rarely summarised clearly and logically in a portfolio which provides a categorisation of the relative potential of each and our relative strengths in each. Marketing objectives are frequently confused with marketing strategies and do not follow logically from the portfolio summary. The resource implications of effecting the marketing plans are not always clear. Based on formal critiques of strategic marketing plans from the SBUs of multinational, industrial and service businesses (May 1996)
 Key elements of world class marketing 1. Profound understanding of the market-place 2. Creative segmentation and selection 3. Powerful differentiation positioning and branding 4. Effective marketing planning processes 5. Long-term integrated marketing strategies 6. Institutionalised creativity and innovation 7. Total supply chain management 8. Market-driven organisation structures 9. Careful recruitment, training and career management 10. Vigorous line management implementation
 Ansoff matrix PRODUCTS increasing technological newness Present New Present MARKETS increasing market newness New Market Penetration Product Development Market Extension Diversification © Professor Malcolm Mc. Donald, Cranfield School of Management
 1 revenue") Strategic planning exercise (gap analysis) 1 revenue
Strategic planning exercise (gap analysis) 1 revenue
 2 profit") Strategic planning exercise (gap analysis) 2 profit
Strategic planning exercise (gap analysis) 2 profit
 Profit improvement Productivity improvement Sales growth Existing assets Cost reduction Improve asset utilisation (experience and efficiency) Change asset base Increase price / reduce discounts Improve product / sales mix (margins) Market penetration Increase usage Take competitors’ customers Cash and margin focus Market development New segments Convert nonusers Growth focus Investment • Innovation • Diversification Divestment • Redevelopment of capital resources Capital Utilisation focus Product development Existing markets New markets
 MEASUREMENT PRODUCTIVITY Sales Revenue Costs Contribution e. g. -channel productivity -recency, frequency, etc. - - product mix customer mix sales force controls - better product mix - better customer mix - more sales calls - better promotional - sales promotion effectiveness - advertising measurement - D. M. - internet - call centre - exhibitions - other price monitoring - increase prices discount monitoring - reduce discounts - charge for deliveries debtor control - reduce debtor days - waste (cost) reduction - exits ® ® ® ® © © © © © MARKET PENETRATION Sales Revenue Costs (Maintenance) Costs (Development) Contribution - market growth/decline - market growth outlet penetration - market decline awareness - market share growth attitude motivation acquisition retention cross selling ® ® ® © PRODUCT DEVELOPMENT Sales Revenue Costs (Maintenance) Costs (Development) Contribution - new product sales n. p. awareness outlet penetration - incremental changes - totally new products ® ® © © MARKET DEVELOPMENT Sales Revenue Costs (Maintenance) Costs (Development) Contribution - product sales awareness outlet penetration - new geographical areas ® - new segments ® - new uses ® DIVERSIFICATION Copyright: Professor Malcolm Mc. Donald Cranfield School of Management, November 2002 © © © (NPs in NMs) - acquisition - joint ventures - licensing Sales Revenue Costs (Maintenance) Costs (Development) Contribution ® ® ® © © ©
 The marketing Planning process Phase 1 Goal setting Phase 2 The output of the marketing planning process Strategic marketing plan contents Financial summary Market overview Opportunities Threats Strengths Weaknesses Issues to be Addressed Market structure Market trends Key market segments Gap analysis (By product) (By segment) (Overall) Marketing Strategies Phase 4 Resource Allocation And monitoring Competitor analysis Industry/sector analysis Risk evaluation Ratio analysis, valuation studies Cost of capital NPV analysis Project evaluation Life cycle costing Issue management Profitability analysis by products / segments Comparative analysis of competitor products Experience curves and cost structures Key success factors matrix Market research Market segmentation studies Downside risk assessment Assumptions Marketing Objectives Marketing audit Market research Market segmentation studies Gap analysis Product life cycle analysis Diffusion of innovation Ansoff matrix Forecasting Market research B. C. G. Matrix Directional policy matrix Portfolio summary Strategy Formulation Financial theory / Structure Mission statement Situation review Phase 3 Marketing theory (Structures, frameworks, models) (By product) (By segment) (Overall) Strategic focus Product mix Product development Product deletion Market extension Target customer groups (4 x 4 ps) (Positioning/branding) Product Price Promotion Place Resource Requirements Marketing planning and marketing theory (structures, frameworks, models etc. ) © Copyright, professor Malcolm h. B. Mc. Donald 1987 Porter matrix Ansoff matrix Bcg matrix Directional policy matrix Gap analysis Market segmentation studies Market research Response elasticities Mc. Donald PRODUCTIVITY MATRIX Blake mouton matrix Forecasting Budgeting Measurement and review Cash flows and risk evaluation Sensitivity analysis Decision trees Probability theory Performance targets / ratios Cost, price, volume (CPV) analysis Marginal and absorption costing Activity base costing Budgeting and financial planning Zero base budgets Integrated financial planning Limiting resource analysis
 (less than 20 pages) l The") The contents of a strategic marketing plan (T+3) (less than 20 pages) l The purpose statement l Financial summary l Market overview l SWOT analysis l Portfolio summary l Assumptions l Objectives and strategies l Budget
The contents of a strategic marketing plan (T+3) (less than 20 pages) l The purpose statement l Financial summary l Market overview l SWOT analysis l Portfolio summary l Assumptions l Objectives and strategies l Budget
 Types of mission statements Type I ‘Motherhood’ - usually found inside annual reports. Designed to ‘stroke’ shareholders, otherwise no practical use Type II The real thing. A meaningful statement, unique to the organisation concerned, which ‘impacts’ the behaviour of the executives at all levels on Type III This is a ‘purpose’ statement ( or lower level mission statement). It is appropriate at the state/branch/or departmental level of the organisation.
 Unit mission statement This is the first item to appear in the business plan The purpose of the mission statement is to ensure that the raison d’être of the unit is clearly stated. Brief statements should be made which cover the following points: 1. Role or contribution of the unit e. g. profit generator, service department , opportunity seeker 2. Definition of the business e. g. the needs you satisfy or the benefit you provide. Don’t be too specific (e. g. ‘we sell milking machinery’) or too general (e. g. ‘we’re in the engineering business). 3. 4. Distinctive competence A brief statement that applies only to your specific unit. A statement that could equally apply to any competitor is unsatisfactory. Indications for the future A brief statement of the principal things you would give serious consideration to (e. g. move into a new segment).
 Market overview l What the market is l How it works l Key leverage points © Professor Malcolm Mc. Donald, Cranfield School of Management
 Market mapping …including the number of each customer type vol/ val % N N vol/ val % N vol/val % N Other Retailers Local Distributors N Contractors vol/ val % Regional Distributors National Distributors vol/val % vol/ val % UK Sales vol/val % N Spcist. Retailers N Detp. Retailers vol/val % N National Builders Local Builders N Private Companies N Local Government Users N Domestic Users vol/ val % vol/val % N Sheds vol/val % N = Number % = Your Share NB. Sketch out complex junctions separately. Alternatively, build an outline map, applying details at the junctions to be segmented. vol/val %
 Radiator Market Map 1996 Primary Leverage Point Radiator Manufacturer Distributor Installer Specification Decision Distribution Sector Share Stelrad 2275 41. 7% 1 2 3 4 Premier 1 860 2 15. 8% 3 4 Supaline 1 605 2 11. 1% 3 4 Barlo 1 480 2 8. 8% 3 4 Warmastyle 1 300 2 5. 5% 3 4 Other Imports 1 905 2 17. 1% 3 4 5455 1830 70. 2 360 17. 3 66 11. 2 Nil 555 21. 3 280 12. 8 26 4. 3 Nil 125 4. 8 450 20. 5 30 5. 1 Nil 90 3. 4 270 12. 3 120 20. 7 Nil 5 Nil 255 11. 6 40 6. 9 Nil Nil 556 25. 3 300 51. 8 80 100. 0 1. National Merchants 2605 47. 8% 5. British Gas 1 295 465 2 170 8. 5% 3 Nil 4 Nil 6. Installer 1 2755 2 2. Large 50. 5% 3 Independents 4 2190 40. 1% 7. Contractor 1 1905 2 34. 9% 3 3. Small 4 Independents 560 8. Self Installer 1 10. 6% 80 2 1. 4% 3 4 4. Sheds 80 9. Direct Works 1 1. 4% 250 2 4. 6% 3 4 5455 1065 1360 Nil 1135 540 230 Nil Nil 80 120 130 Nil Manufacturer 10 Nil 250 11 250 12 Nil 13 Nil 14 Nil 10 Nil Local 11 Nil Authority 12 1050 13 50 14 250 Housebuilder 10 Nil 11 350 12 Nil 13 Nil 14 Nil British Gas 10 500 700 11 100 12 50 13 Nil 14 50 Contractor 10 Nil 200 11 100 12 Nil 13 Nil 14 100 Consultant 10 Nil 550 11 Nil 12 Nil 13 50 14 500 3400 End User Segment 31. 3 10. Private Exitsting 2555 46. 8% 5 385 6 2010 7 100 8 80 9 Nil 95. 4 11. Private New 5 Nil 6 50 800 50. 0 7 750 14. 7% 27. 8 8 Nil 9 Nil 43. 8 12. Public Existing 1100 19. 6 20. 2% 12. 5 4. 5 5 50 6 395 7 506 8 Nil 9 150 5. 6 13. Public New 5 Nil 100 6 Nil 1. 8% 7 Nil 12. 5 8 Nil 9 100 11. 1 14. Commercial 5 50 900 6 300 16. 5% 7 550 8 Nil 50. 1 9 Nil 55. 6 623 5455
 Colours Red Black Market Map - Office Equipment Direct Field Sales 3% Type A Independent 9% 0% 1% 8% Type C Dealer Chain 15% 7% Type C Independent 4% 18% 5% 4% 4% 10% 2% 10% VARs Final Users Route to Market (black) Company’s Route to Market (red) 14% 3% Type B Independent 53% 3% Type B Dealer Chain Manufacturers Type A Dealer Chain 7% Buying Consortia Retail Direct Response Other 0% 8% 0% 12% Final Users
 l Channel chains
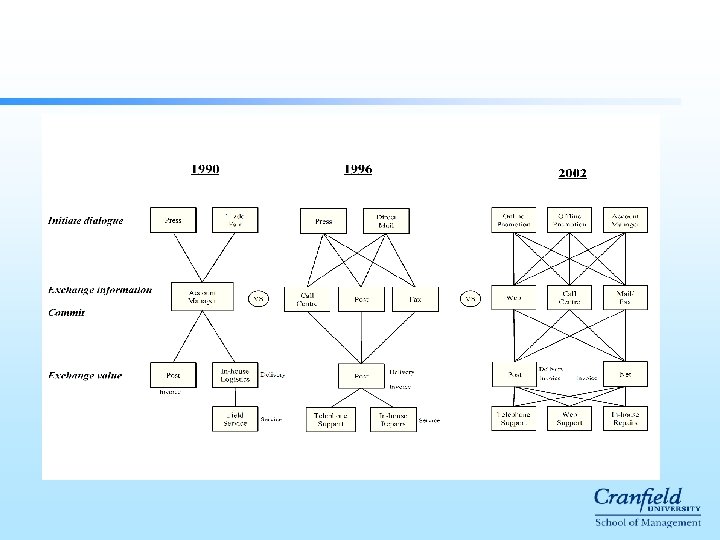
 Channel chains: major retailer Initiate dialogue Banner ad Leaflet Search engine Email Website Exchange information Website VS VS Purchase Store Delivery Post Store Service Post Service centre Store
 The building blocks for successful marketing Sales and Marketing Programme Marketing Plan Competitor audit Internal audit External audit Market structure
 …but if the basic building block is unsound! Sales and M Marketin g Prog ting P lan r o etit p om udit C a Exter nal audit Internal audit et structu Mark ramme re
 SWOT analysis l By segment, what value is required by the customer? l l What value are you offering to entice the customer to buy from you Avoid SWAGs © Professor Malcolm Mc. Donald, Cranfield School of Management
 Strategic marketing planning exercise - SWOT analysis 1. SEGMENT DESCRIPTION It should be a specific part of the business and should be very important to the organisation 2. CRITICAL SUCCESS FACTORS In other words, how do customers choose? 3. WEIGHTING (How important is each of these CSFs? Score out of 100) 4. STRENGTHS / WEAKNESSES ANALYSIS How would your customers score you and each of your main competitors out of 10 on each of the CSFs? Multiply the score by the weight. 1 You 2 1 3 2 4 3 5 4 OPPORTUNITIES 5. OPPORTUNITIES / THREATS What are the few things outside your direct control that have had, and will have, an impact on this part of your business? 1 2 3 4 5 6. KEY ISSUES THAT NEED TO BE ADDRESSED What are the really key issues from the SWOT that need to be addressed? Total 100 THREATS 5 Comp A Comp B Comp C Comp D
, ‘Profiting from e. CRM’,") Choosing channels: the channel curve Source: Wilson et al (2001), ‘Profiting from e. CRM’, FT Prentice Hall
Choosing channels: the channel curve Source: Wilson et al (2001), ‘Profiting from e. CRM’, FT Prentice Hall
 Value curve: pensions
 Customer-Oriented SWOT Analysis l SWOT can be made effective with the following guidelines – focus on specific issues/areas – shared vision - it works best with a planning team or group – customer orientation means nothing; can be a strength or weakness unless customers recognize and value it – environmental - opportunities and threats exist outside, they are not the things we plan to do – use it for structured strategy testing and generation 60
 Customer-Oriented SWOT Analysis The New Rules: Strengths and Weaknesses must be recognized by customers Opportunities and Threats exists in the environment, not because of us Strengths Matching strategies Weaknesses Conversion strategies Opportunities Threats 61
 A Hint l l If anyone says “X” is both our greatest strength and our greatest weakness, they are wrong It just means you need to think harder about what is it about “X” that creates a strength and what creates a weakness 62
 “We are an old-established firm” ? Strengths Weaknesses") Breaking Down Strengths and Weaknesses (1) “We are an old-established firm” ? Strengths Weaknesses Stable suppliers for after-sales service Trustworthy Experienced Inflexible Old-fashioned No innovations 63
Breaking Down Strengths and Weaknesses (1) “We are an old-established firm” ? Strengths Weaknesses Stable suppliers for after-sales service Trustworthy Experienced Inflexible Old-fashioned No innovations 63
 “We are a large supplier” ? Strengths Weaknesses") Breaking Down Strengths and Weaknesses (2) “We are a large supplier” ? Strengths Weaknesses Comprehensive product range and technical expertise Status/stability is reassuring Bureaucratic Offhand with customers No continuity of personal contacts 64
Breaking Down Strengths and Weaknesses (2) “We are a large supplier” ? Strengths Weaknesses Comprehensive product range and technical expertise Status/stability is reassuring Bureaucratic Offhand with customers No continuity of personal contacts 64
 Another Hint l As well as making SWOT customer-oriented and environmental, you need to screen out meaningless “motherhood” statements: 65
 “Motherhood” Strengths Statements Strengths Please tick appropriate boxes Hidden Meanings High quality We can’t think of any real reason why we do business in this market. . . Low price That must explain it. . . Personal service We still can’t. . . High value to ustomers c Our products are a bit expensive, but we still sell some Old-established firm We must be OK, we’ve survived so far Technologically sophisticated We know more than the customer Product strengths Look at the product, never mind the customer. The ‘natural’ supplier to this market We don’t know who our competitors are We are the industry standard We don’t think we have any competition 66
![Market Growth Rate A product portfolio chart [growth-share matrix] of a comparatively strong and](https://present5.com/presentation/14262a4855a2a8eedf43124f7729eab0/image-67.jpg "Market Growth Rate A product portfolio chart [growth-share matrix] of a comparatively strong and") Market Growth Rate A product portfolio chart [growth-share matrix] of a comparatively strong and diversified company 20% 10% 4. 0 2. 0 1. 0 0. 5 0. 25 Relative Market Share [Log Scale] © Professor Malcolm Mc. Donald, Cranfield School of Management
Market Growth Rate A product portfolio chart [growth-share matrix] of a comparatively strong and diversified company 20% 10% 4. 0 2. 0 1. 0 0. 5 0. 25 Relative Market Share [Log Scale] © Professor Malcolm Mc. Donald, Cranfield School of Management
 Market / segment selection criteria Market / segment attractiveness Low High Invest / Grow Selectively Invest Low - Size - Growth - Profitability - Competitive intensity High Maintain/ manage for sustained earnings Manage for Cash / Withdraw Business Strengths - Product Range - Product Efficacy - Service Quality (Including distribution) - Price - Associated Services (e. g. Technical advice) - Reputation / Image © Professor Malcolm Mc. Donald, Cranfield School of Management
 High Our competitive position / business strength High Directors Seminars Distance Education/ CMR // stt es ve nv d IIn uiilld u B B Market Attractiveness Exec MBA C. S. G. M. Ps Research ? MANDAS e e ag ag an an M M n n a aii n ntt a aii M M C. S. h h as as C r. C or ffo Full-Time MBA Low KEY Present position Forecast position in 3 years
 Market attractiveness evaluation Factor Scoring Criteria 10 5 0 Score Weighting Ranking 1. Market Size (£ millions) ³ £ 250 £ 51. 250 < £ 50 5 15 0. 75 2. Volume Growth (Units) ³ 10% 5. 9% < 5% 10 25 2. 5 3. Competitive Intensity Low Medium High 6 10 0. 6 4. Industry Profitability > 15% 10. 15% < 10% 8 25 2. 0 5. Vulnerability Low Medium High 3 15 0. 9 6. Cyclicality Low Medium High 2. 5 10 0. 25 Total 7. 0 This form illustrates a quantitative approach to evaluating market attractiveness. Each factor is score multiplied by the percentage weighting and totaled for the overall score. In this example, an overall score of 7 out of 10 places this mark in the highly attractive category.
 Programme guidelines suggested for different positioning on the directional policy matrix Invest for growth Maintain market position, manage for earnings Manage for cash Selective Opportunistic development Market Share Maintain or increase dominance Maintain or slightly milk for earnings Maintain selectivitysegment Forego share for profit Invest selectively in share Products Differentiation - line expansion Prune for less successful differentiate for segments Emphasise product quality Aggressively prune Differentiation - line expansion Price Lead - Aggressive pricing for share Stabilise prices / raise Maintain or raise Raise Aggressive - price for share Promotion Aggressive marketing Limit Maintain selectively Minimise Aggressive marketing Distribution Broaden distribution Hold wide distribution pattern Segment Gradually withdraw distribution Limited coverage Cost Control Tight control - go for scale economies Emphasise cost reduction viz. variable costs Tight control Aggressively reduce fixed & variable Tight - but not at expense of entrepreneurship Production Expand, invest (organic acquisition, joint venture) Maximise capacity utilisation Increase productivity e. g. specialisation Free up capacity Invest R&D Expand - invest Focus on specific projects Invest selectively None Invest Personnel Upgrade management in key functional areas Maintain, reward efficiency, tighten organisation Allocate key managers Cut back organisation Investment Fund growth Limit fixed investment Invest selectively Minimise & divest opportunistically Fund growth Working Capital Reduce in process extend credit Tighten Credit- reduce accounts receivable increase inventory turn Reduce Aggressively reduce Invest
 The Strategic Marketing Planning Process
 The ten steps of the strategic marketing planning process 1. Mission Phase One Goal Setting 2. Corporate Objectives The Strategic Plan (Output of the Planning Process) Mission Statement Financial Summary Market Overview SWOT Analysis Assumptions Marketing Objectives and Strategies 3 Year Forecast and Budgets 3. Marketing Audit 4. SWOT Analysis Phase Two Situation Review 5. Assumptions 6. Marketing Objectives and Strategies 7. Estimate Expected Results Phase Three Strategy Formulation 8. Identify Alternative Plans and Mixes 9. Budget Phase Four Resource Allocation & Monitoring 10. 1 st Year Detailed Implementation Programme © Professor Malcolm Mc. Donald, Cranfield School of Management Measurement and Review
 Summary - the marketing audit checklist External audit Internal audit Business and economic environment – economic – political/fiscal/legal – social/cultural – technological – intra company marketing operational variable The market Total market, size, growth and trends (value/volume) market characteristics, developments and trends – products – prices – physical distribution – channels – customers/consumers – communication – industry practices Competition Major competitors size market share/coverage market standing/reputation production capabilities distribution policies marketing methods extent of diversification personal issues international links profitability key strengths and weaknesses own company sales (total, by geographical location, industrial type, customer, by product) market shares profit margins/costs marketing information/research marketing mix variables as follows: – – – product management price distribution promotion operations and resources
 Criteria for a marketing plan A. Creative thinking B. Clarity – of thinking – presentation C. Completeness – Not of details – of essential elements • reiteration of basic strategy • basic plan • supporting programmes • relationships • financial impact D. Usefulness – You – Subordinates – Peers – Superiors E. Prepareable – is the product worth the effort F. Good process G. Objectivity © Professor Malcolm Mc. Donald, Cranfield School of Management
 Strategic and operational planning cycle Release plan for implementation Consolidation Start January 1 Stage 2 meetings and presentation D J F N Prepare tactical (one year) operational plans and budgets O M S A Marketing Audits M A Finalise three-year strategic marketing plans Planning team’s ‘kick-off’ meetings J J SWOT analyses, objectives, strategies, budgets(proposed) 3 years Stage 1 meetings © Professor Malcolm Mc. Donald, Cranfield School of Management
 The market understanding process Sales Mfg. IT Finance & Accounting HR The “Marketing” Director Marketing Logistics R&D Etc. Market 1 Market 2 Market 3 Market 4 Etc. © Professor Malcolm Mc. Donald, Cranfield School of Management
 IT Finance & Accounting HR Logistics The market understanding process The customer relationship management process The innovation process The Supply chain management process The knowledge management process © Professor Malcolm Mc. Donald, Cranfield School of Management R&D Etc. Creating shareholder value Mfg Creating customer value Sales Positioning & branding the organisation The value driven CEO Marketing
 Syndicate Exercise Reflecting on our discussions on marketing planning, and thinking about your own experiences in your companies, what are the key issues to be addressed to improve the effectiveness of your marketing planning activities in terms of e. g. : – – – – – management understanding and commitment concepts and approach processes tools and methodologies data IT support interfunctional integration creativity implementation measurement
 Your market audit Elements of Marketing Plan Mission Statement Financial Summary Market Overview Opportunities & Threats Strengths & Weaknesses Models, Structures, Frameworks Market Structure Market Trends Key Market Segments Gap Analysis By product By segment Overall Portfolio Summary Assumptions Marketing Objectives Marketing Strategies Resource Requirements Strategic Focus Product Mix Product Development Product Deletion Market Extension Target Customer Groups Product Price Promotion Place Market Segmentation Studies Gap Analysis Product Life Cycle Analysis Diffusion of Innovation Ansoff Matrix Forecasting Market Research Issue Management Key Success Factor Matrix Market Research Market Segmentation Studies BCG matrix Directional Policy Matrix Downside Risk Assessment Porter Matrix Ansoff Matrix BCG Matrix Directional Policy Matrix Gap Analysis Market Segmentation Studies Market Research Response Elasticities Mc. Donald Productivity Matrix Blake Mouton Matrix Forecasting Budgeting Done Score out of 10 Not Done Actions for improvement
 Appendix 1
 Strategic Marketing Planning Quality Test by Brian Smith Ph. D Student Cranfield School of Management
 A definition of one or more target market segments Effective Marketing Strategies Contain A definition of the value proposition for each segment
 And have properties of l l l l l Defining tactical activity Leveraging strengths Minimising weaknesses Enabling synergy Meeting customer needs Allowing for competitive strategy Allowing for macro-environmental trend implications Meeting our business objectives Being achievable with the resources allocated Differing significantly from competitors
 Strategy test 1 l Our marketing strategy makes it clear what markets or parts of the market we will concentrate our efforts on – If your strategy attacks all of your market sector (e. g retail groceries, super-conducting magnets) equally = 0 – If your strategy is focused by “descriptor group” (e. g. ABC 1 s, Large firms, SMEs etc. ) = 1 – If your strategy attacks needs-based segments (e. g. efficacy focused customers with high ego needs) = 2 – If you don’t know = -1
 Strategy test 2 l Our marketing strategy makes clear what actions fit with the marketing strategy and what does not – If your strategy allows complete freedom of action = 0 – If your strategy allows a high degree of freedom of action = 1 – If your strategy makes most of your action plan decisions for you = 2 – If you don’t know = -1
 Strategy test 3 l Our marketing strategy clearly defines our intended competitive advantage in the target market segments – If there is no strong and supported reason why the customer should choose you = 0 – If there is a reason the customer should buy you but no strong proof = 1 – If you can state clearly the reason the customer should buy you and not the competitor and substantiate that reason = 2 – If you don’t know = -1
 Strategy test 4 l Our marketing strategy allows synergy between the activities of the different parts of the organisation – If the strategy is a compromise of what each department is capable of = 0 – If the strategy uses the strengths of only one or two departments = 1 – If the strategy uses the best strengths of all departments = 2 – If you don’t know = -1
 Strategy test 5 l Our marketing strategy is significantly different from that of our competitors in our key market segments – If we attack the same customers with the same value proposition = 0 – If we attack the same customers OR use a the same value proposition =1 – If we attack different customers with a different value proposition = 2 – If you don’t know = -1
 Strategy test 6 l Our marketing strategy recognises and makes full allowance for the needs and wants of our target customers – If you only meet the basic functional needs (safety, regulation, efficacy) =0 – If you also meet the higher functional needs (efficiency, service, price) = 1 – If you also meet the emotional and ego needs (brand, confidence) = 2 – If you don’t know = -1
 Strategy test 7 l Our marketing strategy recognises and makes full allowance for the strategies of our competitors – If you are ignoring the competitors’ strategy = 0 – If you are allowing for some of the competitors’ strategy = 1 – If you are allowing for all of the competitors’ strategy = 2 – If you don’t know = -1
 Strategy test 8 l Our marketing strategy recognises and makes full allowance for changes in the business environment that are beyond our control, such as technological, legislation or social change – If your strategy is designed for today’s conditions =1 – If your strategy allows for one or two changes (e. g technology or demographics) = 1 – If your strategy considers the combined effects of all the external factors = 2 – If you don’t know = -1
 Strategy test 9 l Our marketing strategy either avoids or compensates for those areas where we are relatively weak compared to the competition – If you have taken little or no account of your relative weaknesses = 0 – If you are trying to fix your relative weaknesses = 1 – If your strategy means that your relative weaknesses don’t matter = 2 – If you don’t know = -1
 Strategy test 10 l Our marketing strategy makes full use of those areas where we are relatively strong compared to the competition – If you have taken little or no account of your relative strengths = 0 – If you are trying to use your relative strengths = 1 – If your strategy means that your relative strengths become more important = 2 – If you don’t know = -1
 Strategy test 11 l Our marketing strategy, if successfully implemented, will meet all the objectives of the organisation – If your strategy, fully & successfully implemented, does not deliver your financial or non-financial objectives = 0 – If your strategy, fully & successfully implemented, delivers only your financial objectives = 1 – If your strategy, fully & successfully implemented, delivers your financial & non-financial objectives = 2 – If you don’t know = -1
 Strategy test 12 l The resources available to the organisation are sufficient to implement the marketing strategy successfully – If you have neither the tangible nor the intangible resources to implement the strategy = 0 – If you have only the tangible or the intangible resources, but not both = 1 – If you have both the tangible and the intangible resources need to to implement the strategy = 2 – If you don’t know = -1
") How did you score? l 18 -24 - Well done! (are you sure? ) – Can I buy some shares? l 12 -17 - You will succeed – If your competition is weak! l 6 -11 - You will survive – If your competition is weak! l Less than 6 – Oh dear, it was nice knowing you
How did you score? l 18 -24 - Well done! (are you sure? ) – Can I buy some shares? l 12 -17 - You will succeed – If your competition is weak! l 6 -11 - You will survive – If your competition is weak! l Less than 6 – Oh dear, it was nice knowing you
 Appendix 2