79fc879cbcc99224a6563fe227657e2f.ppt
- Количество слайдов: 18


The role of carbon sequestration in reducing atmospheric CO 2 Alicia Evans-Imbert

Overview Article reviewed by L. D. Danny Harvey, 2004 titled: Declining temporal effectiveness of carbon sequestration: implications for compliance with the United National Framework Convention on Climate Change l CO 2 emissions continue to increase along with the need to curb its effect, so many have looked in the possible aid of carbon sequestration l Article: ¡ Determines least damaging range of CO 2 concentrations ¡ Calculates possible future emission levels ¡ Tracks likely temperature changes ¡ Evaluates sequestration levels ¡ Overall determines long-term effects of sequestration as a source of negative emissions l

Sequestration l Natural carbon sinks cannot stop rise in CO 2, sequestration could stabilize atmospheric CO 2 concentrations l Carbon sequestration involves isolating carbon from other combustion products of fuel or biomass, then compressing and transporting, finally injecting into the site l Best to use large centralized facilities that capture and transport carbon but limits capture to 1/3 of emissions l Capturing CO 2 takes 10% increase in fuel use by these power plants to have les than 90% capture l Possible to capture CO 2 with less energy from production of hydrogen through gasification of coals or biomass

Sequestration Sites l Sites of sequestration: depleted or existing oil and gas fields, deep aquifers (uncertain of storage in aquifers without leakage), coal beds, and deep ocean ( 3000 m) l Ocean can hold thousands of Gt. C of CO 2, only 85% will remain l Reliance on deep oceans for storage leads to increase in CO 2 in atmosphere and changes in ocean chemistry over thousands of years l Sequestration in terrestrial aquifers and oil or gas fields may be limited to 300 Gt. C, although would have long term leakage l However sequestration could still be a partial substitute for fossil fuel reductions

Site storage potential Table I Estimates of the global carbon sequestration potential, excluding deep ocean disposal. Based on summaries presented in Parson and Keith (1998) and Williams et al. (2000). Reservoir Aquifers, if structural traps are needed Aquifers, if structural traps are not needed Enhanced oil recovery Depleted oil fields Depleted gas fields Deep coal beds Minimum total about Storage Potential (Gt. C) 50 2700– 13000 20 40– 100 90– 400 100– 300

UNFCCC l UNFCCC is a document signed and ratified by 182 countries l They agree that CO 2 concentrations should stay at a level to avoid “dangerous anthropogenic interference with the climate system” as of 1992 l Change should not be too large so that ecosystems can be allowed to adapt l The production of food should not be threatened l Economic development should occur in sustainable manner l Author suggest that the document makes indirect value judgments that deem ecosystems valuable without economic value to humans

CO 2 Concentration Range l Range depends on: ¡ increase in non-CO 2 Green House Gases (GHG) ¡ relationship of concentrations and time-dependent climatic change ¡ relationship between climatic change and a range of key impacts l Refers to Third Assessment Report of Intergovernmental Panel on Climate Change (IPCC) for discussion of CO 2 range issues l Concludes compliance range for UNFCCC should be 350 -450 ppmv l CO 2 near 450 ppmv negative effects on marine productivity l 450 ppmv associated with 0. 2 decrease in ocean p. H, and decrease of surface Ca. CO 3 saturation by 25%

Temperature Range l Likely temperature changes based on range: 2 -4°C based on models and past changes but cannot rule what larger variance of 1 -5°C l With CO 2 doubling minimum warming is 1°C, If things stay the same then likely more then 1°C change l Double CO 2 climate shows 10 -20% decrease in agricultural yields l Even slight differences in temperature increase can be significant ¡ estimates show a dramatic increase of people at risk of hunger, water shortage, malaria and flooding when change 2°C as compared to 1°C l 4°C warming causes: melting of Greenland ice sheet, collapse of artic sheet, 10 m sea level rise in 1000 years, and damaging forest ecosystems

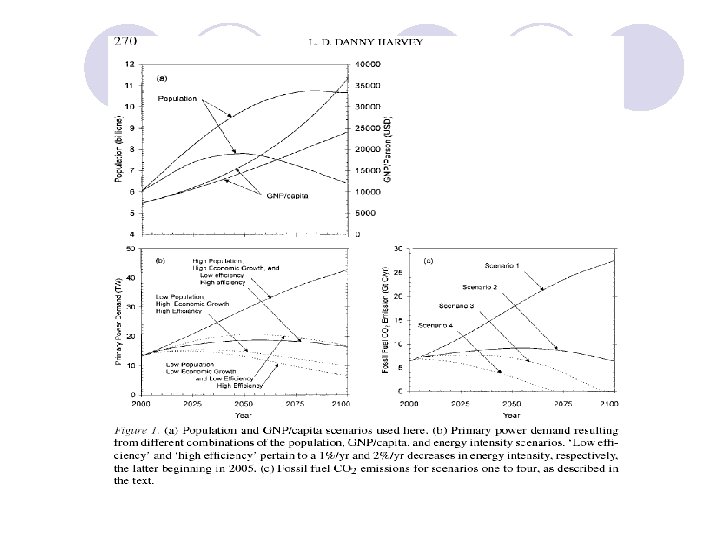
Scenario Conditions Scenario 1 Scenario 2 Scenario 3 Scenario 4 Scenario 5 High population Low population N/A High GDP growth Low GDP growth N/A 1%/yr energy 2%/yr energy intensity decline 0. 5%/yr growth of carbon-free power 2%/yr growth of carbon-free power N/A
 ¡ economic output (dollars) person")
Emission Scenarios l Emissions based on: ¡ population (P) ¡ economic output (dollars) person ($/P) ¡ average primary energy consumption (joules) per dollar of economic output (J/S) ¡ average CO 2 emission per joule of primary energy consumption (E/J) l Emission = P x ($/P) x (J/S) x (E/J) l l l Scenario 1: CO 2 6. 5 Gt. C/yr in 2000 10 27 Gt. C/yr 2100 Scenario 2: CO 2 peak 9 Gt. C/yr in 2060 then decline to 7 Gt. C/yr by 2100 Scenario 3: CO 2 peak 7. 7 Gt. C/yr in 2030 then decline to 0 Gt. C by 2100 Scenario 4: CO 2 decline from 6. 9 Gt. C/yr in 2005 then decline to 0 by 2075 Scenario 5: N/A

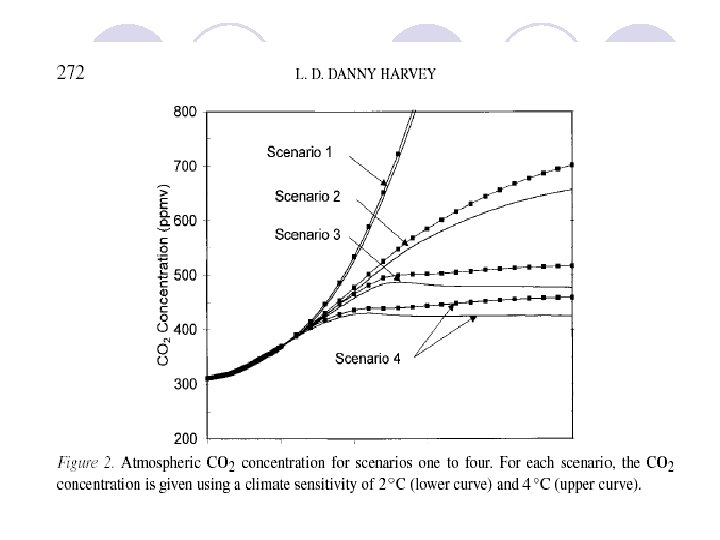
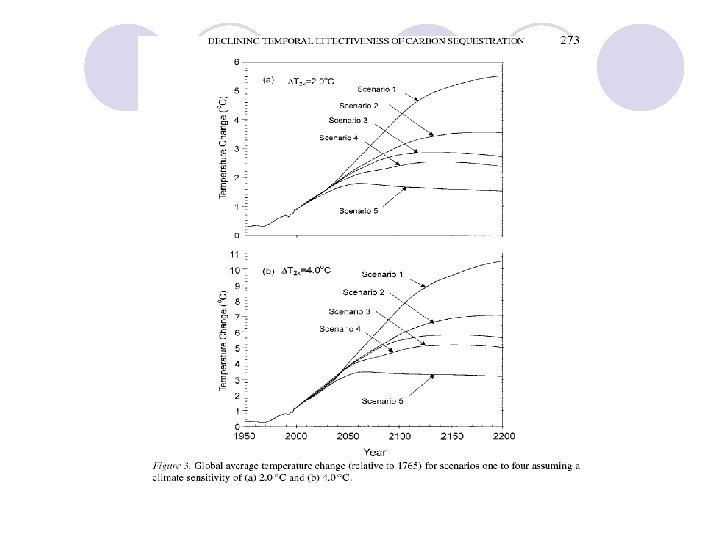
Temperature & CO 2 Scenarios l Climate model used to translate emissions to CO 2 then temperature change, because amount of CO 2 sequestration depends on climate sensitivity; higher sensitivity lead to larger warming l CO 2 scenarios: concentration by year 2200 ¡ 1. 1395 -1460 ppmv ¡ 2. 660 -700 ppmv ¡ 3. 480 -520 ppmv ¡ 4. 425 -450 ppmv ¡ 5. 428 -435 ppmv l Temperature scenarios: sensitivity ∆T=2. 0°C and ∆T=4. 0°C ¡ 1. peaks ~ 5. 5 and 10. 5°C ¡ 2. peaks ~ 3. 5 and 7. 1°C ¡ 3. peaks ~ 2. 8 and 5. 9°C ¡ 4. peaks ~ 2. 5 and 5. 1°C ¡ 5. peaks ~ 1. 8 and 3. 2°C

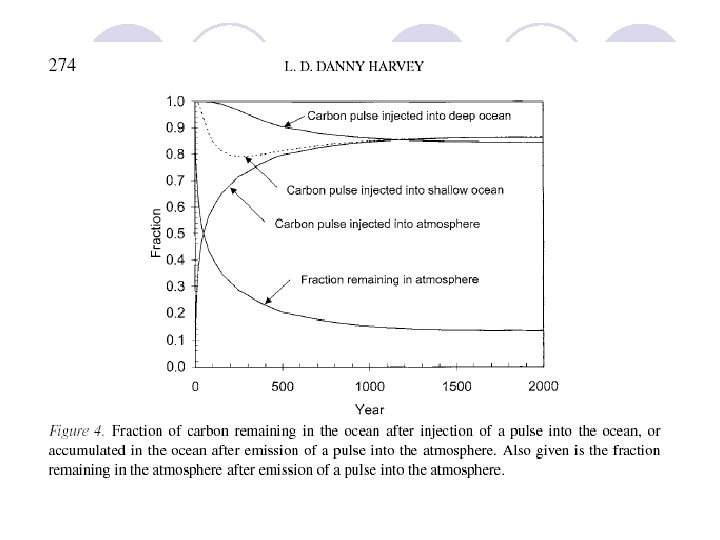
Potential Sequestration l l l l An impulse response is the reaction to sudden injection of CO 2 into the atmosphere and the ocean Injection into atmosphere, after 200 yrs 70% is taken up by ocean and in 2000 yrs 87% Injection in ocean, same proportions as atmosphere injection due to carbon escaping into atmosphere When sequestration of 100 Gt. C over 100 yrs in terrestrial or ocean, CO 2 reduced by 10 ppmv (20 Gt. C) or possible max of 23 ppmv (46 Gt. C) To stabilize 350 ppmv, 1 Gt. C/yr geological seq. for 200 yrs & 1 Gt. C in ocean for 100 yrs; higher temp sensitivity then increase to 2 Gt. C/yr geological If CO 2 allowed to reach a peak of 517 ppmv (or 356 Gt. C above optimum) then need to seq. 600 Gt. C over 200 yrs to reduce to 368 ppmv In order to sequester CO 2 needs to be captured, the levels needed to keep sequestration rates up and CO 2 concentrations down might not be achieved

Concerns l Local effects of injections on biota of concern l Large amounts of ocean sequestration not good for environment l Not clear if sequestration rate maintained after fuels phased out l Benefits of seq. rapidly reduce over time even without leakage l Necessary sequestration might require geological formations to be used to capacity (~300 Gt. C) and oceans to 100 -200 Gt. C even with aggressive emissions reductions l Additional sequestration could be possible in soils; a possible 5. 7 Gt. C to 8. 7 Gt. C

Conclusions l l l Impacts of change are unknown, it is believed that beyond 450 ppmv there are serious threats; upper limit of 450 ppmv is sound Believes UNFCCC should develop framework to stabilize CO 2 at less than 450 ppmv Reduction in fossil fuel use (~0 during century) and seq. of 1 -2 Gt. C/yr for the next century to have “option” of peaking no more then double CO 2 climate Sequestering the same as not releasing at all; emission reductions necessary Sequestration and fossil fuel reduction together best option Although no possible way of avoiding warming, avoiding sea level rise, changes in oceanic circulation and a quicker recovery if temperature increase is short are all possible.
79fc879cbcc99224a6563fe227657e2f.ppt