5d17f2304c194d7ceff614e56dbdb431.ppt
- Количество слайдов: 134


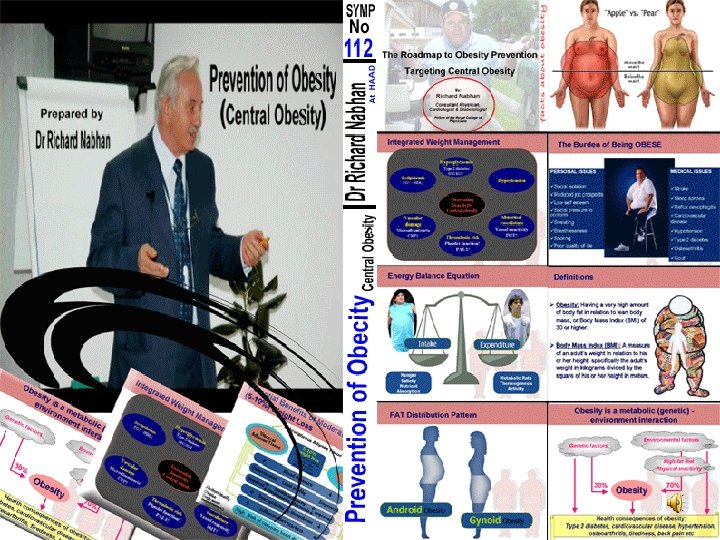

The Roadmap to Obesity Prevention Targeting Central Obesity By: Richard Nabhan Consultant Physician, Cardiologist & Diabetologist Fellow of the Royal College of Physicians

Definitions Ø Obesity: Having a very high amount of body fat in relation to lean body mass, or Body Mass Index (BMI) of 30 or higher. Ø Body Mass Index (BMI): A measure of an adult’s weight in relation to his or height, specifically the adult’s weight in kilograms divided by the square of his or height in meters.

Classification of Overweight & Obesity by BMI

W. H. O. Report on Obesity “Evidence is now emerging to suggest that the prevalence of overweight and obesity is increasing at an alarming rate. Both developed and developing countries are affected. ” “Indeed, overweight and obesity are now so common that they are replacing the more traditional public health concerns such as under-nutrition and infectious diseases as some of the most significant contributors to ill health. ” Obesity: Managing and preventing the global epidemic. Report of a WHO consultation on Obesity. 3 -5 June 1997

Prevalence PREVALENCE OF OBESITY HAS INCREASED BY MORE THAN 75% SINCE 1980 1 in 4 adults are obese in the US 1 in 5 adults are obese in the UK 320 million people worldwide are obese 750 million are overweight in the world In the UAE 74% of adults are overweight or obese

Obesity Trends* Among U. S. Adults BRFSS, 1990, 1998, 2007 (*BMI 30, or about 30 lbs. overweight for 5’ 4” person) 1998 1990 2007 No Data <10% 10%– 14% 29% ≥ 30% 15%– 19% 20%– 24% 25%–

Obesity Trends* Among U. S. Adults BRFSS, 1985 (*BMI ≥ 30, or ~ 30 lbs. overweight for 5’ 4” person) No Data <10% 10%– 14%

Obesity Trends* Among U. S. Adults BRFSS, 1986 (*BMI ≥ 30, or ~ 30 lbs. overweight for 5’ 4” person) No Data <10% 10%– 14%

Obesity Trends* Among U. S. Adults BRFSS, 1987 (*BMI ≥ 30, or ~ 30 lbs. overweight for 5’ 4” person) No Data <10% 10%– 14%

Obesity Trends* Among U. S. Adults BRFSS, 1988 (*BMI ≥ 30, or ~ 30 lbs. overweight for 5’ 4” person) No Data <10% 10%– 14%

Obesity Trends* Among U. S. Adults BRFSS, 1989 (*BMI ≥ 30, or ~ 30 lbs. overweight for 5’ 4” person) No Data <10% 10%– 14%

Obesity Trends* Among U. S. Adults BRFSS, 1990 (*BMI ≥ 30, or ~ 30 lbs. overweight for 5’ 4” person) No Data <10% 10%– 14%

Obesity Trends* Among U. S. Adults BRFSS, 1991 (*BMI ≥ 30, or ~ 30 lbs. overweight for 5’ 4” person) No Data <10% 10%– 14% 15%– 19%

Obesity Trends* Among U. S. Adults BRFSS, 1992 (*BMI ≥ 30, or ~ 30 lbs. overweight for 5’ 4” person) No Data <10% 10%– 14% 15%– 19%

Obesity Trends* Among U. S. Adults BRFSS, 1993 (*BMI ≥ 30, or ~ 30 lbs. overweight for 5’ 4” person) No Data <10% 10%– 14% 15%– 19%

Obesity Trends* Among U. S. Adults BRFSS, 1994 (*BMI ≥ 30, or ~ 30 lbs. overweight for 5’ 4” person) No Data <10% 10%– 14% 15%– 19%

Obesity Trends* Among U. S. Adults BRFSS, 1995 (*BMI ≥ 30, or ~ 30 lbs. overweight for 5’ 4” person) No Data <10% 10%– 14% 15%– 19%

Obesity Trends* Among U. S. Adults BRFSS, 1996 (*BMI ≥ 30, or ~ 30 lbs. overweight for 5’ 4” person) No Data <10% 10%– 14% 15%– 19%

Obesity Trends* Among U. S. Adults BRFSS, 1997 (*BMI ≥ 30, or ~ 30 lbs. overweight for 5’ 4” person) No Data <10% 10%– 14% 15%– 19% ≥ 20%

Obesity Trends* Among U. S. Adults BRFSS, 1998 (*BMI ≥ 30, or ~ 30 lbs. overweight for 5’ 4” person) No Data <10% 10%– 14% 15%– 19% ≥ 20%

Obesity Trends* Among U. S. Adults BRFSS, 1999 (*BMI ≥ 30, or ~ 30 lbs. overweight for 5’ 4” person) No Data <10% 10%– 14% 15%– 19% ≥ 20%

Obesity Trends* Among U. S. Adults BRFSS, 2000 (*BMI ≥ 30, or ~ 30 lbs. overweight for 5’ 4” person) No Data <10% 10%– 14% 15%– 19% ≥ 20%

Obesity Trends* Among U. S. Adults BRFSS, 2001 (*BMI ≥ 30, or ~ 30 lbs. overweight for 5’ 4” person) No Data <10% 10%– 14% 15%– 19% 20%– 24% ≥ 25%

Obesity Trends* Among U. S. Adults BRFSS, 2002 (*BMI ≥ 30, or ~ 30 lbs. overweight for 5’ 4” person) No Data <10% 10%– 14% 15%– 19% 20%– 24% ≥ 25%

Obesity Trends* Among U. S. Adults BRFSS, 2003 (*BMI ≥ 30, or ~ 30 lbs. overweight for 5’ 4” person) No Data <10% 10%– 14% 15%– 19% 20%– 24% ≥ 25%

Obesity Trends* Among U. S. Adults BRFSS, 2004 (*BMI ≥ 30, or ~ 30 lbs. overweight for 5’ 4” person) No Data <10% 10%– 14% 15%– 19% 20%– 24% ≥ 25%

Obesity Trends* Among U. S. Adults BRFSS, 2005 (*BMI ≥ 30, or ~ 30 lbs. overweight for 5’ 4” person) No Data <10% 10%– 14% 29% ≥ 30% 15%– 19% 20%– 24% 25%–

Obesity Trends* Among U. S. Adults BRFSS, 2006 (*BMI ≥ 30, or ~ 30 lbs. overweight for 5’ 4” person) No Data <10% 10%– 14% 29% ≥ 30% 15%– 19% 20%– 24% 25%–

Obesity Trends* Among U. S. Adults BRFSS, 2007 (*BMI ≥ 30, or ~ 30 lbs. overweight for 5’ 4” person) No Data <10% 10%– 14% 29% ≥ 30% 15%– 19% 20%– 24% 25%–
 - environment interaction Genetic factors Environmental factors High fat")
Obesity is a metabolic (genetic) - environment interaction Genetic factors Environmental factors High fat diet Physical inactivity 30% Obesity 70% Health consequences of obesity: Type 2 diabetes, cardiovascular disease, hypertension, osteoarthritis, tiredness, back pain etc

Obesity: a Chronic Disease • Chronic = lifelong treatment required Similar to hypertension, diabetes, asthma • Treatment controls, does not cure, disease • No short-term solutions: need for lifelong management • Disease recurs after treatment is withdrawn 2 not due to patient or treatment failure 1. Atkinson. Ann Intern Med. 1993; 119: 677 -680 2. Bray. Ann Intern Med. 1993; 119: 707 -713
 • Waist Circumference • Waist to")
Measures Of Obesity • Body Mass Index (BMI) • Waist Circumference • Waist to Hip ratio • Skin fold thickness • Scans CT/MRI
/Ht m 2 30 Obese Overweight 25 Normal 18.")
Body Mass Index - Wt (kg)/Ht m 2 30 Obese Overweight 25 Normal 18. 5 Under weight

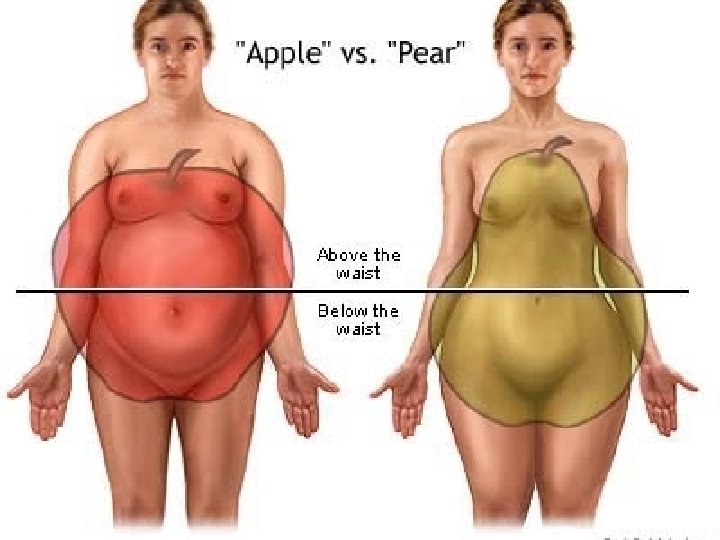
FAT Distribution Pattern Android Obesity Gynoid Obesity

Integrated Weight Management Hyperglycaemia Dyslipidaemia TG↑ – HDL↓ Type 2 diabetes IFG/IGT Weight maintenance Hypertension Overeating Inactivity Central obesity Vascular Diet damage Microalbuminuria CRP↑ Exercise Lifestyle Thrombotic risk Platelet function↑ PAI-1↑ Drugs Abnormal vasculature Vessel reactivity IMT↑

The contribution of obesity to different diseases • Type 2 Diabetes 61% • Hypertension 17% • Coronary Heart Disease 17% • Osteoarthritis 24% • Endometrial cancer 34% • Gall bladder disease 30% • Colon cancer 11%

The Burden of Being OBESE PERSONAL ISSUES MEDICAL ISSUES üSocial isolation üStroke üReduced job prospects üLow self esteem üSocial pressure to conform üSleep apnoea üReflux oesophagitis üSweating üCardiovascular disease üBreathlessness üHypertension üSnoring üType 2 diabetes üPoor quality of life üOsteoarthritis üGout

WORDS OF WISDOM Sudden death is more common in those who are naturally fat than in the slender Hippocrates 410 B. C.
 Weight Loss Subcutaneous Adipose Tissue 5 -10% weight")
Potential Benefits of Moderate (5 -10%) Weight Loss Subcutaneous Adipose Tissue 5 -10% weight loss Visceral Adipose Tissue ~30% Visceral adipose tissue loss (diet, physical activity, pharmacotherapy) Blood Pressure Deteriorated Impaired Lipid profile Improved Insulin sensitivity Improved Insulinaemia, Glycaemia Abdominally Obese (high waist measurement) Susceptibility to thrombosis Inflammation markers High Risk of coronary heart disease Low Reduced Obesity (low waist measurement)

Benefits of Sustained Moderate Weight Loss in Patients With Hypertension • Each kg of weight loss lowers blood pressure by 2. 5 mm. Hg (systolic) and 1. 7 mm. Hg (diastolic) • Antihypertensive medications reduced or discontinued in many patients with moderate weight loss

Benefits of moderate weight loss in patients with type 2 Diabetes Ø Increased life expectancy ü 1 kg weight loss increased survival by 3 to 4 months ü A 10 kg weight loss could restore 35% of the reduction in life expectancy Ø Improved glycaemic control ü Weight loss of > 6. 9 kg or > 5% of baseline body weight improved glucose and Hb. A 1 ü Weight loss predicted fasting blood glucose

Benefits Of Moderate Weight Loss: Serum Lipid Profile A loss of 10 lb (4. 5 kg) is associated with: ê 16% total cholesterol ê 12% LDL cholesterol é 18% HDL cholesterol

Weight Loss is Rewarded ü Your patient feels a lot better ü Looks better and his/her self esteem grows ü Has more energy, feels fitter and doesn’t perspire at the slightest effort ü Being active becomes more fun ü Quality of life improves
. • Reduce body weight. •")
Treatment Goals • Prevent further weight gain (minimum goal). • Reduce body weight. • Maintain lower body weight in the long term. Arch Intern Med 1998; 158: 1855 -67

Energy Balance Equation Intake Hunger Satiety Nutrient Absorption Expenditure Metabolic Rate Thermogenesis Activity

What is the Target Weight ? Normalisation of Weight - Mostly Unrealistic Practical Solution is 5 -10 % weight reduction

Dieting

Truth about fat intake Fat intake reduction alone does not work on the long term: Americans eat 17. 5% less fat than they did 20 years ago, OBESITY has still increased 25%

One Burger is Enough for a Day • A quarter-pound cheeseburger, large fries, and a 16 oz. soda provides • 1, 166 calories • 51 g fat • 95 mg cholesterol • 1, 450 mg sodium

Develop Plan For Increased Energy Expenditure All Physical Activity Counts • Make opportunities to increase physical activity – Walk whenever possible – Take the stairs – Undertake household chores, such as cleaning and gardening • Effects are cumulative • There is no threshold of activity necessary for a benefit

Lifestyle Modifications • Self Monitoring - keep food and physical activity diary • Stimulus control - keep food out of sight - eat in one place - shop for food when not hungry • Cognitive Restructuring - focus on well being - recognise difficulty of losing weight - medical not cosmetic weight loss - set realistic dieting goal

Portion Distortion Do You Know How Food Portions Have Changed in 20 Years?

Portion Distortion BAGEL 20 Years Ago 140 calories 3 -inch diameter Today How many calories are in this bagel?

Portion Distortion BAGEL 20 Years Ago 140 calories 3 -inch diameter Today 350 calories 6 -inch diameter Calorie Difference: 210 calories

Portion Distortion Maintaining a Healthy Weight is a Balancing Act Calories In = Calories Out How long will you have to rake leaves in order to burn the extra 210 calories? * *Based on 130 -pound person

Portion Distortion Calories In = Calories Out If you rake the leaves for 50 minutes you will burn the extra 210 calories. * *Based on 130 -pound person

Portion Distortion CHEESEBURGER 20 Years Ago 333 calories Today How many calories are in today’s cheeseburger?

Portion Distortion CHEESEBURGER 20 Years Ago 333 calories Today 590 calories Calorie Difference: 257 calories

Portion Distortion Maintaining a Healthy Weight is a Balancing Act Calories In = Calories Out How long will you have to lift weights in order to burn the extra 257 calories? * *Based on 130 -pound person

Portion Distortion Calories In = Calories Out If you lift weights for 1 hour and 30 minutes, you will burn approximately 257 calories. * *Based on 130 -pound person

Portion Distortion SPAGHETTI & MEATBALLS 20 Years Ago 500 calories 1 cup spaghetti with sauce and 3 small meatballs Today How many calories do you think are in today's portion of spaghetti and meatballs?

Portion Distortion SPAGHETTI & MEATBALLS 20 Years Ago 500 calories 1 cup spaghetti with sauce and 3 small meatballs Today 1, 025 calories 2 cups of pasta with sauce and 3 large meatballs Calorie Difference: 525 calories

Portion Distortion Maintaining a Healthy Weight is a Balancing Act Calories In = Calories Out How long will you have to houseclean in order to burn the extra 525 calories? * *Based on 130 -pound person

Portion Distortion Calories In = Calories Out If you houseclean for 2 hours and 35 minutes, you will burn approximately 525 calories. * *Based on 130 -pound person

Portion Distortion FRENCH FRIES 20 Years Ago 210 Calories 2. 4 ounces Today How many calories are in today’s portion of fries?

Portion Distortion FRENCH FRIES 20 Years Ago 210 Calories 2. 4 ounces Today 610 Calories 6. 9 ounces Calorie Difference: 400 Calories

Portion Distortion Maintaining a Healthy Weight is a Balancing Act Calories In = Calories Out How long will you have to walk leisurely in order to burn those extra 400 calories? * *Based on 160 -pound person

Portion Distortion Calories In = Calories Out If you walk leisurely for 1 hour and 10 minutes you will burn approximately 400 calories. * *Based on 160 -pound person

Incidence of New Cases per 1, 000 Person-Years Obesity and Diabetes Risk BMI Levels

Weight Gain and Diabetes Risk Relative Risk Weight Change Since Age 21 Body Mass Index at Age 21

Incidence/1, 000 26 -Year Incidence of Coronary Heart Disease in Men BMI Levels

Incidence/1, 000 26 -Year Incidence of Coronary Heart Disease in Women BMI Levels

Relationship of BMI to Excess Mortality 300 Mortality Ratio 250 Age at Issue 20 -29 30 -39 200 150 100 Low Risk 50 0 15 20 25 30 Moderate Risk 35 High Risk 40 Body Mass Index (kg/[m 2])

Hypertension 60 Percentage 50 40 30 20 10 20 25 30 35 40 BMI Relationship between BMI and crude percentage of women reporting medical problems, surgical procedures, symptoms, and health care utilization.

Diabetes Percentage 15 10 5 0 20 25 30 35 40 BMI Relationship between BMI and crude percentage of women reporting medical problems, surgical procedures, symptoms, and health care utilization.

Cholescystectomy Percentage 25 20 15 10 5 20 25 30 35 40 BMI Relationship between BMI and crude percentage of women reporting medical problems, surgical procedures, symptoms, and health care utilization.

Hysterectomy 40 Percentage 35 30 25 20 15 20 25 30 35 40 BMI Relationship between BMI and crude percentage of women reporting medical problems, surgical procedures, symptoms, and health care utilization.

Back Pain Percentage 35 30 25 20 15 20 25 30 35 40 BMI Relationship between BMI and crude percentage of women reporting medical problems, surgical procedures, symptoms, and health care utilization.

Constant Tiredness Percentage 35 30 25 20 15 20 25 30 35 40 BMI Relationship between BMI and crude percentage of women reporting medical problems, surgical procedures, symptoms, and health care utilization.

Care of Overweight/Obese Patients Requires two steps: • Assessment • Management

Health Benefits of Weight Loss ü Decreased cardiovascular risk ü Decreased glucose and insulin levels ü Decreased blood pressure ü Decreased LDL and triglycerides, increased HDL ü Decreased severity of sleep apnea ü Reduced symptoms of degenerative joint disease ü Improved gynecological conditions
/height (m 2)")
Assessment of Overweight and Obesity • Body Mass Index – Weight (kg)/height (m 2) – Weight (lb)/height (in 2) x 703 – Table • Waist Circumference – High risk: • Men >102 cm (40 in. ) • Women >88 cm (35 in. )

Determine Absolute Risk Status Evaluate: • Disease conditions (e. g. , CHD, type 2 diabetes, sleep apnea) (+ = very high risk) • Other obesity-associated diseases (e. g. , gynecological abnormalities, osteoarthritis) • Cardiovascular risk factors: smoking, hypertension, high LDL, low HDL, IGT, family hx (>3 = high risk) • Other risk factors: – Physical inactivity – High serum triglycerides (>200 mg/d. L)
. • Reduce body")
Goals of Weight Management/Treatment • Prevent further weight gain (minimum goal). • Reduce body weight. • Maintain a lower body weight over long term.

Target Weight: Realistic Goals Ø Substitute “healthier weight” for ideal or landmark weight. Ø Accept slow, incremental progress to goal. • Short-term goal: 5 to 10 percent loss, 1 to 2 lb per week. • Interim goal: Maintenance. • Long-term goal: Additional weight loss, if desired, and long-term weight maintenance.

Weight Loss Goal: Decrease body weight by 10 percent from baseline. Ø If goal is achieved, further weight loss can be attempted if indicated. Ø Reasonable timeline: 6 months of therapy. • Moderate caloric deficits • Weight loss 1 to 2 lb/week

Weight Loss Goals Ø Start weight maintenance efforts after 6 months. • May need to be continued indefinitely. Ø If unable to lose weight, prevent further weight gain.

Strategies for Weight Loss & Maintenance Ø Dietary therapy Ø Physical activity Ø Behavior therapy Ø “Combined” therapy Ø Pharmacotherapy Ø Weight loss surgery

Weight Loss Therapy Ø Whenever possible, weight loss therapy should employ the combination of Ø Low-calorie/low-fat diets Ø Increased physical activity Ø Behavior modification
 Low-calorie diets (LCD) are recommended for weight loss in")
Dietary Therapy (1 of 5) Low-calorie diets (LCD) are recommended for weight loss in overweight and obese persons. Reducing fat as part of an LCD is a practical way to reduce calories.
 Low-calorie diets can reduce total body weight by an")
Dietary Therapy (2 of 5) Low-calorie diets can reduce total body weight by an average of 8 percent and help reduce abdominal fat content over a period of 6 months.
 Although lower fat diets without targeted calorie reduction help")
Dietary Therapy (3 of 5) Although lower fat diets without targeted calorie reduction help promote weight loss by producing a reduced calorie intake, lower fat diets coupled with total calorie reduction produce greater weight loss than lower fat diets alone.
 Very low-calorie diets produce greater initial weight loss than")
Dietary Therapy (4 of 5) Very low-calorie diets produce greater initial weight loss than low-calorie diets. However, long-term (>1 year) weight loss is not different from an LCD.
 Very Low-Calorie Diets (less than 800 kcal/day) ü Rapid")
Dietary Therapy (5 of 5) Very Low-Calorie Diets (less than 800 kcal/day) ü Rapid weight loss ü Deficits are too great ü Nutritional inadequacies ü Greater weight regain ü No change in behavior ü Greater risk of gallstones
 Nutrient Recommended Intake Protein ~ 15 percent of total")
Low-Calorie Step I Diet (continued) Nutrient Recommended Intake Protein ~ 15 percent of total calories Carbohydrate 55 percent or more of total calories Sodium Chloride No more than 100 mmol/day (~ 2. 4 g of sodium or ~ 6 g of sodium chloride) Calcium 1, 000 to 1, 500 mg Fiber 20 to 30 g
 Calories : A reduction in calories of 500 to")
Low-Calorie Step I Diet (continued) Calories : A reduction in calories of 500 to 1, 000 kcal/day will help achieve a weight loss of 1 to 2 lbs/week. Alcohol : provides unneeded calories and displaces nutritious foods. The impact of alcohol calories on a person’s overall calorie intake needs to be assessed and appropriately controlled.
 Total Fat : Fat-modified foods may provide a helpful")
Low-Calorie Step I Diet (continued) Total Fat : Fat-modified foods may provide a helpful strategy for lowering total fat intake, but are effective only if Low in calories No compensation of calories from other foods.
 Saturated Fatty Acids and Cholesterol Patients with high blood")
Low-Calorie Step I Diet (continued) Saturated Fatty Acids and Cholesterol Patients with high blood cholesterol levels May need to use the Step II diet to achieve further reductions in LDL-cholesterol levels; In the Step II diet, reduce saturated fats to less than 7 percent of total calories and cholesterol levels to less than 200 mg/day. All other nutrients are the same as in Step I.
 Protein should be derived from • Plant sources •")
Low-Calorie Step I Diet (continued) Protein should be derived from • Plant sources • Lean sources of animal protein
 Carbohydrate and Fiber Complex carbohydrates from different vegetables, fruits,")
Low-Calorie Step I Diet (continued) Carbohydrate and Fiber Complex carbohydrates from different vegetables, fruits, and whole grains are good sources of vitamins, minerals, and fiber. A diet high in all types of fiber may aid in weight management by promoting satiety at lower levels of calorie and fat intake. Some authorities recommend 20 to 30 grams of fiber daily, with an upper limit of 35 grams.
 Calcium • weight loss, attention should be given to")
Low-Calorie Step I Diet (continued) Calcium • weight loss, attention should be given to maintaining an adequate intake of vitamins and minerals. • Maintenance of the recommended calcium intakes of 1, 000 to 1, 500 mg/day is specially important for women who may be at risk of osteoporosis.

Healthy Eating Starts With Healthy Food Shopping Tips • • • Reduce the time you spend cooking healthy by using a shopping list and keeping a well-stocked kitchen. Read labels as you shop and pay attention to serving size and servings per container. Compare the total calories in similar products and choose products with the lowest calories.

Healthy Eating Starts With Healthy Food Shopping Tips • Fat free or lowfat milk, yogurt, cheese, and cottage cheese • Light or diet margarine • Eggs/egg substitute

Healthy Eating Starts With Healthy Food Shopping Tips • Sandwich breads, bagels, pita bread, English muffins • Soft corn tortillas, low fat flour tortillas • Low fat, low sodium crackers • Plain cereal, dry or cooked • Rice, pasta

Healthy Eating Starts With Healthy Food Shopping Tips • White meat chicken or turkey (remove skin) • Fish and shellfish (no batter) • Beef: round, sirloin, chuck arm, loin, and extra-lean ground beef • Pork: leg, shoulder, tenderloin • Dry beans and peas

Healthy Eating Starts With Healthy Food Shopping Tips • Fresh, frozen, canned fruits in light syrup or juice • Fresh, frozen, or no-salt-added canned vegetables • Low fat or nonfat salad dressings • Mustard and catsup • Jam, jelly, or honey • Herbs and spices • Salsa

Eating Healthy When Dining Out • Whether or not you’re trying to lose weight, you can eat healthy when dining out, if you know how. • You can treat yourself to a dining experience that is both tasty and good for you. • Two useful tips to follow are Ask! and Act!
 Ask! Will the restaurant… • Not serve butter,")
Eating Healthy When Dining Out (continued) Ask! Will the restaurant… • Not serve butter, margarine, or olive oil with bread? • Serve fat free (skim) milk rather than whole milk or cream? • Trim visible fat from poultry or meat? • Leave all butter, gravy, or sauces off a dish? • Accommodate special requests? • Use less cooking oil to prepare a dish?
 Act! Select foods that are. . . •")
Eating Healthy When Dining Out (continued) Act! Select foods that are. . . • Steamed • Garden fresh • Broiled • Baked • Roasted • Poached • Lightly sautéed or stir-fried.

Physical Activity Regular physical activity can help you feel better because it: • Boosts energy • Helps you cope with stress • Improves self-image • Increases resistance to fatigue • Helps counter anxiety and depression • Helps you relax and feel less tense • Improves your ability to fall asleep and sleep well • Provides an easy way to share time with friends or family and an opportunity to meet new friends

Physical Activity Regular physical activity can help you look better because it: • Tones muscles • Burns off calories to help lose extra pounds or to help you stay at your desirable weight--each pound requires you to burn off 3, 500 more calories than you take in • Helps control your appetite

Examples of moderate amounts of physical activity Common Chores • Washing and waxing a car for 45 -60 min. • Washing windows or floors for 45 -60 min. • Gardening for 30 -45 min. • Wheeling self in wheelchair 30 -40 min. • Pushing a stroller 1½ miles in 30 min. • Raking leaves for 30 min. • Walking 2 miles in 30 min. (15 min/mile) • Shoveling snow for 15 min. • Stairwalking for 15 min.

Examples of moderate amounts of physical activity Sporting Activities • Playing volleyball for 4560 min. • Playing touch football for 45 -60 min. • Walking 1¾ miles in 35 min. (20 min/mile) • Basketball (shooting baskets) for 30 min. • Bicycling 5 miles in 30 min. • Water aerobics for 30 min. • Swimming Laps for 20 min. • Basketball (playing game) for 15 -20 min. • Bicycling 4 miles in 15 min. • Jumping rope for 15 min. • Running 1½ miles in 15 min. (10 min/mile) • Dancing fast (social) for 30 min.

Calories Burned During Physical Activities Activity Hour Light Activity: Cleaning house Office work Playing baseball Playing golf Calories Burned in an Man Woman 300 240 Moderate Activity: Walking briskly (3. 5 mph) Gardening Cycling (5. 5 mph) Dancing Playing basketball 460 Dietary Guidelines for Americans, USDA, DHHS, 3 rd edition, 1990 (adapted from Mc. Ardle et al. , “Exercise Physiology, ” 1986). 370

Calories Burned During Physical Activities Activity Hour Calories Burned in an Man Woman Strenuous Activity: Jogging (9 min/mile) Playing football Swimming 730 580 Very Strenuous Activity: Running (7 min/mile) Racquetball Skiing 920 740 Dietary Guidelines for Americans, USDA, DHHS, 3 rd edition, 1990 (adapted from Mc. Ardle et al. , “Exercise Physiology, ” 1986).

Pharmacotherapy Drugs approved for long-term use by the FDA may be used as part of a comprehensive weight loss program including diet and physical activity. Evidence Category B. • For patients with a BMI of 30 or above with no concomitant risk factors or diseases • For patients with a BMI of 27 or above for those with concomitant risk factors or diseases (hypertension, dyslipidemia, CHD, type 2 diabetes, sleep apnea)
 • Drugs should never be used alone. • Drugs should be used")
Pharmacotherapy (continued) • Drugs should never be used alone. • Drugs should be used in combination with diet, exercise, and behavior modification.

Weight Loss Drug Sibutramine Dose 5, 10, 15 mg Action Norepinephrine, Adverse Effects Increase in heart (Meridia) 10 mg po qd dopamine, and rate and blood pressure. to start, may be serotonin reuptake increased to 15 mg or decreased to 5 mg. inhibitor. 120 mg Inhibits pancreatic Decrease in 120 mg po tid before meals. lipase, decreases fat absorption. of fat-soluble vitamins; soft and anal leakage. Orlistat absorption (Xenical) stools

Combined Therapy • Combined intervention of a calorie-deficit diet, increased physical activity, and behavioral treatment is most successful for weight loss and maintenance. Evidence Category A. • Nondrug interventions should be attempted for at least 6 months before considering treatment.

Weight Loss Surgery Option for limited number of patients with clinically severe obesity. Evidence Category B. • BMI >40 or >35 with comorbid conditions • Reserved for patients in whom medical therapy has failed • Gastric restriction or gastric bypass Integrated program must be in place before and after surgery.

Gastric Bypass Surgery Complications: 14 -Year Followup Surgical Complications Number of Patients % of Patients Vitamin B 12 deficiency Readmit for various reasons Incisional hernia Depression Staple line failure Gastritis Cholecystitis Anastomotic problems Dehydration, malnutrition Dilated pouch 239 229 143 142 90 79 68 59 35 19 39. 9 38. 2 23. 9 23. 7 15. 0 13. 2 11. 4 9. 8 5. 8 3. 2

Obesity and Sleep Apnea The major correlates of sleep apnea: • Prevalence is higher in males than in females. • Obese men and women have higher prevalence. • May be more prevalence among special populations with higher prevalence of obesity. The major consequences of untreated sleep apnea: • • Severe arterial hypoxemia. Increased risk of cardiac arrhythmia. Increased risk of high blood pressure. Possible increased risk of stroke.

Obesity and Sleep Apnea • Treatment of obesity ameliorates obstructive sleep apnea – Medical treatment. – Surgical treatment. • Benefits of treatment – A 10% weight reduction is associated with a 50% reduction in severity of sleep apnea. – Reduction of specific cardiovascular risk factors.

Obesity Treatment in Special Populations • Smokers – All smokers, regardless of weight, should quit smoking. – Implement weight gain prevention, treatment efforts as necessary. • Older adults – Evaluate risk-to-benefit ratio. • Diverse patient populations – Tailor treatments to patient needs.

Smokers All smokers, regardless of their weight status, should quit smoking. Evidence Category A. Prevention of weight gain should be Encouraged. If weight gain does occur, it should be treated through dietary therapy, physical activity, and behavior therapy. The primary emphasis should be smoking abstinence. Evidence Category C.

Older Adults Issues for weight loss after age 65: • Are indications for treatment of older adults the same as for younger adults? • Does weight loss reduce risk factors in older adults? • Does weight reduction prolong the lives of older adults? • Are there risks with obesity treatment that are unique to older adults?
 Treatment should be guided by · Evaluation of the potential benefits")
Older Adults (continued) Treatment should be guided by · Evaluation of the potential benefits · Reduction of cardiovascular events · Patient motivation for weight reduction Any weight reduction program should minimize adverse effects on bone health and other aspects of nutritional status. Evidence Category D.

CASE STUDIES

A 45 -year-old man comes in for his annual physical. • Height 5’ 10”, weight 210 lb, nonsmoker, no history of CAD, DM, or dyslipidemia. • On questioning, he is unconcerned about his weight, which he attributes to “too much food and too little exercise. ” • His wife, however, has been nagging him to lose weight. • On physical exam, he is moderately obese, BP 140/99, pulse 78 and regular, waist circumference 42 inches; no other abnormalities detected. • Clinical assessment: – What further evaluation would you perform? – How would you address his obesity?

A 32 -year-old woman comes to your office requesting “diet pills” because “I’m too fat. ” • Height 5’ 5”, weight 149 lb. • Difficulty losing weight after her second pregnancy 18 months ago; about 8 pounds heavier than her prepregnancy weight. • Always overweight—lost and regained 10 to 15 lb numerous times. • Used to go to a gym to exercise 2 or 3 days a week—now no time because of her young children. • On physical exam, no abnormalities detected; waist circumference 30 inches, BP 118/72, pulse 84 and regular, lipids and glucose within normal limits. • Clinical assessment: – What is her BMI? – Would you prescribe weight loss medications? – What would you advise her regarding weight management?

FOR FUTURE ADVISE CONTACT 0507412949 drrnabhan@yahoo. co. uk Thank You
5d17f2304c194d7ceff614e56dbdb431.ppt