

1b4fe204c9de302382119d2c5377a034.ppt
- Количество слайдов: 48
 And Rainfall Studies in New Mexico Long S.") The Remote Sensing Information Partner (RSIP) And Rainfall Studies in New Mexico Long S. Chiu*, George Serafino, William Teng, John Qu*, Zhong Liu*, Nathan Pollack NASA/GSFC Distributed Active Archive Center *Center for Earth Observing and Space Research GMU Interface 2002, Montreal Canada April 19, 2002
The Remote Sensing Information Partner (RSIP) And Rainfall Studies in New Mexico Long S. Chiu*, George Serafino, William Teng, John Qu*, Zhong Liu*, Nathan Pollack NASA/GSFC Distributed Active Archive Center *Center for Earth Observing and Space Research GMU Interface 2002, Montreal Canada April 19, 2002
 Barriers to Wide Dissemination of NASA Remote Sensing Data • Awareness: The potential user community is large but for most part, they are unaware of the availability of NASA data • Responsiveness: What the delivery mechanism of the data and expertise, it must be based on dialogue and partnership with the users • Cost: Data costs were viewed as the deciding factor in limiting use • Format: Data must be delivered in formats that are compatible with the ways users do their business • Interdisciplinary approach: Remote sensing data are most useful when they are interlayered with other relevant data to allow different information to come into play
 Response to Lack of Awareness • Develop an outreach campaign aimed at increasing the visibility of geospatial data products and tools • Establish linkage between NASA, the State and Local Agencies, through Existing Centers such as State Extension Services • Undertake one or a series of pilot projects that would demonstrate clearly the value of geospatial data and tools in operational settings
 • Esoteric Projections (e.") Obstacles in Using EOS Data • Complex format (HDF, HDF-EOS) • Esoteric Projections (e. g. , Integerized Sinusoidal) • Large file sizes • Too much information in files • Insufficient bandwidth for downloading of the data • Insufficient storage on the user's local platform • Inability of the user's visualization/analysis package to handle the HDF-EOS format • Unavailability of a means to seamlessly utilize data sets from various sources so as to minimize the amount of preprocessing on the part of the user (i. e. , interoperability)
Obstacles in Using EOS Data • Complex format (HDF, HDF-EOS) • Esoteric Projections (e. g. , Integerized Sinusoidal) • Large file sizes • Too much information in files • Insufficient bandwidth for downloading of the data • Insufficient storage on the user's local platform • Inability of the user's visualization/analysis package to handle the HDF-EOS format • Unavailability of a means to seamlessly utilize data sets from various sources so as to minimize the amount of preprocessing on the part of the user (i. e. , interoperability)
 The Utility of GIS for Applications SST TRMM Political Boundaries Population of Cities
 RSIP Purpose • The purpose of the RSIP project is to provide participating institutions inexpensive access to the globally covered GES data holdings, and the ability to routinely acquire these data for local use or future distribution • The GES DAAC benefits in this arrangement by assuring that NASA data are more widely distributed, thus affording a better usage for NASA efforts • The participating RSIP "nodes" benefit by obtaining customized data products preprocessed into a form that can be readily used for applications purposes (e. g. , GIS-compatible formats) • The GES DAAC has collaborated with several institutions to set up the mechanism to operationally provide these special earth science data products from the DAAC for local use.
 Concept Regional Users State/Local Agencies JPL") One Solution - Remote Sensing Information Partner (RSIP) Concept Regional Users State/Local Agencies JPL DAAC U. NM DAAC Rutgers Univ RSIP Mirror Site Local User Applications Users PURPOSE: To facilitate routine access to and use of global earth science data products for redistribution to local user community Other Universities GMU BENEFITS: • Local environmental agencies, policymakers, applications users obtain data in a cost effective and efficient manner, in a form they can readily use (e. g. , regional subsets in a GIS-compatible format) • Distribution of data management responsibilities to local data centers, consistent with future Earth Science Enterprise trends • Relevant data are placed in the hands of those who are in the best position to ascertain the potential needs of their local communities in the derivation of value-added products • Collaboration is encouraged or strengthened between NASA and the participating nodes, or among the nodes themselves in cases of environmental issues of mutual concern SAMPLE PRODUCTS: Rutgers University • MODIS 16 -day Surface Reflectance • MODIS 16 day Vegetation Index • MODIS 8 day Vegetation Index University of New Mexico • TRMM Rainfall data • MODIS atrmospheric data • Sea. Wi. FS channel data George Mason University (GMU) • MODIS channel data • MODIS land/ocean data JPL DAAC • MODIS Sea Surface Temperature (SST)
One Solution - Remote Sensing Information Partner (RSIP) Concept Regional Users State/Local Agencies JPL DAAC U. NM DAAC Rutgers Univ RSIP Mirror Site Local User Applications Users PURPOSE: To facilitate routine access to and use of global earth science data products for redistribution to local user community Other Universities GMU BENEFITS: • Local environmental agencies, policymakers, applications users obtain data in a cost effective and efficient manner, in a form they can readily use (e. g. , regional subsets in a GIS-compatible format) • Distribution of data management responsibilities to local data centers, consistent with future Earth Science Enterprise trends • Relevant data are placed in the hands of those who are in the best position to ascertain the potential needs of their local communities in the derivation of value-added products • Collaboration is encouraged or strengthened between NASA and the participating nodes, or among the nodes themselves in cases of environmental issues of mutual concern SAMPLE PRODUCTS: Rutgers University • MODIS 16 -day Surface Reflectance • MODIS 16 day Vegetation Index • MODIS 8 day Vegetation Index University of New Mexico • TRMM Rainfall data • MODIS atrmospheric data • Sea. Wi. FS channel data George Mason University (GMU) • MODIS channel data • MODIS land/ocean data JPL DAAC • MODIS Sea Surface Temperature (SST)
 at University of New") Prospective Local RSIP Customers • Earth Data Analysis Center (EDAC) at University of New Mexico – – Middle Rio Grande Conservancy District Office of the State Engineer NM Department Energy, Minerals, and Natural Resources Sevilleta National Wildlife Refuge • Center for Remote Sensing and Spatial Analysis at Rutgers University – State agricultural agencies – Commercial interests in regional and international agriculture • Center for Earth Observing and Space Research George Mason University – State and local agencies through Virginia Access (VAccess) • Pennsylvania State University (possible RSIP) – State / County public health departments
Prospective Local RSIP Customers • Earth Data Analysis Center (EDAC) at University of New Mexico – – Middle Rio Grande Conservancy District Office of the State Engineer NM Department Energy, Minerals, and Natural Resources Sevilleta National Wildlife Refuge • Center for Remote Sensing and Spatial Analysis at Rutgers University – State agricultural agencies – Commercial interests in regional and international agriculture • Center for Earth Observing and Space Research George Mason University – State and local agencies through Virginia Access (VAccess) • Pennsylvania State University (possible RSIP) – State / County public health departments
 State Agency") Prospective Local RSIP Customers • George Mason University / Virginia Access (VAccess) State Agency Stakeholders CBLAD Chesapeake Bay Local Assistance Dept CIT Center for Innovative Technology Virginia DEQ Department of Environmental Quality DES Department of Environmental Services DOF Department of Forestry EDP Economic Development Program GIN Geographic Information Network Federal Agencies EPA Environmental Protection Agency Forest Service USGS United States Geological Service NASA National Aeronautics and Space Admin USDA United State Department of Agriculture Participating Programs ESIP Federation JIESIC RESAC SIESIP EOSR GEM Earth Science Information Partner Federation Joint Interdisciplinary Earth Science Information Center Regional Earth Science Applications Center Seasonal to Interannual ESIP Earth Observing & Space Research, Remote Sensing, Computational Physics & Associated Scientific Fields Simulation Studies of Sub-storm Triggering Processes
Prospective Local RSIP Customers • George Mason University / Virginia Access (VAccess) State Agency Stakeholders CBLAD Chesapeake Bay Local Assistance Dept CIT Center for Innovative Technology Virginia DEQ Department of Environmental Quality DES Department of Environmental Services DOF Department of Forestry EDP Economic Development Program GIN Geographic Information Network Federal Agencies EPA Environmental Protection Agency Forest Service USGS United States Geological Service NASA National Aeronautics and Space Admin USDA United State Department of Agriculture Participating Programs ESIP Federation JIESIC RESAC SIESIP EOSR GEM Earth Science Information Partner Federation Joint Interdisciplinary Earth Science Information Center Regional Earth Science Applications Center Seasonal to Interannual ESIP Earth Observing & Space Research, Remote Sensing, Computational Physics & Associated Scientific Fields Simulation Studies of Sub-storm Triggering Processes
 RSIP Activities • MOU and Requirements • Generation of Prototype GIS Compatible Remote Sensing data • Development of Access, Visualization and Remapping Software • Value-added Data Flow to RSIP Partners • Joint Presentations (USGS Middle Rio Grande, Fire-Ecology, American Water Resources Workshop) • First RSIP Training Workshop January 8 -9, 2002
 RSIP First Training Workshop Jan 8 -9, 2002
 Example Products Requested by RSIPs Data Product MODIS 250 m Surface Reflectance MODIS 500 m Surface Reflectance MODIS 250 m Vegetation Indexes MODIS 500 m Vegetation Indexes MODIS 1 km Land Surface Temp TRMM Orbital Rain Rates Sea. W i. FS HRPT Size (MB) 150 500 70 23 8 35 # Arrays 3 12 11 11 13 13 35 Format Projection HDF-EOS HDF-EOS HDF ISIN ISIN Swath
 Overall RSIP Data Delivery Concept Standard data products from DAAC heritage systems Standard MODIS data products from DAAC ECS system Subscription DAAC data pre-processing (subset, mosaic, re-project, reformat) FTP MODIS Direct Broadcast Local RSIP storage Local Users
 Data Flow for U. New Mexico TRMM G 2 B 31 SUBSETTED BINARY FILE DATA FOR STATE EXTRACTED AND CONVERTED TO ASCII TABLE FILE OUTPUT (. TXT) DATA RECORD FOR SURFACE RAINFALL RATE EXTRACTED FROM TABLE ASCII RASTER FORMAT FILE OUTPUT (. RASTER) U. NM (Earth Data Analysis Center) ERDAS Output DATA INGESTED INTO ARC/INFO GIS SOFTWARE ARC/INFO INTERCHANGE FORMAT GENERATED (. e 00) GRID DATA CHANGED TO POINT FILE (FOR SHAPEFILE CONVERSION) ARC/VIEW SHAPEFILES PRODUCED (3 FILES) (. shp. shx. dbf) DAAC ARC/INFO Output
 Data Flow for Rutgers University Center for Remote Sensing and Spatial Analysis MODIS Surface reflectance tile in ISIN projection: MOD 09 A 1 image shows a sample of the Level 3, 8 -day (started 2000273 (Sept. 30) composite of 1 km Level 3 Surface Reflectance bands 1 (red), 4 (green) and 3 (blue). Re-projected tile in Lambert Azimuthal (LA) Equal Area projection using the Nearest Neighbor (NN) resample method Reprojection Subsetting Subsampling Reformatting An example of MODIS data GIS application. MODIS Level-1 B false color Bands 2, 1, 1 image overlayed with county boundaries. Subsetted MODIS surface reflectance data in LA projection using MRT.
 MODIS Customized Products for PSU
 DAAC Open. GIS - Compliant Client • Client being developed by DAAC to promote data and information exchange (knowledge sharing) among individual RSIPs • OGC-compliant Java applet • Allows user to select desired data sets and create maps from RSIP nodes, other OGC-compliant servers, and DAAC map servers : – Web Mapping Testbed / Distributed Oceanographic Data System (WMT-DODS) – NASAWeb GIS Software Suite (NWGISS), developed to serve HDFEOS data to OGC clients • Currently being enhanced to allow for temporal searching and retrieval of data subsets in addition to map generation
 Data Distribution via RSIPs GES DISC DAAC Nodes • Network of secondary End Users data distributors with more knowledge of local users. • Nodes additional information to data product before sending to users. • Interoperable distributed data.
 – Founded in") Open. GIS as a potential solution • Open GIS Consortium (OGC) – Founded in 1994 – Partnership of Industry, Government, Educational institutions – http: //www. opengis. org • Goal is to create interoperability specifications to allow the transparent exchange of Geospatial data regardless of data format.
Open. GIS as a potential solution • Open GIS Consortium (OGC) – Founded in 1994 – Partnership of Industry, Government, Educational institutions – http: //www. opengis. org • Goal is to create interoperability specifications to allow the transparent exchange of Geospatial data regardless of data format.
 http: //daac. gsfc. nasa. gov/daacbin/wmtver=1. 0. 0& REQUEST=map &LAYERS=Modis. SST 1 d Parses capability document to show available &SRS=EPSG: 4326 layers. &bbox=-180, 90, 180, 90 Allows &format=PNG Get. Map requests of server. user to make &width=1024&height=512 Displays layers of images created by map &transparent=true& servers. exception=wms_xml &time=2000 -06 -30 DAAC OGC Client • • •
 DAAC Open. GIS - Compliant Client
 Future Work • Expansion of the RSIP network to include operational data flows to CRSSA, GMU/Vaccess and PSU • Inclusion of near realtime MODIS ocean products derived from Direct Broadcast into the RSIP data flows • Complete automation of the receipt, preprocessing and delivery of MODIS customized products to the RSIP nodes • Completion of the Open. GIS-compliant client to promote interchange of data and information among participating nodes • Collection of metrics from the RSIPs to demonstrate that the objectives of the program are being fulfilled
 Precipitation Estimate of TRMM in the Rio Grande Region Long S. Chiu, Z. Liu, J. Vongsaard GDAAC and CEOSR/GMU S. Morain, A. Budge, P. Neville, C. Bales EDAC/UNM
 Objectives • Examine TRMM Algorithms Performance in Relatively Dry Regions • Compare TRMM and EDAC Rain Gauge Network Data • Assess Value of Satellite Data to Regional Water Resource Management
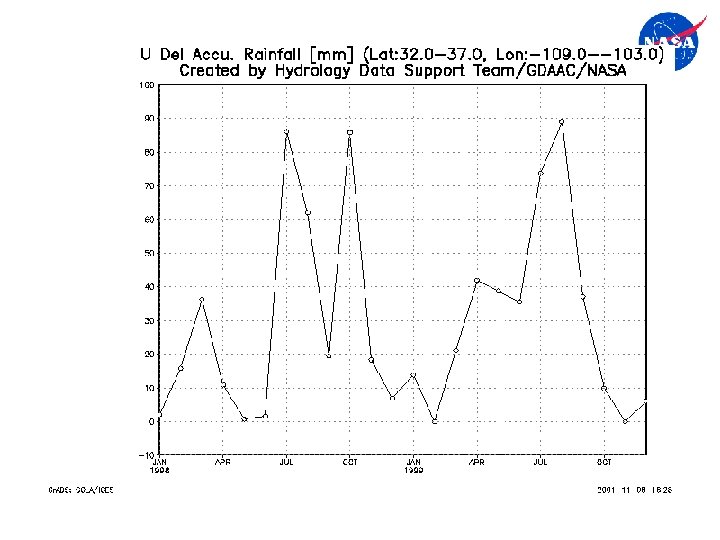
 from 3") Comparison of TRMM Satellite Rainfall with US Gauge Data Rainfall accumulation (1/1/987/31/98) from 3 B 42 daily 1 x 1 degree merged satellite product Rainfall accumulation for the same period from hourly gauge data over the US Chiu and Vongsaard GMU
Comparison of TRMM Satellite Rainfall with US Gauge Data Rainfall accumulation (1/1/987/31/98) from 3 B 42 daily 1 x 1 degree merged satellite product Rainfall accumulation for the same period from hourly gauge data over the US Chiu and Vongsaard GMU
 and PR precipitation profile") Data • TRMM Microwave Imager Hydrometeor Profile (2 A 12) and PR precipitation profile (2 A 25) binned at 0. 5 degree (3 G 68) • 3 G 68 averaged to 3 hourly seasonal data • TRMM and Other Satellite Combined Daily 1 x 1 degree Rain Rate (3 B 42) • TRMM and Other, includes Gauge (3 B 43) Monthly 1 x 1 degree Rain Rate • TSDIS TRMM Mission Index: Average Daily 1 x 1 degree Sensor rain rates for all satellite passes
Data • TRMM Microwave Imager Hydrometeor Profile (2 A 12) and PR precipitation profile (2 A 25) binned at 0. 5 degree (3 G 68) • 3 G 68 averaged to 3 hourly seasonal data • TRMM and Other Satellite Combined Daily 1 x 1 degree Rain Rate (3 B 42) • TRMM and Other, includes Gauge (3 B 43) Monthly 1 x 1 degree Rain Rate • TSDIS TRMM Mission Index: Average Daily 1 x 1 degree Sensor rain rates for all satellite passes
 3 B 42 and 3 B 43 Algorithm Input 3 B 42: Daily 1 x 1 degree - VIRS (1 B 01) IR Histogram - TMI Rain Rate (2 A 12) 3 B 43: Monthly 1 x 1 degree - Monthly TMI (3 B 42 intermediate product) - VIRS IR Histogram (3 B 42 Intermediate product) - SSM/I Monthly Rain Rate (3 A 46) - CAMS or GPCP Gauge Analysis (3 A 45)
 TRMM Analysis Tools • TSDIS Orbit Viewer • GMU/GDAAC Convert 3 B 42 and 3 B 43 into Gr. ADS Compatible Files • GMU/GDAAC Develope Prototype Gr. ADS based TRMM On-line Analysis to display area accumulation and time series of rain rate • URL: http: //daac. gsfc. nasa. gov/CAMPAIGN_DOCS/trmm_o nline_analysis/ • Grid Analysis and display system Gr. ADS URL http: //grads. iges. org/grads/head. html
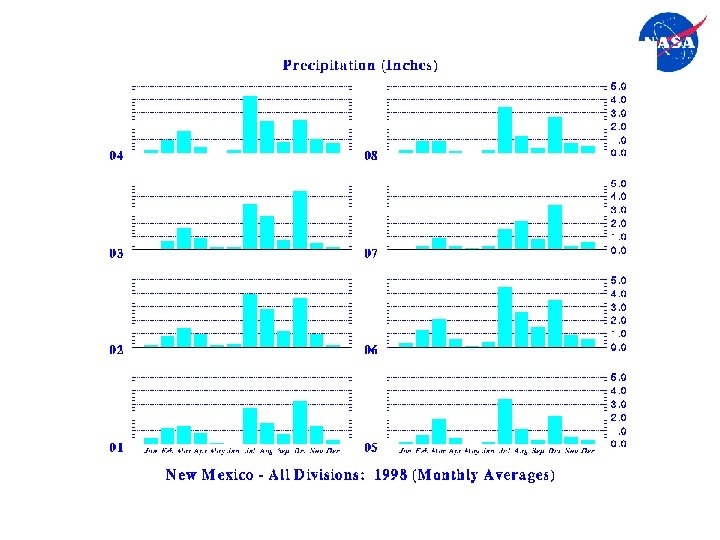
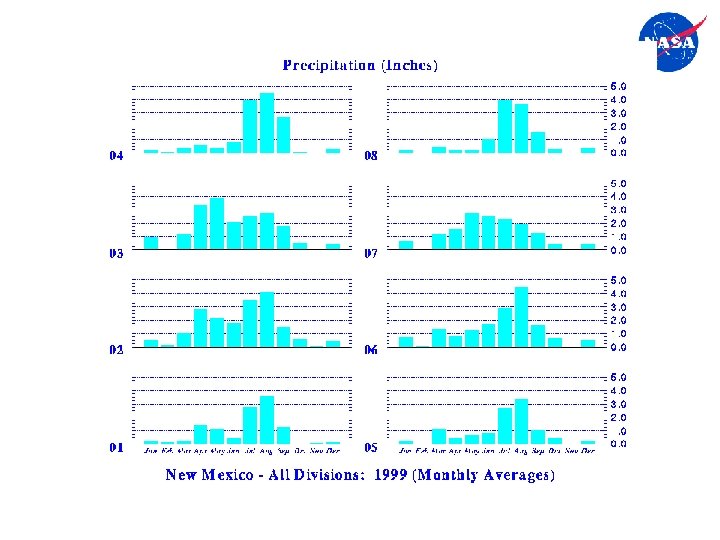
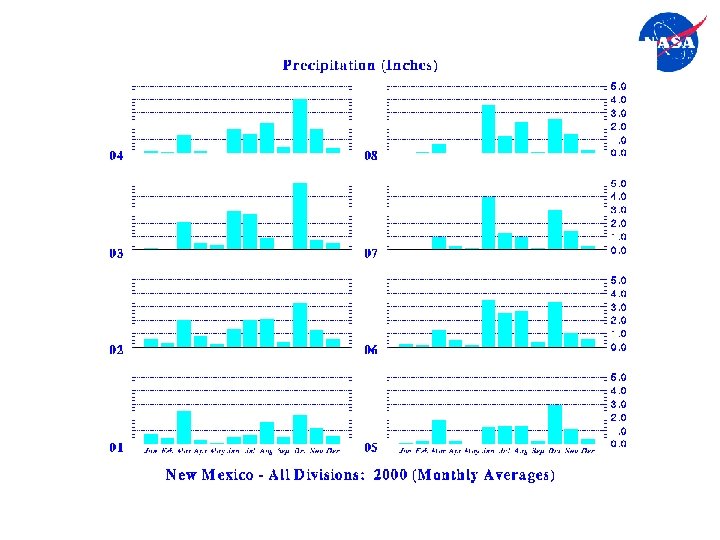
 TRMM COMBINED RAINFALL MONTHLY MEAN 1998 - 2000 1998 1999 2000
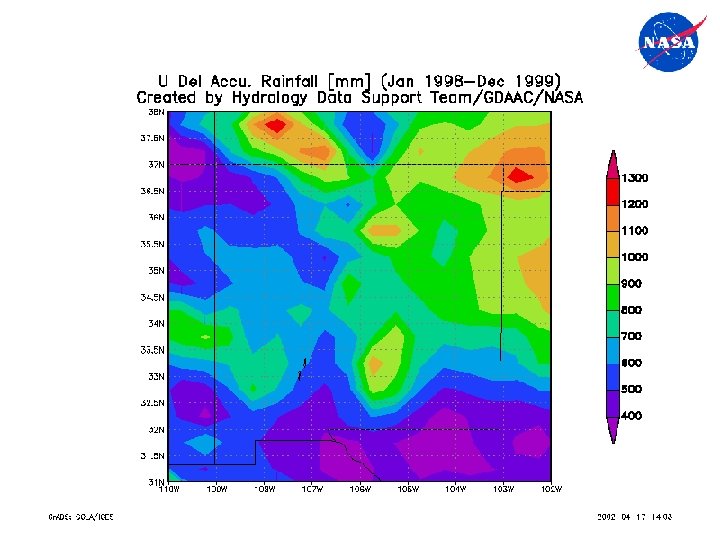
 Water Divisions in New Mexico 1. 14 . 82 1. 17. 97 1. 17. 75 . 83 . 81 Average rain rate (mm/d) in red for the period Jan 1998 -Dec 2000 http: //www. ncdc. noaa. gov/onlineprod/drought/xmgr. html
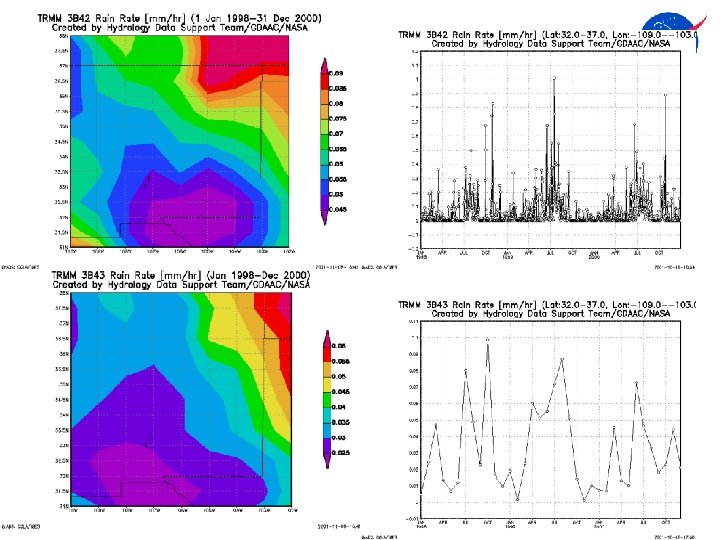
 Time Series of WD Gage, 3 B 42 and 3 B 43 Monthly Rainfall (mm/hr) 3 B 43 agrees with WD gage data except for October 2000 1998 -2000 total acc. WD=877 mm 3 B 43=860 mm 3 B 42=1589 mm. Cor(WD, 3 b 42)=0. 82 Cor(WD. 3 b 43)=0. 87 Cor(3 B 42, 3 B 43)=0. 78
 for") Scatter Diagram of Monthly Rain Rate over NM (3237 N, 103 -109 W) for the period Jan 1998 -Dec 2000 3 B 42 = 0. 01 + 1. 21 WD mm/hr 3 B 43 = 0. 01 + 0. 64 WD Water Divisions Average Rain Rate (mm/hr) 1998 -2000 total acc. WD=877 mm 3 B 43=860 mm 3 B 42=1589 mm
Scatter Diagram of Monthly Rain Rate over NM (3237 N, 103 -109 W) for the period Jan 1998 -Dec 2000 3 B 42 = 0. 01 + 1. 21 WD mm/hr 3 B 43 = 0. 01 + 0. 64 WD Water Divisions Average Rain Rate (mm/hr) 1998 -2000 total acc. WD=877 mm 3 B 43=860 mm 3 B 42=1589 mm
 in New Mexico (32 -37") Comparison of TMI, PR and WD Seasonal Rainfall (mm/hr) in New Mexico (32 -37 N, 103 -109 W) TMI=0. 05+2. 19 WD TMI PR WD 1998 -2000 Average (32 -37 N, 103 -109 W) TMI (2 A 12)=0. 138 mm/hr PR(2 A 25)=0. 087 mm/hr WD: Water Districts Average=0. 040 mm/hr Cor(WD, PR)=0. 28 Cor(WD, TMI)=0. 67 Cor(PR, TMI)=0. 71
Comparison of TMI, PR and WD Seasonal Rainfall (mm/hr) in New Mexico (32 -37 N, 103 -109 W) TMI=0. 05+2. 19 WD TMI PR WD 1998 -2000 Average (32 -37 N, 103 -109 W) TMI (2 A 12)=0. 138 mm/hr PR(2 A 25)=0. 087 mm/hr WD: Water Districts Average=0. 040 mm/hr Cor(WD, PR)=0. 28 Cor(WD, TMI)=0. 67 Cor(PR, TMI)=0. 71
 Comparison of TMI and PR Rain Rate Over NM PR TMI ‘ 98 ‘ 99 ‘ 00 ‘ 01 Daily Rain Rate from TRMM Mission Index
 EDAC Rain Gauge Network • Developed to Monitor Environmental Changes • Consists of 28 Automatic Weather Stations Measuring Temperature, Relative Humidity and Precipitation • Data Enable Comparison with and Interpretation of Satellite Data
 TRMM and RAIN GAUGE RAINFALL DATA COMPARISON In cooperation with the UNM Sevilleta Long Term Ecological Research Program, an array of 21 tipping-bucket rain gauges has been deployed on the Sevilleta National Wildlife Refuge. Tipping buckets record rain events of 1/100 inch. Temperature and humidity data are available from 10 sites at 5 minute intervals. 12 -00
 RAINFALL TIME-OF-DAY EVENTS, AS MEASURED BY HYDROLOGY CLUSTER/SEVILLETA NWR RAIN GAUGES COMPARED TO TRMM OVERPASS TIMES FOR NEW MEXICO FOR JUNE AND JULY 2000 The summer 2000 “monsoon season” was late in coming and was fairly dry at the Sevilleta NWR. The small amounts of rain make coincident TRMM satellite overpass times critical for accurate measurements. Even in a wetter season, the overpass times would mean that most of the rain events would be missed. 12 -00
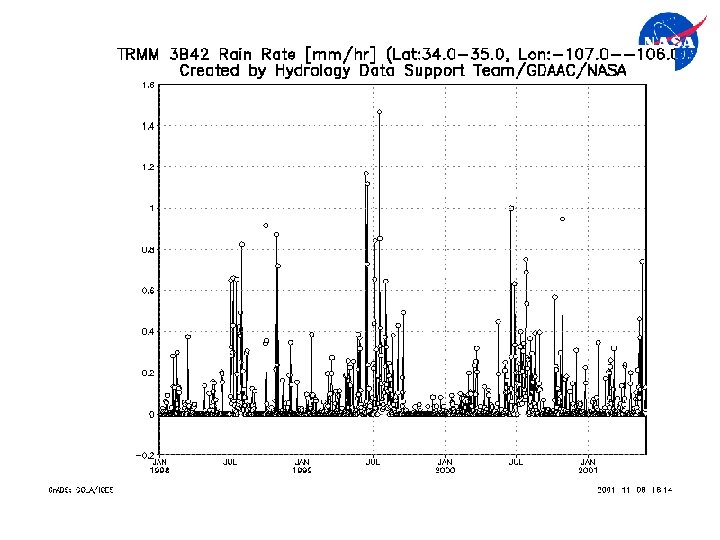
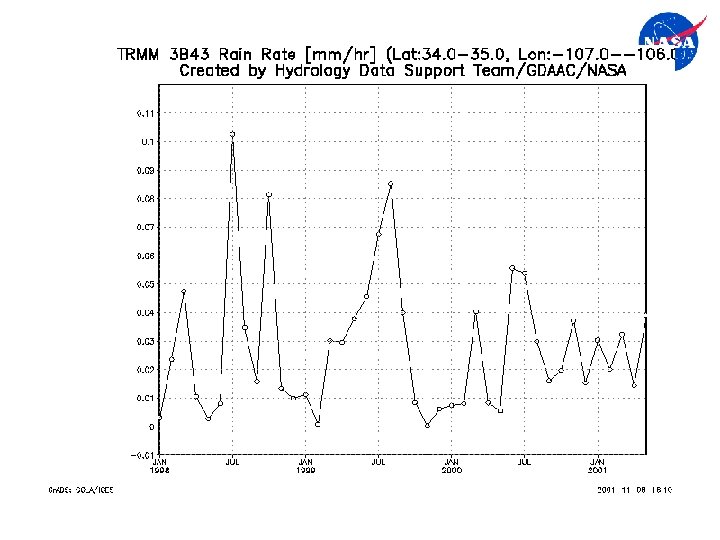
 Discussions and Conclusion • TRMM 3 B 43 consistent with WD gauge data in NM. Low bias noted for high rain months which may be due to noninclusion of some rain events in the operational CAMS product • PR and TMI are twice -three times higher than WD, respectively • Gauges underestimating: wind correction, evaporation (Vigra) • High TMI rain due to large ice scattering, implication for development of next version of TMI land algorithm • DSD and Z-R relation seasonally and geographically dependent