c3aa534085da8b5a8adacd39a69427c3.ppt
- Количество слайдов: 58


The Product: Watershed Plan Components Barry Tonning Tetra Tech

Contents of a Watershed Plan

Introduction

Water quality info & analysis

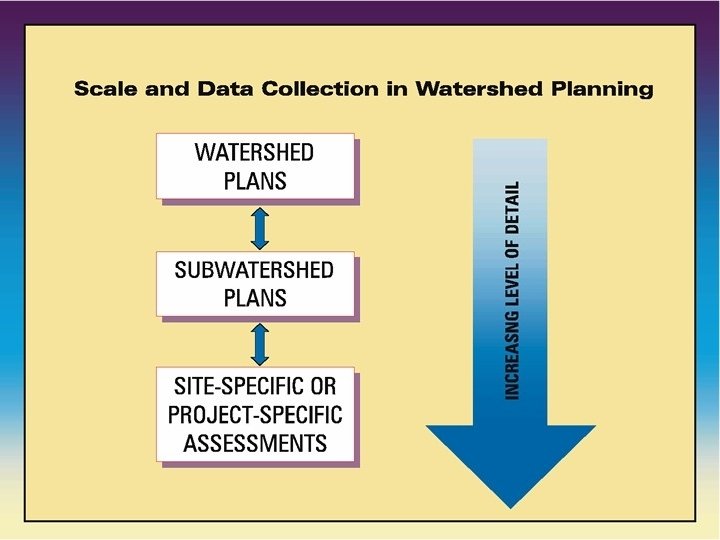
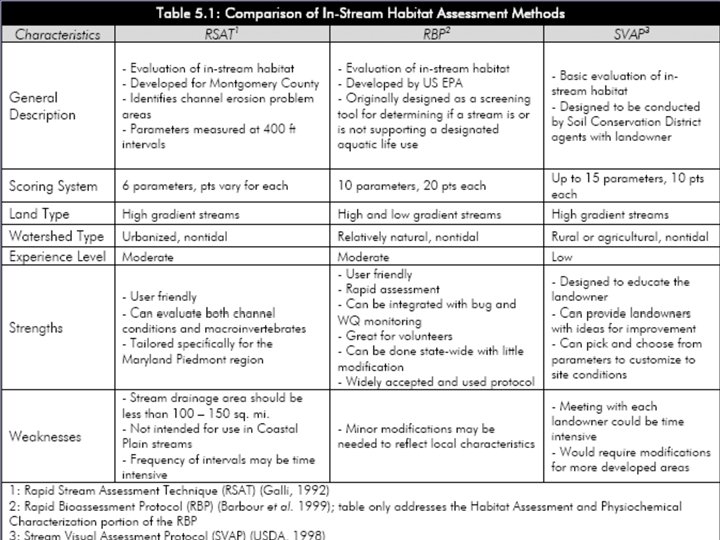
Types of Data for Watershed Characterization

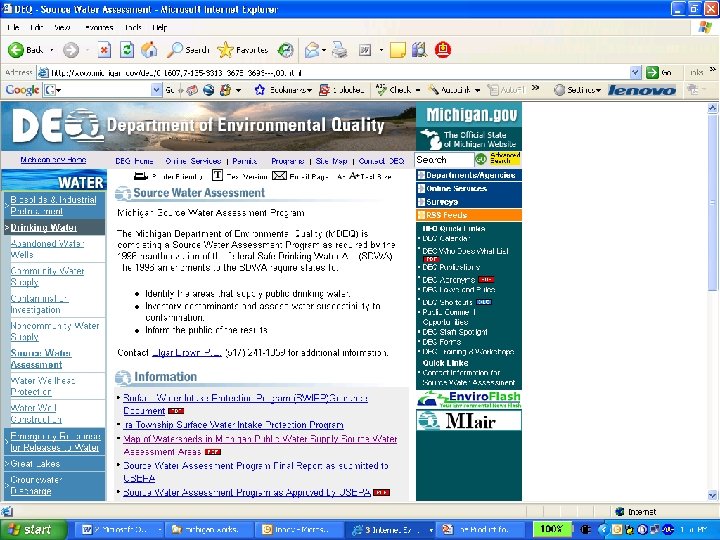
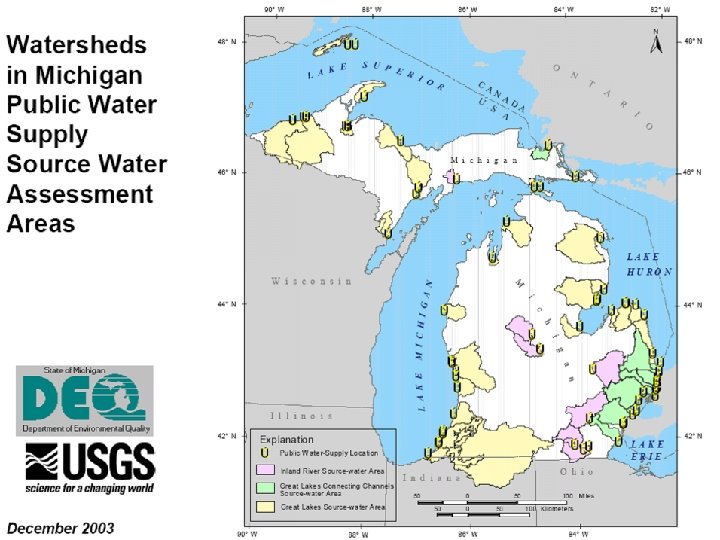
Who has assessment data?
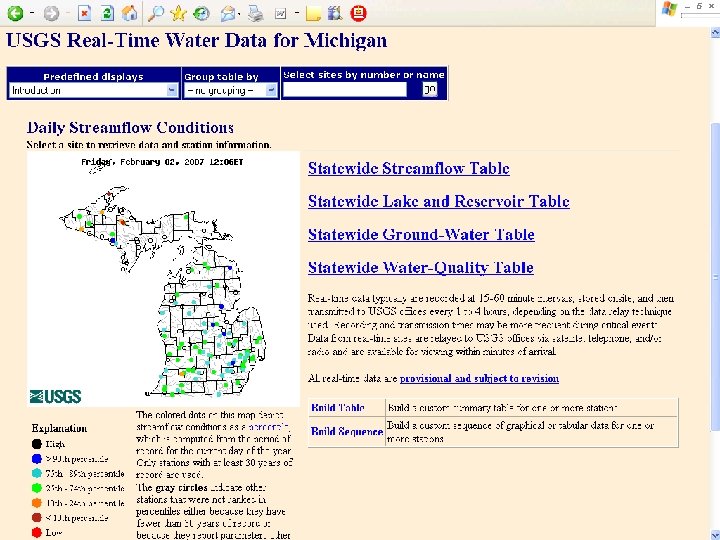

Flow data is available from the US Geological Survey web site at http: //waterdata. usgs. gov /nwis/rt

T. C. Stiles, 2001; B. Cleland, 2002
")
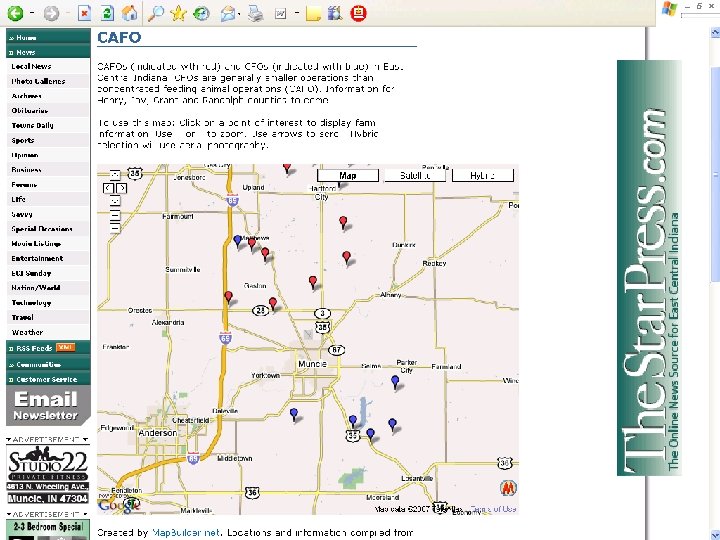
Source Water Protection Map for Slate Creek (Montgomery County)
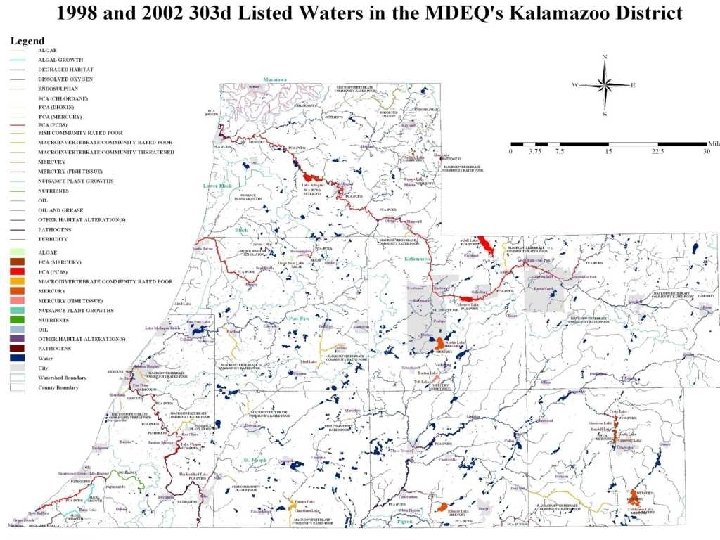

Waterbodies Requiring TMDLs Within the. Lower Grand River Watershed

Sample Data Sources

Other Data Sources

http: //www. nrcs. usda. gov/technical/ECS/aquatic/svapfnl. pdf

Unified Subwatershed and Site Reconnaissance Survey Neighborhood Source Assessment Hot Spot Investigation Pervious Area Assessment Streets and Storm Drain Assessment

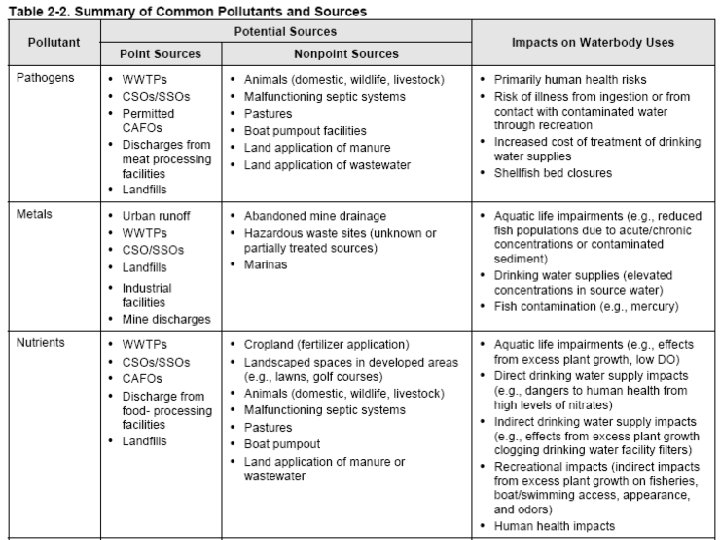
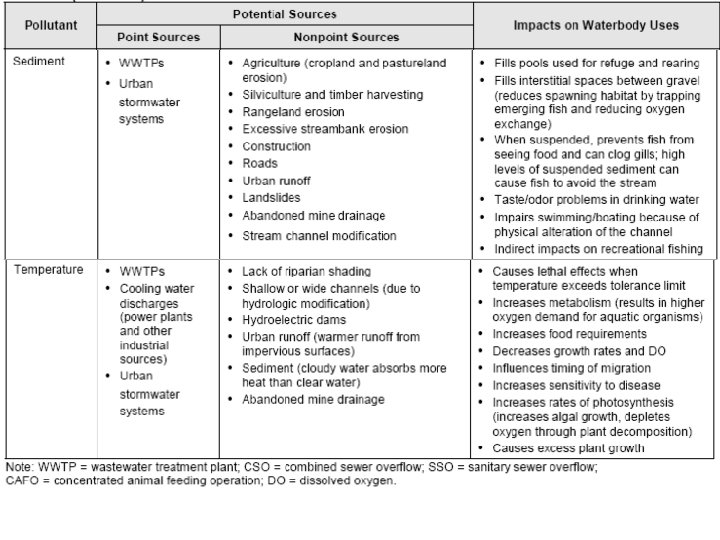
Identifying stressors and sources

Stressors

Sources

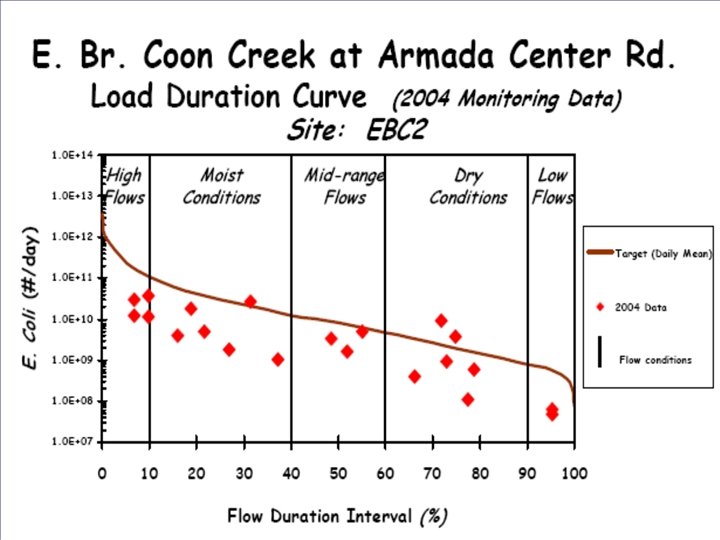
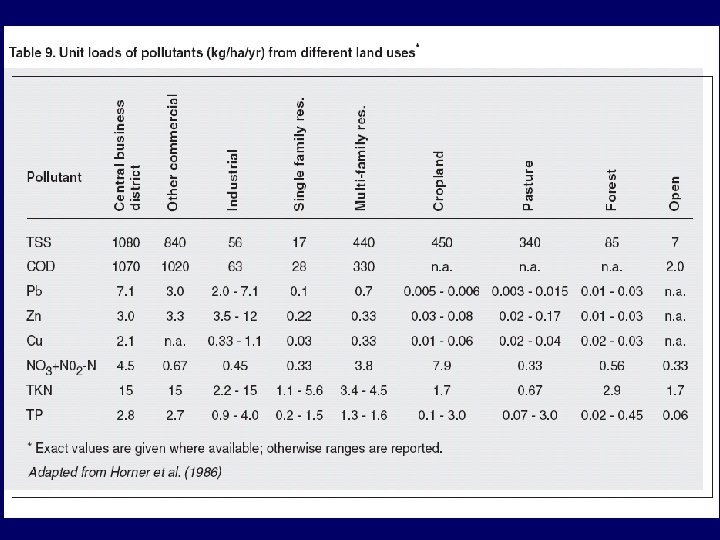
How can we estimate loads?

Existing loads come from lots of places. . .

Existing loads come from:

Steady-load: sewage treatment plant discharge via infrared photography
")
Nonpoint source: precip-driven (this may be a point source in some cases!)

What is a “load? ”

Identification of causes & sources

Reducing loads: the basics

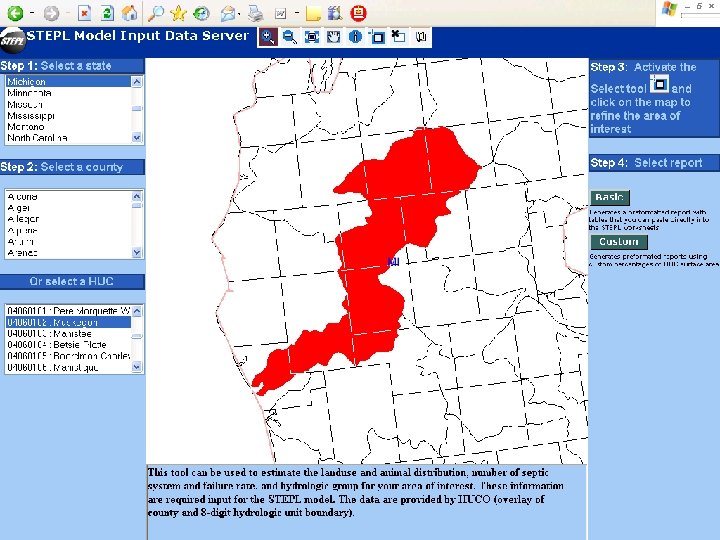
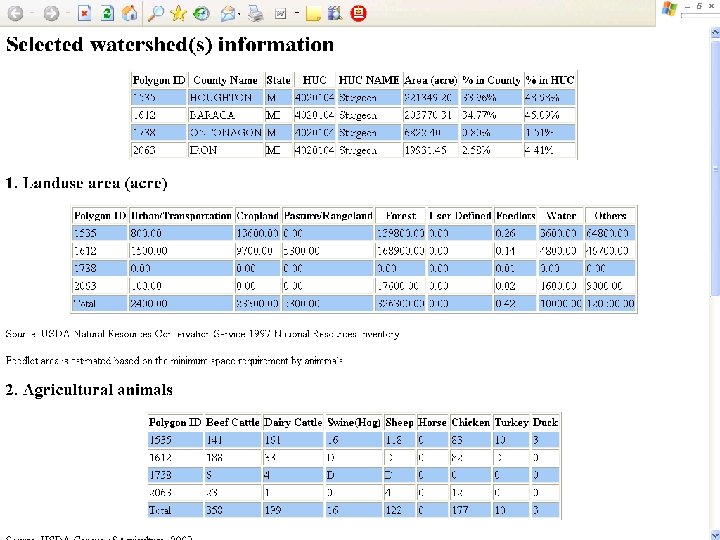
To model, or not to model. . .
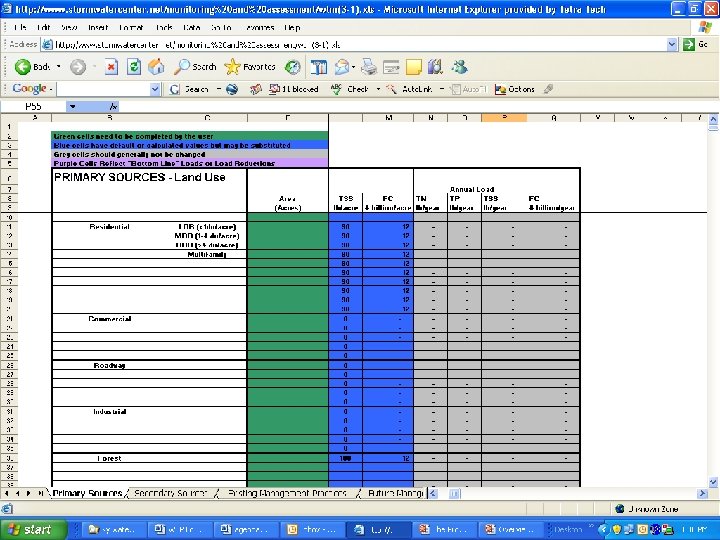

http: //it. tetratech-ffx. com/stepl

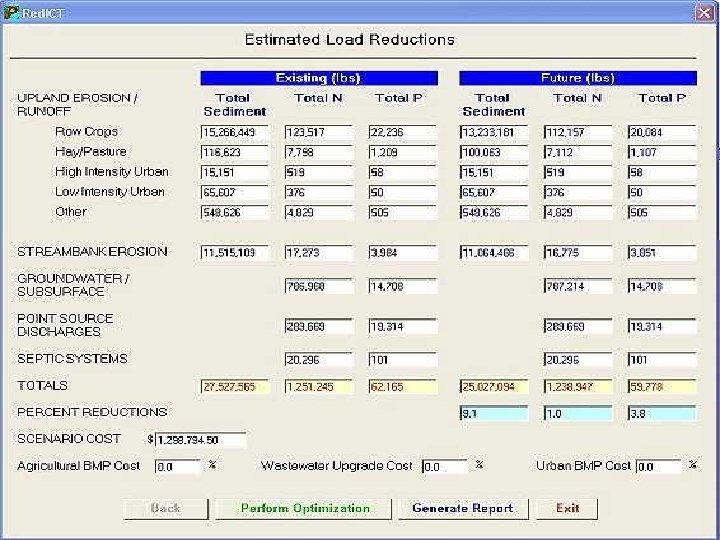
http: //www. predict. psu. edu/

Watershed analysis is on ongoing learning process – iterative & creative!

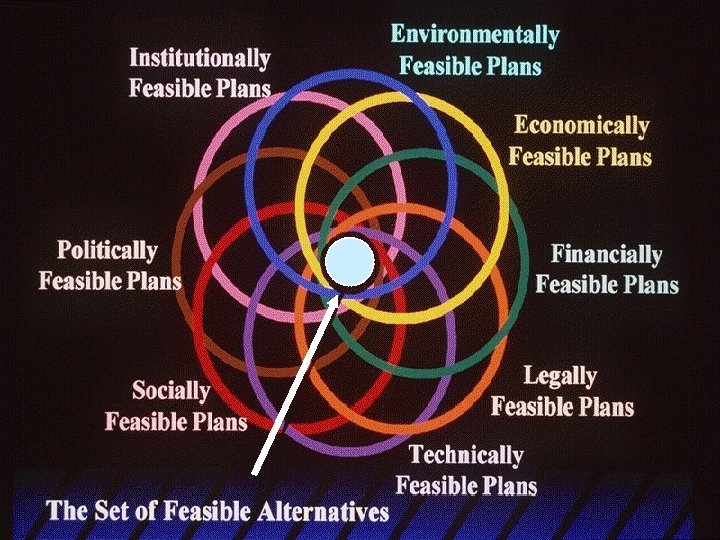
Proposed management measures

Examples of Different Scenarios to Meet the Same Load Target

Identify candidate practices

Select the most appropriate BMPs

Prioritizing/targeting BMPs

References for determining BMP effectiveness

www. epa. gov/owow/nps/agmm/index. html

http: //www. epa. gov/agriculture/anafobmp. html

www. epa. gov/owow/nps/agmm/ index. html

http: //www. epa. gov/owow/nps/forestrymgmt/

www. bmpdatabase. org/docs. htm

Sample BMP effectiveness table
c3aa534085da8b5a8adacd39a69427c3.ppt