1850aefc71902d1212596041e2b7fd02.ppt
- Количество слайдов: 85


The problem of obesity in perspective: Dealing with the modern food world Paul Rozin Buenos Aires September, 2014:
/height (m) 2 • Obesity BMI >= 30 •")
Definition • BMI = weight (kg)/height (m) 2 • Obesity BMI >= 30 • Overweight BMI >=25, <30

Patagonia 69, 853 kg 40 m BMI 43. 7

Obesity in perspective • The risk: overweight and obesity

Flegal et al. , 2005 Main Outcome Measures Number of excess deaths in 2000 associated with given BMI levels

The obesity “epidemic” 1. 4 pounds gained/year in USA over last 20 years

http: //www. surgeongeneral. gov/news/test imony/obesity 07162003. htm Statement of Richard H. Carmona, M. D. , M. P. H. , F. A. C. S. Surgeon General U. S. Public Health Service Wednesday, July 16, 2003 • “Nearly two out of every three Americans are overweight or obese. • “One out of every eight deaths in America is caused by an illness directly related to overweight and obesity. “But the fact is that we have an epidemic of childhood obesity. “

Epidemic versus “Slow crawl”

Food industry Government Medical research Media Public

Obesity and Malnutrition

World obesity 2010 • http: //www. who. int/mediacentre/factsheets/f s 311/en/ • In the world, over 200 million men and nearly 300 million women are obese
 Obesity BMI>=30 as % of all adults • https: //www.")
World Obesity (CIA, 2008) Obesity BMI>=30 as % of all adults • https: //www. cia. gov/library/publications/the -world-factbook/rankorder/2228 rank. html • 1. American Samoa 74. 6% • 18. USA 33. 0% • 23. Mexico 32. 1% • 29. Argentina 29. 7% • 102. Brazil 18. 8% • 108. France 18. 2% • 157. Japan 5. 0% • 184. India 1. 9%

Obesity in USA over time

Obesity in USA 2009 -2012

Marasmus: energy deficiency Kwashiorkor: protein deficiency

World Malnutrition • http: //www. wfp. org/hunger/stats • Hunger kills more people every year than AIDS, malaria and tuberculosis combined • 842, 000 don’t get enough to eat in world • Poor nutrition causes nearly half (45%) of deaths in children under five - 3. 1 million children each year.

• The Paleolithic human in the modern, developed world • Old heuristics, e. g. , “the image equals the object”

Late 20 th Century developed world • Epidemiological revolution: longer life and death from degenerative diseases: shift to long-term consequences • food surplus • extraordinary range of food choices • development of super-foods (e. g. chocolate) • no work needed to attain choices • Old heuristics not applicable: bias to eating • massive amounts of risk information • no training in dealing with risks/benefits or nutrition

Feature Heaven Love Italians Banks Swiss Universities British Food French Hell

Feature Heaven Hell Love Italians Swiss Banks Swiss Universities British Food French

Feature Heaven Hell Love Italians Swiss Banks Swiss Italians Universities British Food French

Feature Heaven Hell Love Italians Swiss Banks Swiss Italians Universities British French Food French

Feature Heaven Hell Love Italians Swiss Banks Swiss Italians Universities British French Food French British

The developed world • Western Europe vs India • 60% of all people live in Asia • 50% of total expenditures on food in developing world

Rating scale • • • 1. strongly disagree 2. disagree 3. neither agree nor disagree 4. agree 5. strongly agree

Mean Agreement Eating is a religious experience; My diet must adhere to strict moral/religious principles

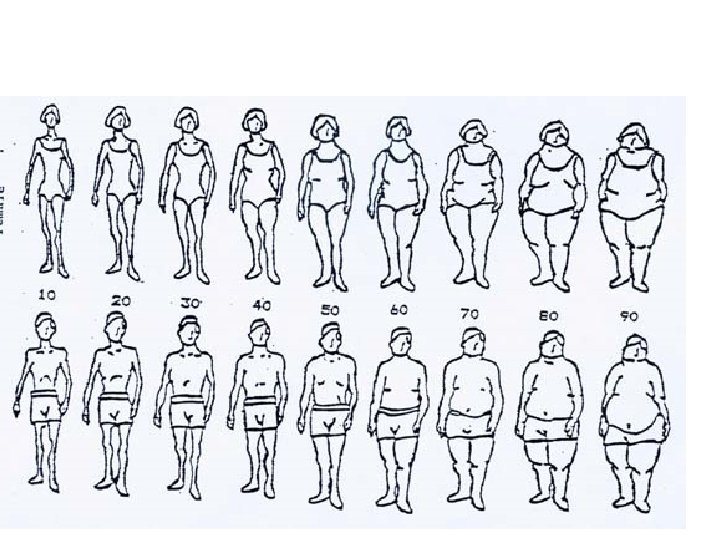
The combination of health and beauty norms

“Concerned about being overweight” • % responding “often“ or “almost always” • 57% females, 21% males • US college students from 6 universities across the country Rozin, Bauer & Catanese, 2003

“I am embarrassed to buy a chocolate bar in the store” • American college students from six campuses across the USA • % Females: 13. 5 • % Males: 4

Cultural solutions France With Claude Fischler

Obesity: France vs USA • % BMI >= 30 • France: 16% • USA: 32% • 2008 http: //www. who. int/gho/countries
 rank country years")
Life expectancy at birth (data from 2008 -2010: www. who. int/gho/countries) rank country years 1 Japan 83 10 Norway 81 4. 5 Australia 82 10 Sweden 81 4. 5 Israel 82 14 Austria 80 4. 5 Italy 82 14 Belgium 80 4. 5 Singapore 82 14 Finland 80 4. 5 Spain 82 14 Germany 80 4. 5 Switzerland 82 14 Greece 80 10 10 10 Canada France Netherlands 81 81 81 14 14 19. 5 Korea U. K. U. S. A. 80 80 79
 WHO/MONICA Renaud")
Age-standardized annual mortality from CHD and related risk factors (males 35 -64) WHO/MONICA Renaud & de Logeril, 1992 Location Mortality / 100, 000 Toulouse, France 78 Serum cholesterol (mg/dl) 230 Lille, France 105 252 Stanford, USA 182 209
 hotel at same")
Percent of subjects preferring a week at a luxury (vs. gourmet) hotel at same price Females Males Paris, France 13 8 USA 83 70

Percent of subjects selecting “unhealthy” for choice: What do you think of when you think of HEAVY CREAM? : whipped or unhealthy Females Males France 28 23 USA 68 48

Percent of subjects agreeing that they eat a “healthy diet” Females Males France 76% 72% USA 28% 38%

Attitudes regarding food and meat among American, French, Argentinean and Brazilian college students • • • Marle S. Alvarenga Paul Rozin Matthew B. Ruby Guillermina Rutszein Eve Richter Teri Kirby

If there was an inexpensive pill to safely satisfy nutritional needs and hunger without having to eat, I would take it % > = very true of me Argentina 15. 8% Brazil 11. 3% France 5. 9% USA 14. 3%

Enjoying food is one of the most important pleasures in my life % > = very true of me Argentina 52. 8% Brazil 56. 1% France 66. 2% USA 53. 1%

In general, I am more concerned with the caloric content of food than the taste % > = very true of me Argentina 5. 3% Brazil 4. 4% France 2. 5% USA 34. 6%

Eating alone does not bother me % > = very true of me Argentina 54. 8% Brazil 51. 5% France 41. 7% USA 51. 8%

P Argentina Brazil I P I C C France P I C USA P I C C=current I= ideal P=peer ideal

Argentina PI Brazil ICP France CPI USA ICP C=current I= ideal P=peer ideal C ? ?
: kg/capita/year • • France 13. 3 USA")
Beef consumption by country (2007 or 2008): kg/capita/year • • France 13. 3 USA 28. 5 Brazil 37. 6 Argentina 71. 8
")
Mean Liking for beef (-100 to +100)

Free Assoc to BEEF: most common words Argentina Brazil France USA FEMALE Asado 36 saborosa 66 viande 130 Cow 52 Rojo 31 churrasco 59 steak 23 Meat 24 sabroso 29 sangue 43 rouge 22 Hamburger 22 Comida 19 Gordura; succulente 18 vache 20 Disgusting 19 Animal 13 Red 18 Jugoso 17 MALE Asado 17 churrasco 39 viande 68 Cow 27 Sabroso, delcicioso, rico, saborosa 31 10 Steak 26 Steak 18 Vaca, sabrosos, grosso sangue 25 vache 17 Meat 15 Jugoso. milanesa 3 Proteina 17 sang 8 Hamburger, red 7 Boi/vaca 15 rouge 5
 Word 1 - Word 2 Cow")
Sample free associations to “beef” USA (with valence) Word 1 - Word 2 Cow (0) Word 3 Sum Valence Ambivalence Burger (1) Baseball (1) +2 No Fat (-1) Unhealthy Cholesterol (-1)_ (-1) -3 No Fat (-1) Protein (1) Meat (1) +1 Yes
")
Valence of 3 beef free associations (-3 to +3)

The food environment • With Claude Fischler, Kim Kabnick and Erin Pete

About 2001

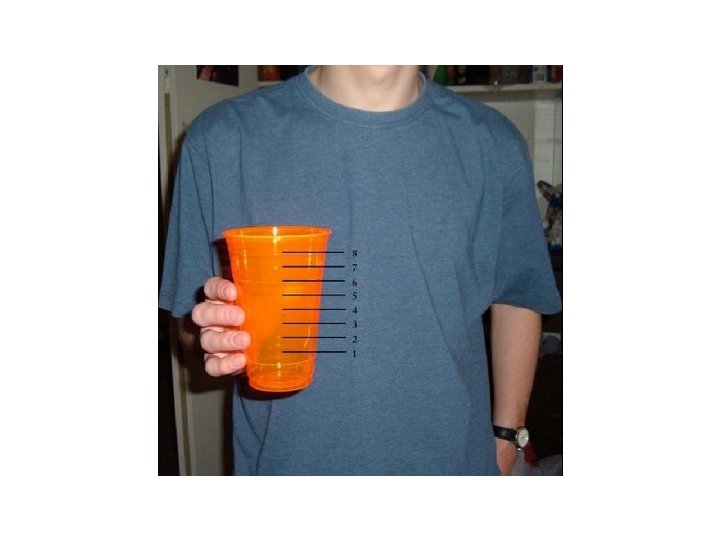
Restaurant portion size

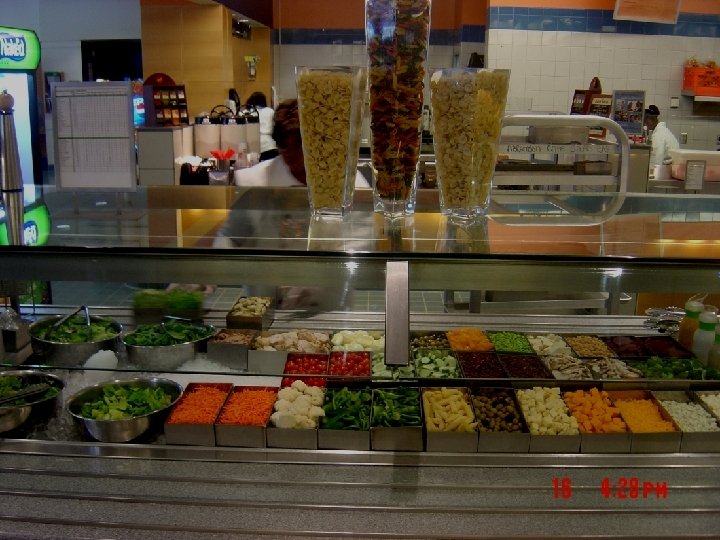
Supermarket food portions

Supermarket non-food portions
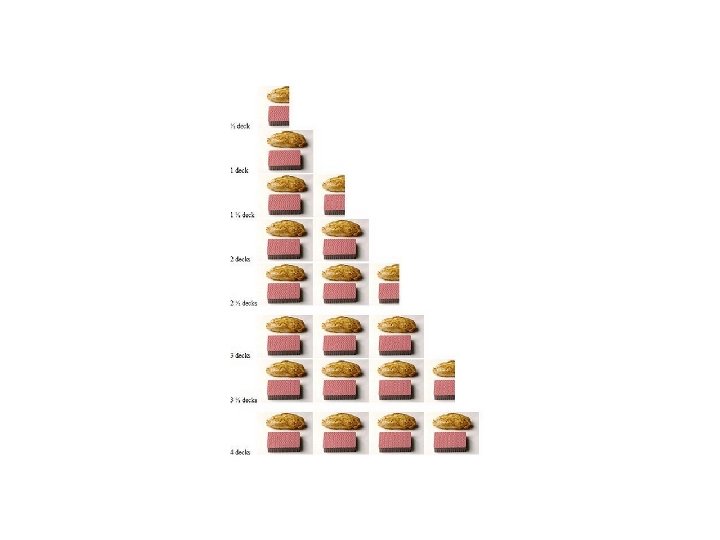
 (1 to 8 half card decks)")
Mean Portion size Mean own portion size (chicken) (1 to 8 half card decks)
 (8 levels)")
Mean Portion size Mean own portion size (coca cola) (8 levels)
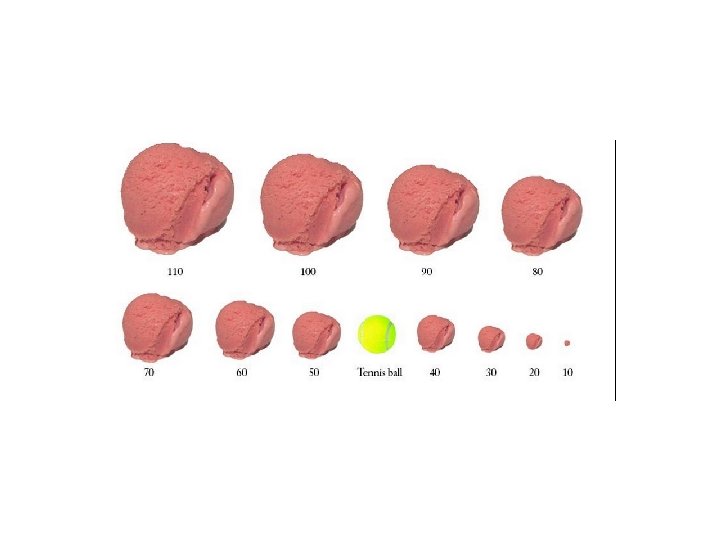
 (scoop size: 10 -110)")
Mean Portion size Mean own portion size (ice cream) (scoop size: 10 -110)

Obesity: Changing the person • Dieting • Nutrition information and education Education about science, risks, benefits • Changing preferences and intake • Failure of obesity treatments and dieting • Only bariatric surgery • Think about height

Changing the food environment • Accessibility • Small accumulated value • 1 -3 standard coca cola cans a week
 •")
Salad bar • Reaching over to the middle (about 5% reduction in calories) • Spoon versus tongs (about 5% reduction in calories)

Portion size • Amnesia study: Availability

Environment Changes • Glass size • Plate size: Brian Wansink • Very large serving amounts (Wansink: soda)

In a student cafeteria, when students are served a 50% larger portion of macaroni and cheese (right) they eat more, and don’t compensate by eating less of the rest of the meal Diliberti, Rolls et al. , 2004
 • Free access in lobby to")
Cultural norms: Unit bias (Geier and Rozin, 2006) • Free access in lobby to bowl of M&Ms, with either teaspoon or tablespoon • Amount taken with tablespoon is 70% greater • Similar effects with large or small tootsie rolls or pretzels

Cumulating increments • James Hill, David Levitsky, Barbara Rolls, Marion Nestle, Paul Rozin et al. • Some evidence that portion change effects may endure, and are not fully compensated for over at least 2 weeks (Rolls, Levitsky)

Segmentation and consumption interrupts About 50% reduction Lay’s stacked potato chips Geier, Wansink and Rozin

35 calories/wedge

Government versus Industry initiation • Let the free market do it (organic, fat free, calorie free) • Smaller portion sizes

Energy Expenditure • • • Suburban Life Malls The car culture Small but continuing increments Role for government: e. g. , better and cheaper public transportation


Learning from the French
 Freshness")
Some French-American differences • • Portion size Eating time Eating sociality/ conversation (conviviality) Freshness and taste (vs shelf life) priority in foods Degree of snacking and snacking opportunities Differences in actual foods consumed (e. g. , wine) Differences in variety of food consumed (Drewnowski et al. ) • Walk/bicycle vs car orientation
 • Focus")
We can learn from the French in this domain (not all domains) • Focus on the environment to try to reduce food intake and waist lines • Don’t reduce the pleasure of eating • Make small changes that encourage more exercise and less eating • Let the effects of those small changes accumulate, and…. .

Vetri Foundation Charter School Lunch: Feb, 2013

$1. 50 Vetri Foundation Charter School Lunch: Feb 2013

Yes, eating can be bad for health

But NOT EATING is much worse for health Adios
1850aefc71902d1212596041e2b7fd02.ppt