

bc0545541a5f4d0966193f257f344be7.ppt
- Количество слайдов: 60
 The PRISM Approach to Mapping Climate in Complex Regions Christopher Daly Director Spatial Climate Analysis Service Oregon State University Corvallis, Oregon
 Spatial Climate Analysis Service Mission • Service • Provide innovative, state-of-the science spatial climate products and services to clients worldwide • Research • Maintain scientific research and development programs that provide the basis for products and services • Education • Advance “geospatial climatology” as an emerging discipline
 SCAS and PRISM are Unique • SCAS is the only center in the world dedicated solely to the mapping of climate • PRISM climate mapping technology has been continuously developed, and repeatedly peer-reviewed, since 1991 • PRISM climate maps are the “gold standard” by which others are evaluated • SCAS has become a leader in climate mapping products and technology worldwide

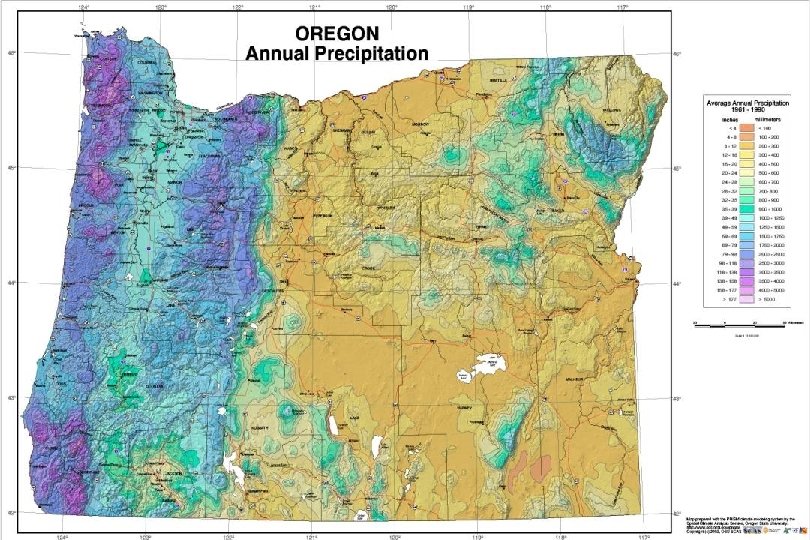
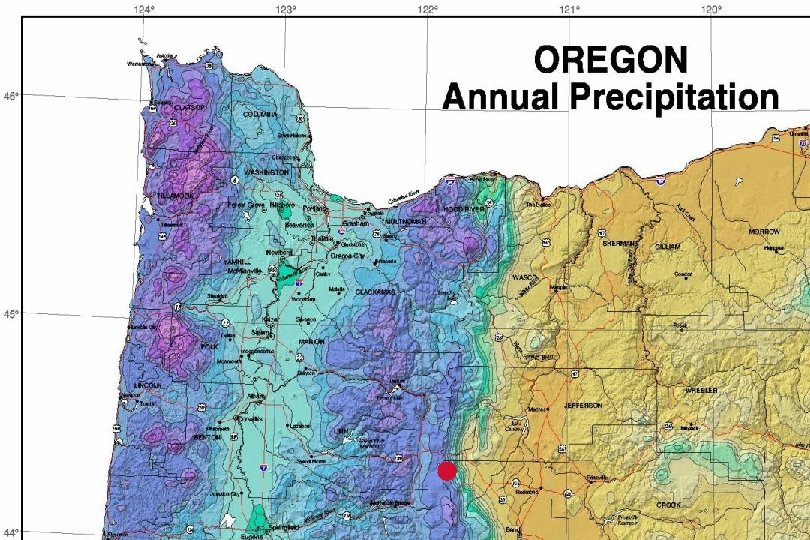
 Oregon Annual Precipitation
 Oregon Annual Precipitation
 Oregon Annual Precipitation
 Oregon Annual Precipitation
 Oregon Annual Precipitation
 Rationale - Observations are rarely sufficient to directly represent the spatial patterns of climate - Human-expert mapping methods often produce the best products, but are slow, inconsistent, and non-repeatable - Purely statistical mapping methods are fast and repeatable, but rarely provide the best accuracy, detail, and realism Therefore… - The best method may be a statistical approach that is automated, but developed, guided and evaluated with expert knowledge
 Knowledge-Based System KBS - Knowledge acquisition capability – Elicit expert information - Knowledge base – Store of knowledge - Inference Engine – Infer solutions from stored knowledge - User interface – Interaction and explanation - Independent verification – Knowledge refinement
 PRISM Parameter-elevation Regressions on Independent Slopes Model - Generates gridded estimates of climatic parameters - Moving-window regression of climate vs. elevation for each grid cell - Uses nearby station observations - Spatial climate knowledge base weights stations in the regression function by their climatological similarity to the target grid cell
 Oregon Annual Precipitation Interface
 PRISM Knowledge Base - Elevation Influence on Climate
 1961 -90 Mean January Precipitation, Sierra Nevada, CA, USA Oregon Annual Precipitation
 1961 -90 Mean August Max Temperature, Sierra Nevada, CA, USA Oregon Annual Precipitation
 1963 -1993 Mean November Precipitation, Puerto Rico
 1963 -93 Mean June Maximum Temperature, Puerto Rico
 1971 -90 Mean February Precipitation, European Alps
 1961 -90 Mean September Max Temperature, Qin Ling Mountains, China Oregon Annual Precipitation
 PRISM Moving-Window Regression Function Weighted linear regression 1961 -90 Mean April Precipitation, Qin Ling Mountains, China
 Governing Equation Moving-window regression of climate vs elevation y = 1 x + 0 Y = predicted climate element x = DEM elevation at the target cell 0 = y-intercept 1 = slope x, y pairs - elevation and climate observations from nearby climate stations
 Station Weighting Combined weight of a station is: W = f {Wd, Wz, Wc, Wf, Wp, Wl, Wt, We} - Distance Elevation Clustering Topographic Facet (orientation) - Coastal Proximity Vertical Layer (inversion) Topographic Index (cold air pooling) Effective Terrain Height (orographic profile)
 PRISM Knowledge Base Elevation Influence on Climate - Terrain-Induced Climate Transitions (topographic facets, moisture index) -
 Rain Shadow: 1961 -90 Mean Annual Precipitation Oregon Cascades Portland Mt. Hood Eugene Dominant PRISM KBS Components Mt. Jefferson 2500 mm/yr Elevation 2200 mm/yr Terrain orientation rs Th ree te Sis Terrain steepness Sisters 350 mm/yr Moisture Regime Redmond N Bend
 1961 -90 Mean Annual Precipitation, Cascade Mtns, OR, USA
 1961 -90 Mean Annual Precipitation, Cascade Mtns, OR, USA
 Olympic Peninsula, Washington, USA Flow Direction
 Topographic Facets = 4 km = 60 km
 Mean Annual Precipitation, 1961 -90 Oregon Annual Precipitation Max ~ 7900 mm 3452 mm Full Model 3442 mm 4042 mm Max ~ 6800 mm
 Mean Annual Precipitation, 1961 -90 Max ~ 4800 mm 3452 mm 3442 mm 4042 mm Facet Weighting Disabled
 Mean Annual Precipitation, 1961 -90 Oregon Annual Precipitation Max ~ 3300 mm 3452 mm 3442 mm 4042 mm Elevation = 0
 Mean Annual Precipitation, 1961 -90 Oregon Annual Precipitation Max ~ 7900 mm 3452 mm Full Model 3442 mm 4042 mm Max ~ 6800 mm
 PRISM Knowledge Base - Elevation Influence on Climate - Terrain-Induced Climate Transitions (topographic facets, moisture index) - Coastal Effects
 Coastal Effects: 1971 -00 July Maximum Temperature Central California Coast – 1 km Sacramento Stockton San Francisco Oakland 34° Fremont San Jose Preferred Trajectories Coastal Proximity Oce an 27° 20° Pac ific N Elevation Santa Cruz Monterey Dominant PRISM KBS Components Salinas Inversion Layer Hollister
 1961 -90 Mean July Maximum Temperature, Central California, USA Coastal Proximity Weighting OFF Coastal Proximity Weighting ON
 PRISM Knowledge Base - Elevation Influence on Climate - Terrain-Induced Climate Transitions (topographic facets, moisture index) - Coastal Effects - Two-Layer Atmosphere and Topographic Index
 1971 -2000 January Temperature, HJ Andrews Forest, Oregon, USA TMAX-Elevation Plot for January Layer 1 Layer 2 TMIN-Elevation Plot for January Layer 1 Layer 2
 Mean Annual Precipitation, Hawaii
 United States Potential Winter Inversion
 Western US Topographic Index
 Central Colorado Terrain and Topographic Index Gunnison Terrain Gunnison Topographic Index
 January Minimum Temperature Central Colorado Gunnison Valley Bottom Elev = 2316 m Below Inversion Lapse = 5. 3°C/km T = -16. 2°C
 January Minimum Temperature Central Colorado Gunnison Mid-Slope Elev = 2921 m Above Inversion Lapse = 6. 9°C/km T = -12. 7°C
 January Minimum Temperature Central Colorado Gunnison Ridge Top Elev = 3779 m Above Inversion Lapse = 6. 0°C/km T = -17. 9°C
 Inversions – 1971 -00 January Minimum Temperature Central Colorado N Taylor Park Res. Crested Butte -18° Dominant PRISM KBS Components Elevation Topographic Index -13° Lake City Gunnison -18°C Inversion Layer
 PRISM 1971 -2000 Mean January Minimum Temperature, 800 -m “Banana Belt” e rd g aina r ai old C Snake Plain
 Inversions – 1971 -00 July Minimum Temperature Northwestern California N c Pacifi Ocean Willits Ukiah 9° Lake Pilsbury. 10° 17° Cloverdale Lakeport Cle 17° Elevation Inversion Layer Topographic Index ar La ke 12° 16° Dominant PRISM KBS Components Coastal Proximity
 PRISM Knowledge Base Elevation Influence on Climate - Terrain-Induced Climate Transitions (topographic facets, moisture index) - Coastal Effects - Two-Layer Atmosphere and Topographic Index - Orographic Effectiveness of Terrain (Profile) -
 United Orographically Effective Terrain States Effective Terrain
 Oregon Annual Precipitation
 PRISM Knowledge Base Elevation Influence on Climate - Terrain-Induced Climate Transitions (topographic facets, moisture index) - Coastal Effects - Two-Layer Atmosphere and Topographic Index - Orographic Effectiveness of Terrain (Profile) - Persistence of climatic patterns (climatologicallyaided interpolation) -
 Oregon Annual Precipitation Leveraging Information Content of High-Quality Climatologies to Create New Maps with Fewer Data and Less Effort Climatology used in place of DEM as PRISM predictor grid
 PRISM Regression of “Climate vs Climate” or “Weather vs Climate” 20 July 2000 Tmax vs 1971 -2000 Mean July Tmax
 Upcoming Products - Updated 1971 -2000 mean monthly P, Tmax, Tmin maps for the US at 800 -m resolution (USDA-NRCS, NPS, USFS) - Spatial-Probabilistic QC system for SNOTEL observations - Targeted climatologies for NWS River Forecast Centers (NWS Western Region) - Extended monthly time series maps of P, Tmax, Tmin, Tdew for climate monitoring
 Future Directions - Engage in collaborative projects to develop the use of PRISM and PRISM climatologies for downscaling numerical weather prediction models - Continue to develop technology to move to smaller time steps and towards real time operation - Explore using remotely-sensed data to improve PRISM accuracy in under-sampled areas (and vice-versa) - Continue to develop PRISM’s Spatial Climate Knowledge Base