53fbf8cf8e60f379ad966d9351e98e23.ppt
- Количество слайдов: 86


The Obesity Epidemic: Trends, Causes, Effects and Ways to Reduce the Incidence Karen Mason, Ph. D. , R. D. Western Kentucky University

Obesity Statistics The number of overweight and obese Americans has continued to increase since 1960 65. 1% of adult Americans are categorized as being overweight or obese (NHANES) Each year, obesity causes at least 300, 000 deaths in the U. S.

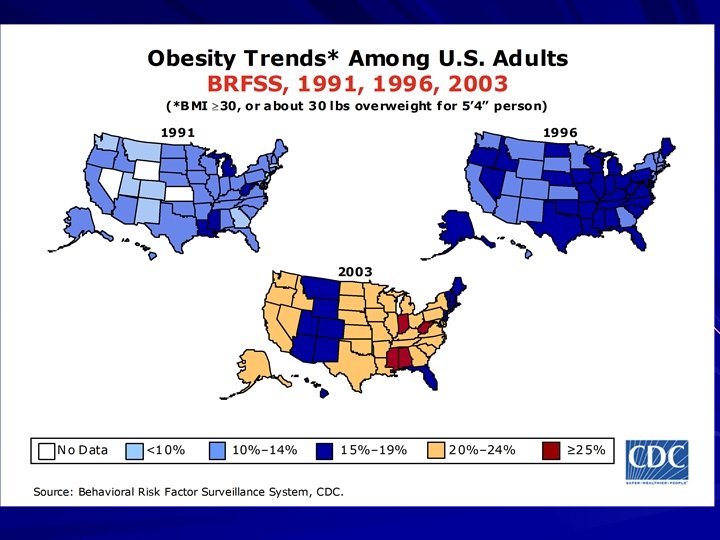
Obesity Trends U. S. Adults U. S. Children/Adolescents Worldwide

Obesity Definitions Obesity: having a very high amount of body fat in relation to lean body mass, or Body Mass Index (BMI) of 30 or higher. Overweight: having a BMI of 25 -29. 9 Body Mass Index (BMI): – a measure of an adult’s weight in relation to his or height – the adult’s weight in kilograms divided by the square of his or height in meters

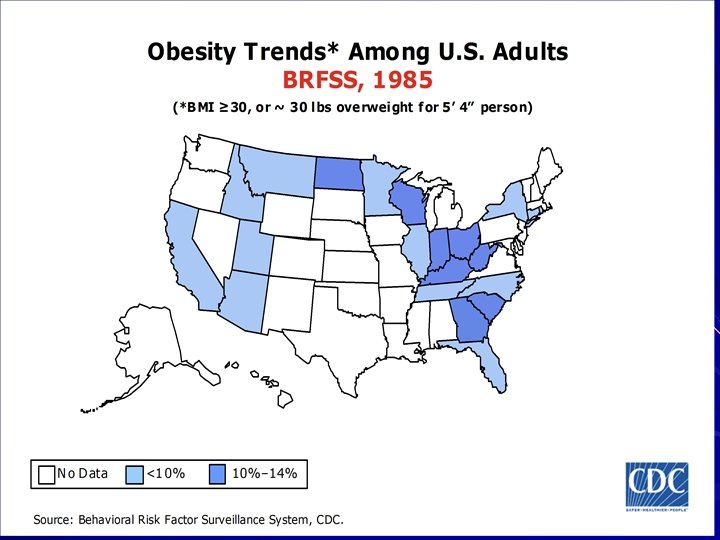
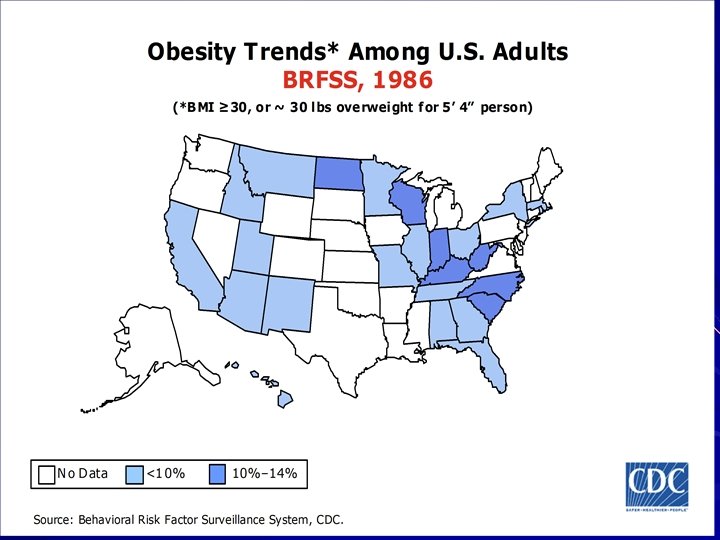
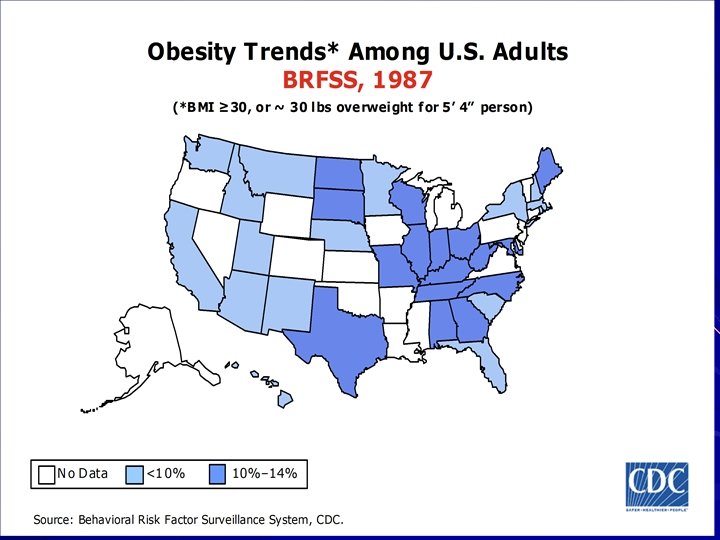
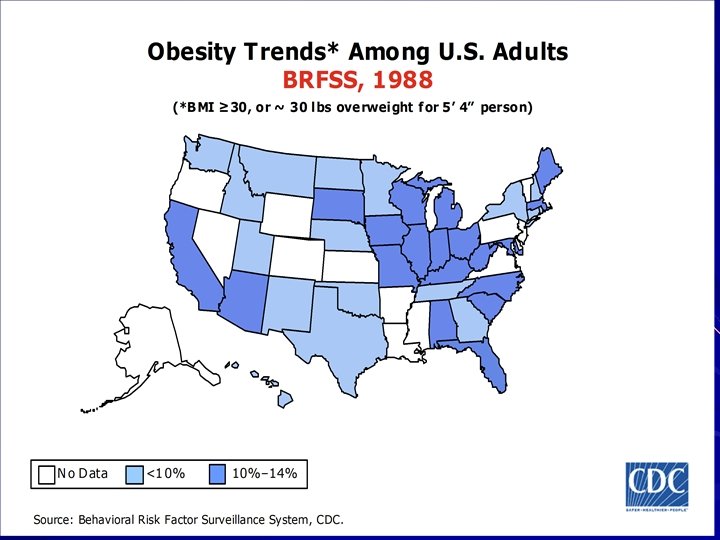
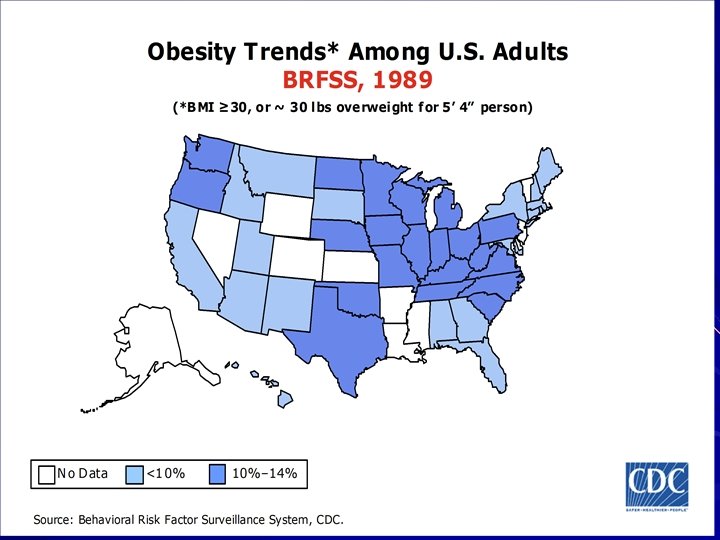
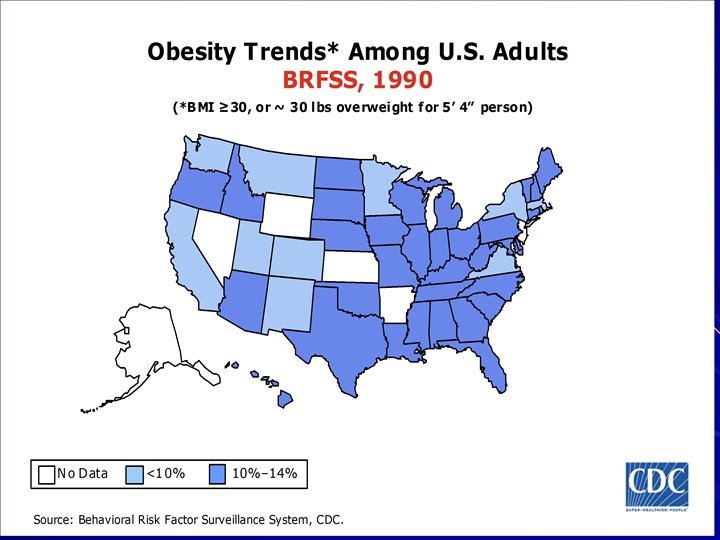
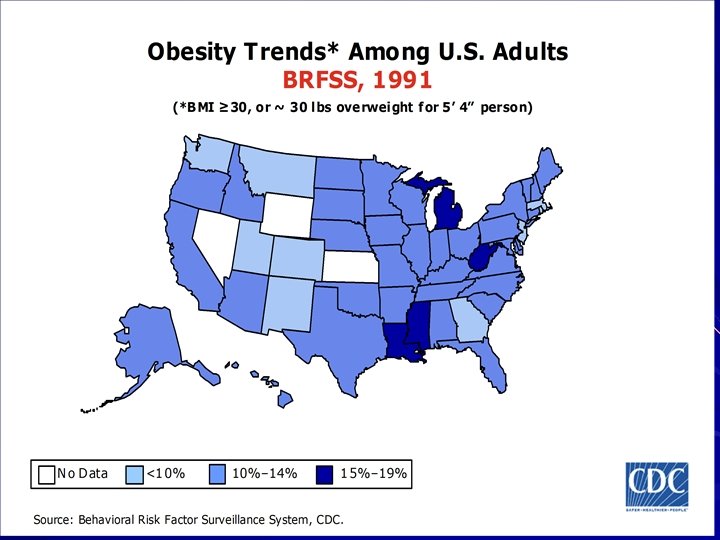
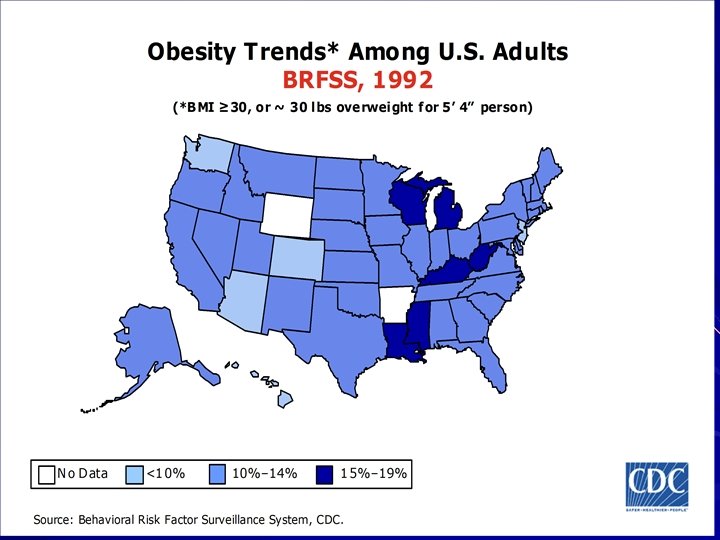
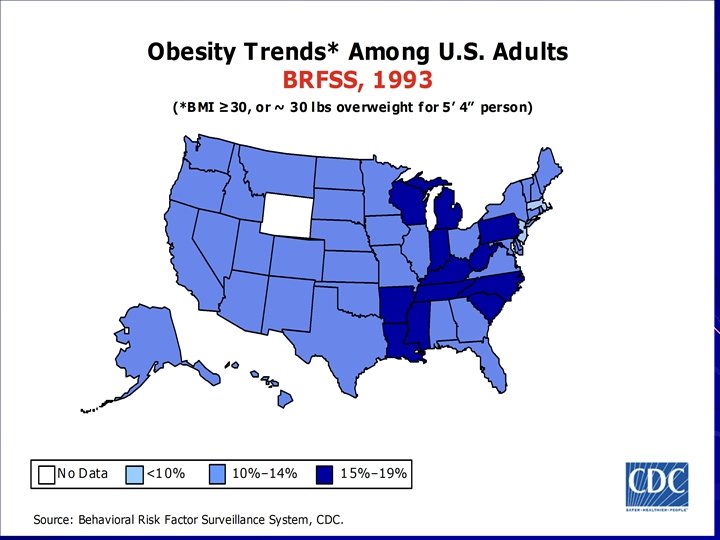
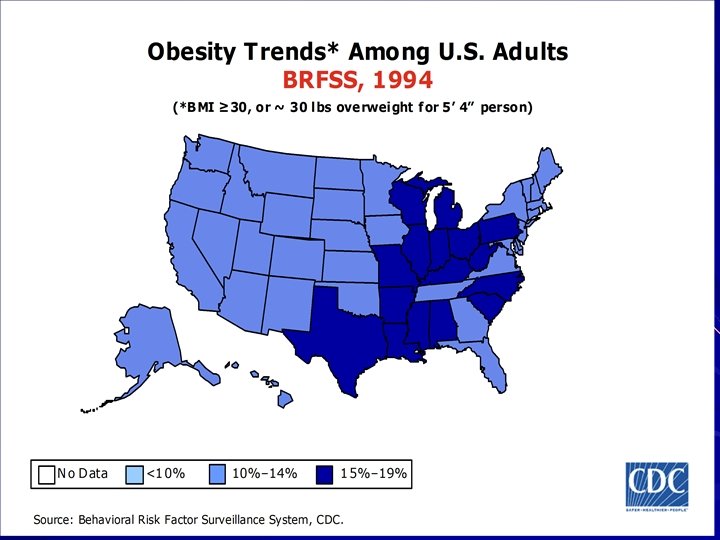
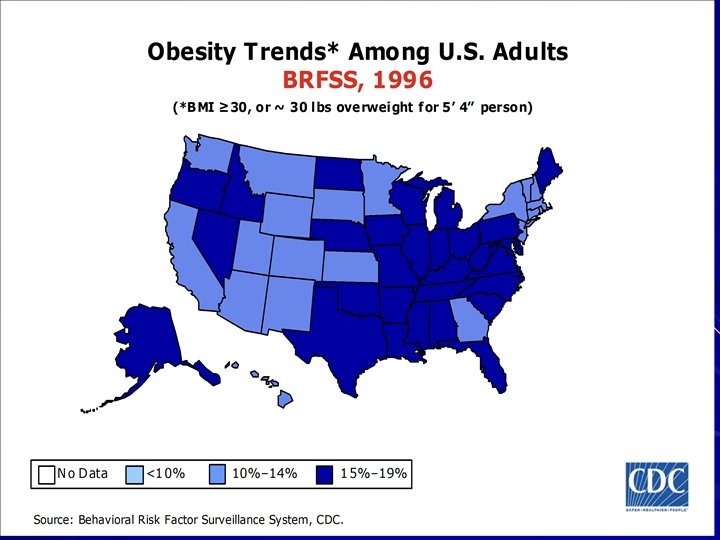
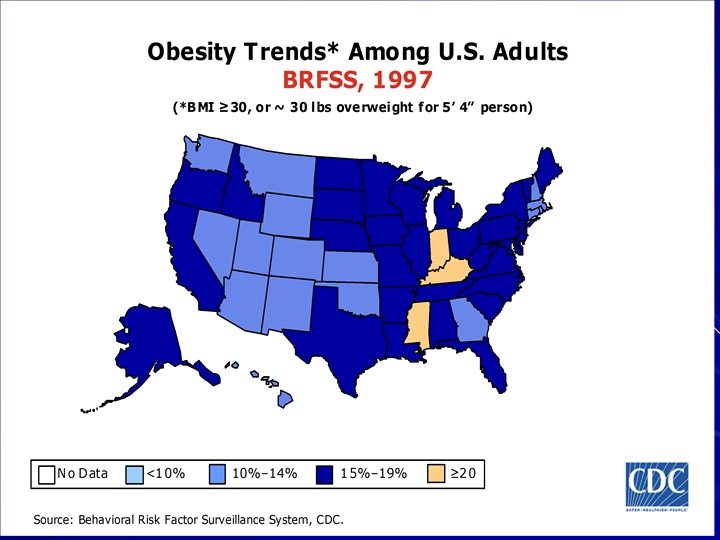
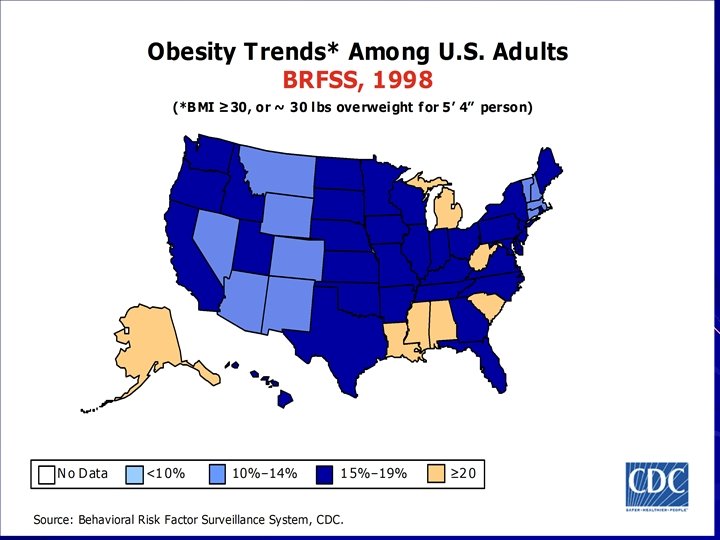
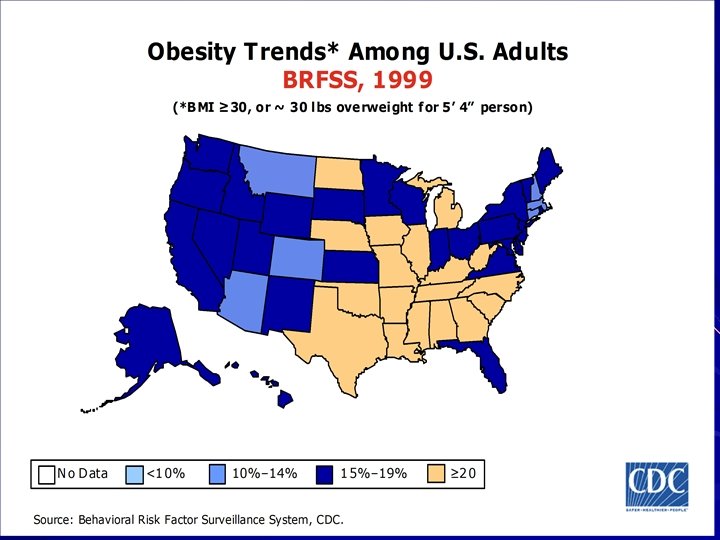
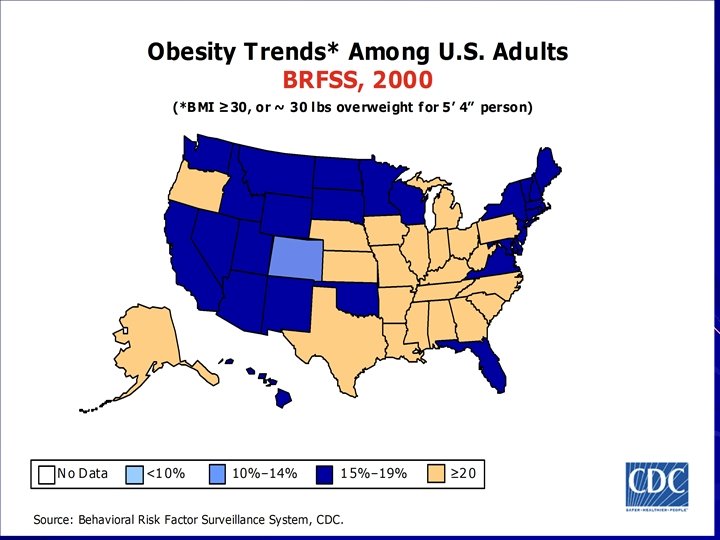
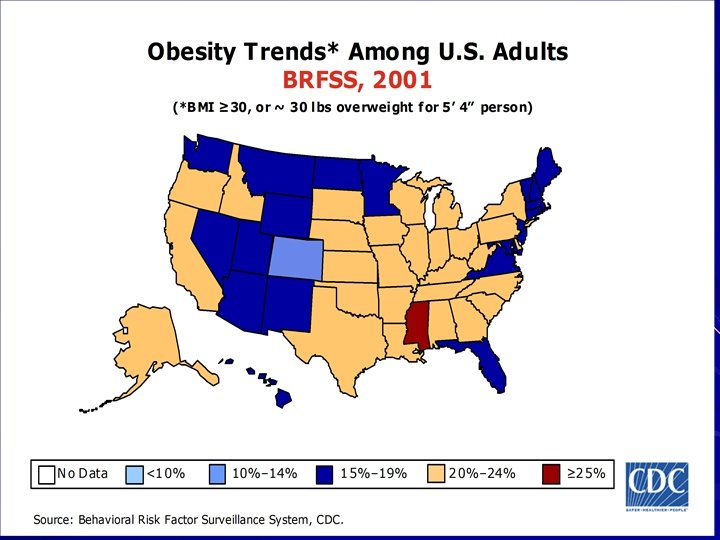
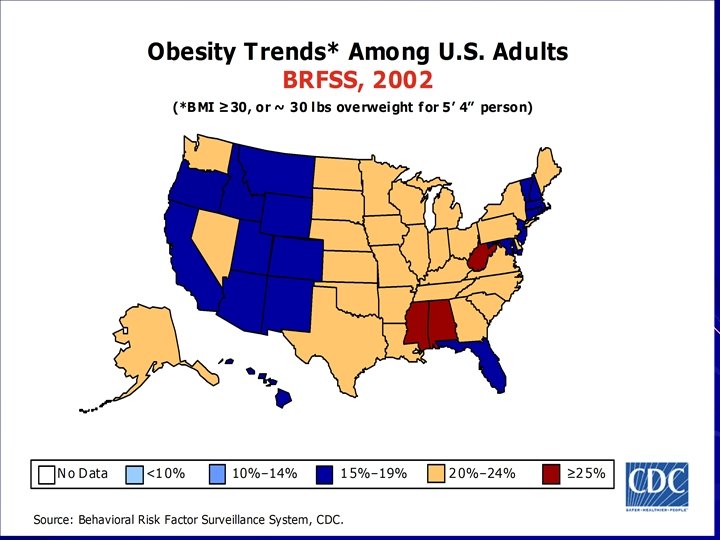
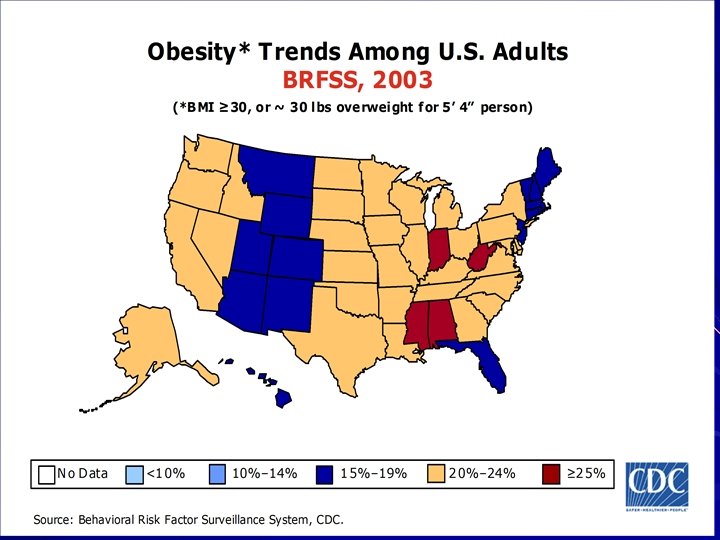
Obesity Trends Among U. S. Adults between 1985 and 2003 Source of the data: CDC’s Behavioral Risk Factor Surveillance System (BRFSS) Collected by state health departments each year Data collected from a series of monthly telephone interviews with U. S. adults


Overweight in Children and Adolescents Based on BMI-for-Age Percentiles

BMI-for-Age for Girls

Overweight in Children and Adolescents Based on BMI-for-Age Percentiles 85 th percentile – Overweight (Note: CDC considers “at risk for overweight”) – Equivalent to the adult BMI of 25 95 th percentile – Obese (Note: CDC considers overweight) – Equivalent to the adult BMI of 30

Trends of overweight children From 1980 to 2002 Overweight children rose from 7% to 15. 8% Overweight teenagers tripled from 5% to 16. 1% Based on the National Health and Nutrition Examination Survey published in JAMA 291: 2847 -50, 2004

Comparison of Kentucky’s High School Students to the U. S. Source: Youth Behavioral Risk Surveillance, 2003

Worldwide obesity trends Obesity is a global problem Rapid increase in lower- and middleincome developing countries Increase with the poor Source: Popkin and Gordon-Larsen, 2004

Worldwide obesity statistics More than 1 billion adults are overweight and at least 300 million of them are clinically obese Source: World Health Organization, 2005

Obesity Etiology Genetics Calorie Consumption Physical inactivity

Obesity Etiology Energy Imbalance: Calories consumed are greater than calories used

Obesity and Genetics Identical twin studies support that genes influence body weight and body fat. However, the obesity epidemic cannot be explained by changes in the human genome. Weight gain results from an interaction between genetics and environment (“obesity-promoting environment”). Source: Loos and Rankinen, 2005

Obesity and Calorie Consumption Americans spent 46% of their food budget away from home in 2002 and 27% in 1962. (Variyam 2005) Table-service restaurants now serve from 12 -inch plates rather than the standard 10½-in plates

Obesity and Calorie Consumption Individuals consume more calories when served larger portions. Americans consume more than 53 teaspoons of added sugars each day (Gardner 2001).

Obesity and Calorie Consumption From 1971 -2000, the average daily caloric intake rose: – for men, 2, 450 kcals to 2, 618 kcals – for women, 1, 542 kcals to 1, 877 kcals (http: //www. cdc. gov/nchs/) 62% of Americans are unaware the portion sizes have increased in the last 10 -15 years.
 Food Then Now French")
Larger Portion Sizes (comparison of portion sizes 15 years ago) Food Then Now French fries 2 oz >4 oz Deli bagel 2 oz 4 -7 oz Muffin 2 oz 6 -8 oz Soda 6 ½ oz 12 -20 oz Chips ½ - 1 oz 2 -4 oz Candy bar 1 ½ oz 2 -4 oz

CHEESEBURGER 15 -20 Years Ago 333 calories Today How many calories are in today’s cheeseburger?

CHEESEBURGER 15 -20 Years Ago Today 333 calories 590 calories Calorie Difference: 257 calories

FRENCH FRIES 15 -20 Years Ago 210 Calories 2. 4 ounces Today How many calories are in today’s portion of fries?

FRENCH FRIES 15 -20 Years Ago 210 Calories 2. 4 ounces Calorie Difference: 400 Calories Today 610 Calories 6. 9 ounces

SODA 15 -20 Years Ago 85 Calories 6. 5 ounces Today How many calories are in today’s portion?

SODA 15 -20 Years Ago 85 Calories 6. 5 ounces Today 250 Calories 20 ounces Calorie Difference: 165 Calories

Would you like a combo meal? “value meals” and “combo meals” are used for profit by the food companies. When people are served more food, they eat more food. For a small price, you get more calories and saturated fat.

Now that’s a value! Mc. Donald’s Quarter Pounder w/Cheese Extra Value Meal Wendy’s Classic Double w/Cheese Combo Meal 530 calories 13 g saturated fat 1190 calories 17 g saturated fat 760 calories 19 g saturated fat 1360 calories 26 g saturated fat $1. 41 $1. 57

A better choice at Mc. Donald’s Mc. Grilled Chicken sandwich 400 calories, 17 g fat, 3 g saturated fat Side salad 100 calories, 6 g fat, 3 g saturated fat Low fat Italian salad dressing 50 calories Water

Obesity and Physical Inactivity

Statistics of physical inactivity More than 50% of U. S. adults do not get enough physical activity More than a third of young people in grades 9– 12 do not regularly engage in vigorous physical activity. Daily participation in high school physical education classes dropped from 42% in 1991 to 28% in 2003. Source: CDC, 2005

Maintaining a Healthy Weight is a Balancing Act Calories In = Calories Out How long will you have to walk leisurely in order to burn those extra 400 calories? * *Based on 160 -pound person

Calories In = Calories Out If you walk leisurely for 1 hour and 10 minutes you will burn approximately 400 calories. * *Based on 160 -pound person

Maintaining a Healthy Weight is a Balancing Act Calories In = Calories Out How long will you have to work in the garden to burn those extra calories? * *Based on 160 -pound person

Calories In = Calories Out If you work in the garden for 35 minutes, you will burn approximately 165 calories. * *Based on 160 -pound person

Children and TV watching Children and adolescents who watched the most TV were more obese than peers who watched less TV.

Benefits of physical activity Reduced risk for many chronic diseases Weight control Promotes healthy bones, muscles, and joints Reduces symptoms of anxiety and depression Associated with fewer hospitalizations, physician visits, and medications. Source: CDC, 2005

Physical activity recommendations Adults: minimum of 30 minutes of moderate-intensity physical activity on most days of the week Children and adolescents: at least 60 minutes of physical activity most days of the week Source: Dietary Guidelines for Americans, USDA, 2005

Effects of Obesity Medical/health Economic Social/Psychological

Health Effects of Obesity Mortality – increased risk of premature death Source: Sizer and Whitney, 2006

Health Effects of Obesity Morbidity – Type 2 Diabetes – Hypertension – Heart disease – Some cancers – Breathing Problems – Arthritis – Reproductive Complications

Prevalence of disease in people who are overweight or obese Type 2 Diabetes – 67% of all diabetics have a BMI 27 Hypertension – 41. 9% of men and 37. 8% of women with a BMI greater than 30 have high blood pressure High blood cholesterol – 22% of men and 27% of women with a BMI greater than 30 have high blood cholesterol Cancer – A BMI greater than 25 accounts for 14% of cancer deaths among men and 20% among women Source: http: //win. niddk. nih. gov/statistics/index. htm (Weight Control Information Network)

Economic Effects of Obesity American families, businesses, and governments were estimated to have spent $117 billion in 2001 on obesity related problems, primarily health care Annual medical spending due to overweight and obesity was estimated to be $92. 6 billion dollars in 2002 Source: http: //win. niddk. nih. gov/statistics/index. htm (Weight Control Information Network)

Social/Psychological Effects of Obesity More likely to be judged by appearance Less often sought after for romance Less often hired Associated with low self-esteem and poor body image Stereotyped as lazy and self-indulgent Sources: Sizer and Whitney, 2006 and Viner 2005

Ways to Reduce the Incidence of Obesity

Weight reduction Prevention of weight gain Treatment of weight gain

Select Findings from the Childhood Obesity Resource Planning Project Funded through an American Academy of Pediatrics CATCH Planning Grant

CATCH Grant Pediatricians, Parents, and Educators were surveyed in the Barren River Area Development District (10 counties in Bowling Green area)

Parent’s Identification of Children’s Overweight Status

Parents’ Attitudes and Beliefs 73. 4% of parents believe their MD would tell them if their child was overweight Most parents believe that overweight children have an increased risk for health problems However, most parents are not concerned about children’s weight Most parents believe talking to children about their weight will cause eating disorders or problems with self-esteem

MDs’ Attitudes and Beliefs Many MDs do not discuss dietary changes or exercise with their overweight patients Many MDs believe that parents/family lack motivation for child to lose weight

Educators’ Attitudes and Beliefs They feel they have no control over the amount of activity student get per day. They feel it is important to have healthy snack options at school, but most (91%) used food as an incentive or reward 88% of KY schools use food as rewards

How to Get Involved

Site-Based Councils Set policies for what can and cannot be sold in schools Reevaluate the contracts between your district and soft drink industries Require schools to have daily physical activity Schools should have the equipment and supervision for children to meet physical activity needs
 bans soft")
Recent KY Legislation Kentucky lawmakers passed SB 172 in March 2005 1) bans soft drink sales in elementary school during the school day 2) limits retail fast food in cafeterias to once a week 3) requires each school district to have a credentialed nutrition specialist to plan lunches

School Administrators Promote healthier eating and physical activity in your school Have a Health Educator, Registered Dietitian, County Extension Agent or School Foodservice Director come to your faculty/staff meetings to bring unity on this issue Give students healthier options in the vending machines

Foodservice Directors Make healthy food options appealing Provide low-fat, low-calorie, and low-sugar food items Reduce access to high-fat, high-calorie, high-sugar foods, and excessive portion sizes Plan school menu with a group of parents and teachers

Information for Foodservice Directors High school students changed their food choices based solely on the availability of nutrition labels posted at the POS - more healthful entrees increased (Conklin 2005)

Teachers Have some form of movement in the health curriculum For bake sales/class parties, have parents bring healthy snacks Do not reward students with food or punish students by taking away recess Raise awareness to students and staff on the benefits of physical activity Have a health educator speak to students on ways to be more active

Parents Limit TV, movies, video and computer games for children to 1 -2 hours per day (American Academy of Pediatrics) Encourage child to be involved in organized sports, 4 -H programs, outdoor activities, active playtime at home Enjoy regular exercise with the entire family Assign active chores to all family members Contact your school/school board to let them know that you are concerned about food and physical activity at school
 Be a healthy role model for")
Parents Buy healthier snacks (like fruit and vegetables) Be a healthy role model for your children Reduce the consumption of soft drinks and snack foods Buy only 100% fruit juice Consuming adequate calcium Eat meals together at the dinner table Avoid watching TV during mealtimes Limit fast food eating to no more than once per week Avoid using food as a reward or using the lack of food as a punishment

Civic Leaders Work with city planners and engineers to plan for sidewalks and bicycle paths Designate a place and promote a farmer’s market Create a community coalition to address childhood overweight in your area

Success stories http: //www. cdc. gov/healthyyouth/nutrition/Making -It-Happen/ 1. Establish nutrition standards for competitive foods 2. Influence food and beverage contracts 3. Make more healthful foods and beverages available 4. Adopt marketing techniques 5. Limit student access to competitive foods 6. Use fundraising activities and rewards

Growing Healthy Kids in Kentucky Fourth Annual Conference November 3 -4, 2005 Lexington, Kentucky www. kyeatright. org

Sources Center for Disease Control. www. cdc. gov. Accessed July 2005. Conklin, MT, DA Cranage, and CU Lambert. Nutrition Information at Point of Selection Affects Food Chosen by High School Students. The Journal of Child Nutrition and Management. 29(1) Spring 2005 Gardner, G. Being Overweight Now Epidemic. Vital Signs. Pages 136 -137. 2001 Hedley, AA, CL Ogden, C. L. Johnson, MD Carroll, LR Curtin, and KM Flegal. Prevalence of Overweight and Obesity Among US Children, Adolescents, and Adults, 1999 -2002. Journal of the American Medical Association

Sources Loos, RJF and T Rankinen. Gene-Diet Interactions on Body Weight Changes. Journal of the American Dietetic Association. 105: S 29 -S 34. 2005 Popkin, BM and P Gordon-Larsen. The Nutrition transition: worldwide obesity dynamics and their determinants. International Journal of Obesity. 28: 52 -59. 2004 Variyam, JN. Nutrition Labeling in the Food-Away-From-Home Sector. ERS Report Summary. April 2005 Viner, RM and TJ Cole. Adult socioeconomic, educational, social, and psychological outcomes of childhood obesity: a national birth cohort study. British Medical Journal. 330(7504): 1354 -7. 2005 Youth Behavioral Risk Surveillance. Available online at http: //www. cdc. gov/mmwr/PDF/SS/SS 5302. pdf. 2003.

53fbf8cf8e60f379ad966d9351e98e23.ppt