

d5d6e25cfec1568e35562da7688d3ea8.ppt
- Количество слайдов: 63
 The next generation tool to reduce non-technical losses Denis Maia Marcos Aurélio Madureira da Silva CEO denis@choice. com. br Corporate Commercial Director madureira@cataguazes. com. br
 Agenda Ø Brazilian electricity market overview Ø NTLs concepts Ø SCL’s losses fighting history Ø New challenges to reduce NTLs Ø Revenue Intelligence concepts Ø Revenue Intelligence case study in SCL
 BRAZIL OVERVIEW Introdução o motivo da discussão 8, 500, 000 SQUARE KILOMETERS Ø Identifique-se Ø Informe 62 ELECTRIC UTILITIES AROUND 180 MILLION INHABITANTS AROUND 53 MILLION CUSTOMERS
 Brazil – Electrical Sector Ø Electrical Companys o o o Ø Regulatory and Control o o o Ø Generation (almost all State owned) Trasmission(almost all state owned) Distribuition (almost all privatized) ANEEL – Regulatory Agency ONS – G and T • Independent System Operator CCCE – Energy Trading • Contracts • Energy Bids • Spot Market Free customers
 Sistema Cataguazes- Leopoldina 1905 - 2005 Área: 1. 789 Km 2 Costumers : 137 thousand Inhabitants: 450 mil Sistema Cataguazes Market Share 2005 Northeast of Brazil SAELPA 0, 8% of Southeast 9, 0% of Northeast 2, 0% of Brasil Área: 54. 595 Km 2 Costumers : 861 thousand Inhabitants: : 3. 000 mil Brazil Área: 17. 419 Km 2 Costumers : 455 thousand Inhabitants: : 1. 800 mil Southeast of Brazil Área: 17. 331 Km 2 Costumers : 390 thousand Inhabitants: : 1. 200 mil REF: 2005 mar
 Sistema Cataguazes- Leopoldina 1905 - 2005 REVENUE PROTECTION IS PART OF A PERMANENT FINANCIAL POLICY
 Cash-flow consequences of NTLs : Vicious cycle Reduce EBITDA Reduce CAPEX Reduce Investment Capacity and Operational Efficiency NTLs reduce EVA EBITDA - Earnings Before Interest, Tax, Depreciation and Amortization; EVA - Economic Value Added; CAPEX - CAPital EXpenditures.
 SCL –Corporate Management Process GOALS BOD NEGOTIATION REPORTS MONITORING BUSINESS MANAGEMENT UNIT PROJECTS NEGOTIATION ACTION PLANS RELPORTS MONITORING DEPT. MANAGER NEGOTIATION REPORTS MONITORING OPERATOR
 What are Non-Technical Losses – NTLs ? Commercial Ø Frauds o o Receivables Administrative may be: Energy theft (illegal connections to the network) Meter tampering or bypasses Ø Meter errors Ø Frauds may be done by the customer or by professionals (third-party service providers and others)
 Ilegal Connection - Example
 Temporary Ilegal Connection - Example
 Meter bypass - Example
 Meter bypass - Example
 Revenue Recovery Concepts Ø When a fraud is detected : o o o The value of the consumed energy that was stolen and recovered, for the period of time that may be possible to prove recovered energy (KWh); From the total volume of consumed energy that has been stolen, one part is the really required energy and will continue to be consumed, but now will be invoiced aggregated energy (KWh); Another part is extra and was consumed only because it was “for free”, and will not be consumed anymore reduction of the required energy (KWh).
 NTLs : Commercial Receivables Administrative Ø Default Customers – Delayed Payments and no payment o Defaulter consumer (*) some will delay, some will not pay o Volume and aging of receivable accounts has HIGH CO$T IMPACT company bought energy and paid taxes but did not cash in. Increase company’s financial expenses o * Usually not accounted as NTL.
 NTLs : Commercial Receivables Ø Internal Administrative process flaws and database inconsistencies o o o Human and system errors (*) Incorrect tariff (*) Internal fraud (*) * Usually not accounted.
 may be greater than net profit !!! NTLs") Non-Technical Losses (NTLs) may be greater than net profit !!! NTLs
Non-Technical Losses (NTLs) may be greater than net profit !!! NTLs
 SCL - Commercial Losses Main Activities and Results Ø Main Activities o o o Ø Field Inspections Fix Irregular connections Fix Damaged Meters Fix metering instalations Fix bad registers Results o +50% reduction of commercial losses since 2001 until 2004 • 9% 2001 December • 4, 3% 2004 December
 Challenge : Reduce NTLs Ø PROFITABILY x AFFORDABLE SUPPLY RATES o o o Regulators push utilities to decrease commercial losses (refusing to transfer NTLs to the tariffs) Shareholders push top-management to achieve positive EVA (profits greater than cost of capital) Government, Regulators and Users push utilities increase quality of energy while reducing rates
 Challenge : How to Reduce NTLs Ø Lack of human and financial resources to perform all necessary actions o o o Field investigation, service orders to reduce fraud / theft / commercial losses Debt negotiation, consumer disconnection (where permited by law) to reduce receivables losses Internal process optimization and auditing to reduce administrative losses
 Challenge : Reduce NTLs Ø There are new distribution solutions
 Distribution solutions
 Distribution solutions
 Meters installed on the pole
 Challenge : Reduce NTLs Ø There are new distribution solutions o But they are expensive… As time goes by, frauds has became more sophisticated Ø Criminal organizations selling “energy theft services” Ø Endless mouse-cat game Ø
 New Challenges Ø To increase the search frauds process efficiency o o o Ø How much ? Where? How kind? To optimize NTLs reducing process o o What are the priorities? How the actions must be doing? What is the adequated solution? How is the optimal mix (New installations X Inspections)
 Loss Reduction Strategies employed Total recovered + agregated energy Inspection Systems and crew AMR with PLC Load balance up to the transformer Anti-theft cables, meters and seals Change of the customer connection Change of the Distribution Pattern
 New Weapon Ø Data analyses o We have a lot of data • • • o o o Billing systems Meter systems Electrical Operation Measurement Systems Costumer Care system Irregularities detected by meter readers Those data are usually separated We need to put them together We have to think, plan and act with intelligence
 Loss Reduction Strategies employed Which technologies should be employed, in what consumers ? Ø Limited financial resources it is necessary to optimize the resources Ø Universe of consumers AMR with PLC Anti-theft cables, meters and seals Load balance up to transformers Change of pattern for input and distribution Which consumers should be inspected ?
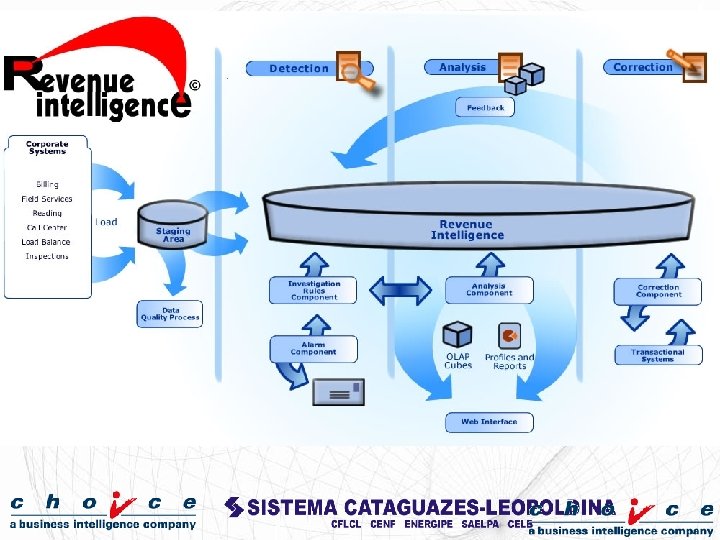
 (PDCA= Plan, Do, Check, Act)") Revenue Intelligence RI is based on ISO 9001 (PDCA) (PDCA= Plan, Do, Check, Act) Detect, Analyze, Correct, Feedback and Review
Revenue Intelligence RI is based on ISO 9001 (PDCA) (PDCA= Plan, Do, Check, Act) Detect, Analyze, Correct, Feedback and Review
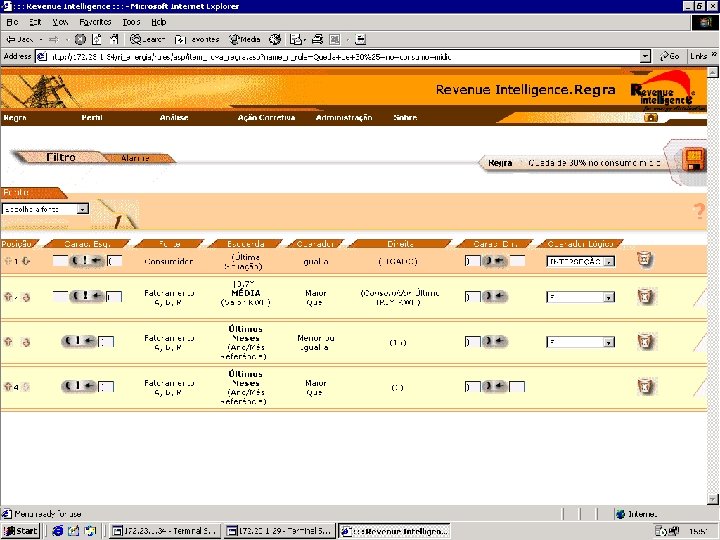
 Detection –Rules Creation Rule Creation Interface: Friendly and Intuitive.
 Detection –Rules Creation Weight definition for each rule:
 Detection - Alarms Creation
 Rules Examples Commercial Losses: • Customers with a consumption anomaly compared to their historical consumption pattern. • Customers with inadequate consumption compared to the segment / regional average and/or water consumption. • Customers with service order “disconnection with meter uninstall”, without “meter install” for more than 3 months. • Customers with a specific meter reading irregularity (meter glass broken, meter without seal or damaged seal, house closed, etc). • Customers in a transform or feeder with more than X% of total losses
 Example of a simple fraud-detection rule BILLING database (Consumption: Average of last 03 months is at least 25% lower than at least 02 consumptions in the 12 months period before the 03 -month considered period.
 Example of a more sophisticated rule G 1 CUSTOMER database Group: Low tension and Status: Connected and Class: Urban and Connection: 3 -phase AND (G 3 AND NOT G 4) SERVICE ORDERS database (Meter reading irregularity: Glass of meter is broken or instalation is suspect of fraud or meter with wrong connection AND NOT Service Order : reconnection with instalation of meter, or supply suspended with meter removed, or instalation of meter, or removal of meter, or meter test, or meter verification, or field inspection, or urgent reconnection with meter instalation or meter replacement when SO date within last month))
 Example of an actual rule created by Revenue Intelligece BILLING database ((Consumption: Average of last 03 months is 25% lower than at least 02 consumptions in the 12 months period before the 03 -months considered period) OR (G 3 AND NOT G 4)) SERVICE ORDERS database ((Non-regularity: Glass of meter is broken or instalation is suspect of fraud or meter with wrong connection) AND NOT (Service Order : reconnection with instalation of meter, or supply suspended with meter removed, or instalation of meter, or removal of meter, or meter test, or meter verification, or field inspection, or urgent reconnection with meter instalation or meter replacement when SO date is after date of metering. ))) G 1 AND (G 2 OR CUSTOMER database (Group: B and Status: Connected and Class: Urban and Connection: Monophase or 2 -phase or 3 -phase) AND
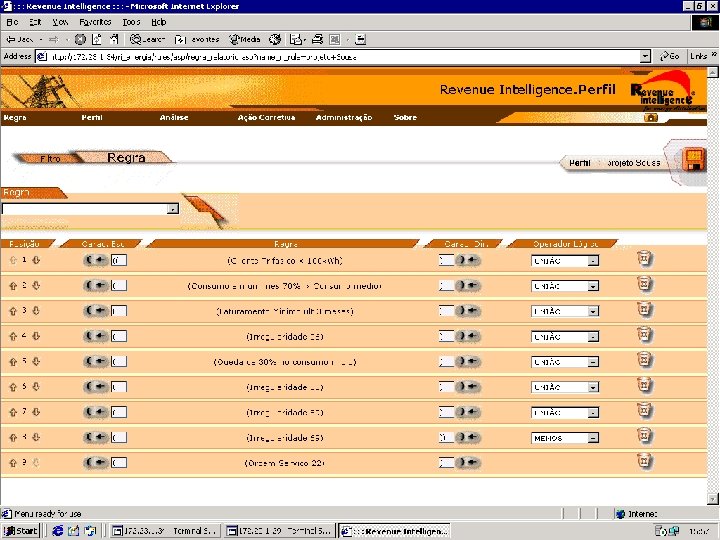
 Same rule implemented by Revenue Intelligence
 Analysis - OLAP • The technology that provides great analysis capabilities is called OLAP (On Line Analytical Processing). This technology generates information comported in multidimensional analysis models, allowing users to do several data analysis, from a variety of perspectives, with simple mouse clicks. • This component allows and turns easier the analysis and interpretation of clues generated by the Detection component. However, through this component it is also possible to identify revenue leakage by analyzing information like abnormalities in patterns of behavior, which are to become the new investigation rules or upgrades for the already existing ones
 Analysis - OLAP Some OLAP models in Revenue Intelligence: • Billing - Consumption: This model contains the information of all customers over time. This cube is used to understand market trends, season factors and set of customers average. • Rule Model: This model contains the information of the intercepted customer by any rule. This cube is used to understand the rule over time, helps to add new filters (clause) to the rule. • Fraud Model: This analog to the Rule Model. It contain customers that have done fraud. It helps to understand the frauds patterns and behaviors and as well to adjust parameters in rules and profiles.
 Analysis - OLAP
 Analysis - Profile • The rules provide the risk weight sum for each intercepted customer: Profile (A U B U C) Weight Rule A 2 Rule B 1 Rule C 3 Result Risk Level 6
 Analysis - Profile Losses analyst may select customers by risk level and/or financial gravity. Inspection selected custumers Fraud risk level medium probability Financial gravity medium recovery probability Fraud risk level high probability Financial gravity high recovery probability Fraud risk level low probility
 Analysis - Profile Rule A Risk = 1 Some have risk level 1, some rl 2 and one have rl 3 All have risk level 3 Profile A = Rule A U Rule B Profile C = Rule A ∩ Rule B Financial Gravity = 100 Profile B = Risk = 2 Rule A All have risk level 1 Financial Gravity = 100 Notice that the financial gravity is a parameter with direct relation with the customer. Risk level parameter depends on the profile the customer was intercepted.
 Analysis - Profile Risk or financial gravity ordering:
 Correction • This is the component that generates corrective actions over revenue leakage. Such as field inspections, disconnections, negotiations, etc. • Revenue Intelligence®© is capable to launch events in any other database with system interfaces. Those events are capable to trigger actions over transactional systems, for example, an inspection order event. • Corrective action's feedback are extremely important. The result allows the tuning of rules and profile, turning RI into a closed-loop process.
 Reporting Ø Ø Ø Efficiency by action, by profile and by rule Actions closed and opened with financial gravity, responsible, beginning and ending date, KWh recovered and aggregated Frauds by type, region, activity, period, etc Consumption by class, tension, activity, region, period, etc Log of changes in rules, profiles and actions
 Benefits from incorporating RI Compares data from several independent sources (CRM, billing, service orders, fraud records, energy balance, GIS, real-time data, call center data, receivable accounts, social-economic information, etc) Ø Manipulates large volume of data (hundreds of millions records) Ø Transforms human non-structured knowledge in structured knowledge – helps building a knowledge database about non-technical losses Ø NTL analysts directly build / edit rules – flexible, human-friendly interface, no programming necessary. Ø
 Benefits from incorporating RI Ø Ø Ø Helps finding theft, fraud patterns, defaulters, inconsistencies, data quality problems, etc Allows optimization of the investigation process using formal risk level and financial impact methods Follows-up corrective actions Feedback process for tuning and optimization Based on ISO 9001 – subject to be certified SOUND RESULTS – VERIFIABLE AND AUDITABLE
 were used for commercial") RI case study in SCL Ø 5 Information sources (databases) were used for commercial loss investigation : o o o Substations Feeders Consumer Contracts Billing Service orders
RI case study in SCL Ø 5 Information sources (databases) were used for commercial loss investigation : o o o Substations Feeders Consumer Contracts Billing Service orders
 Graphs for productivity of inspections Energy Recovered + Aggregated Optimal Point for energy / cost Increase of energy with same cost Productivity with RI Productivity without RI Cost
 Example in Saelpa Region with 2 feeders with high losses Ø Before RI : Ø o o Identification of Suspects of fraud indicated by SAELPA Metering Dept. Anomalies reports issued by anti-fraud module of the Billing System Denounces by clients Suspects of fraud indicated by other SAELPA employees
 Example in Saelpa Using RI - anomalies rules created by Revenue Intelligence: Ø o Three-phase connected consumer with average consumption less than 100 Kwh o Consumer connected without meter reading in the last 3 months o Connected consumer that average consumption dropped 30% in the last 3 months comparing to its last year (previous last 3 months) average consumption o Connected consumer that has at least one consumption, in the last 16 months, 70% greater than its average consumption in the last quarter
 Example in Saelpa Using RI - Reading irregularities rules created by Revenue Intelligence: Ø o o Reading irregularity 55 – Fraud suspicion Reading irregularity 06 – Consumer didn´t allow reading Reading irregularity 69 – Problems in Meter System error 22 – Last meter reading equal previous meter reading– identified by system
 Actual example in Saelpa Using RI - Profiles created Ø o o Combining : • Consumption anomalies rules • Reading irregularities rules • Without service orders Inspections were prioritize by : • Risk level = sum of weights of rules that the consumer was intercepted ; Financial gravity o • Results : • Efficiency rate increasing (frauds / inspections); • Productivity increasing (k. Wh recovered / inspections).
 Example in Saelpa 4. 000 Revenue Intelligence running 3. 500. 000 3. 000 2. 500. 000 2. 000 1. 500. 000 1. 000 500. 000 0 Energy L 2 and L 4 Revenue Losses JAN FEV MAR ABR MAI JUN JUL AGO SET OUT NOV 3. 763. 0 3. 356. 0 3. 757. 0 3. 761. 0 3. 691. 0 3. 230. 0 2. 783. 1 2. 347. 4 2. 250. 7 2. 616. 5 2. 564. 8 2. 580. 1 26, 0% 30, 1% 40, 1% 30, 4% 30, 5% 20, 1% Reduction of the required energy by 13% Total reduction of losses from 30, 5% to 20, 1% DEZ
 MWh.") SAELPA – Revenue Intelligence results Ø Recovered o o o Energy (MWh. R) MWh. R (May/03 -Dec/03) 7. 591 before RI MWh. R (May/04 -Dec/04) 12. 680 after RI Increasing 67. 05% Ø Aggregated o o o Energy (MWh. A) MWh. A per Inspection 0. 028 MWh/month 0. 048 MWh/month Increasing 71%
SAELPA – Revenue Intelligence results Ø Recovered o o o Energy (MWh. R) MWh. R (May/03 -Dec/03) 7. 591 before RI MWh. R (May/04 -Dec/04) 12. 680 after RI Increasing 67. 05% Ø Aggregated o o o Energy (MWh. A) MWh. A per Inspection 0. 028 MWh/month 0. 048 MWh/month Increasing 71%
 Revenue Intelligence - SAELPA Company SAELPA Annual sales 2, 280 GWh Recovered energy annual increasing Aggregated energy annual increasing Total energy annual increasing % of increasing in relation to annual sales Annual estimative of required energy reduction 7. 63 GWh 11. 98 GWh 19. 61 GWh 0. 86% 3. 6 GWh
 Summary of Results in SCL-SAELPA Ø Results of RI in SCL (one year after implementation): o o o Find new patterns of NTL Productivity increased (energy recovered / inspections) more then 67%, representing 0. 86% annual increasing in total revenue Increased efficiency of investigation team up to 36% (average); some rules already achieved 73% efficiency Creation of a NTL Reduction Intelligence Dept. to reduce NTL and keep it low Auditable results and statistics to demonstrate benefits to Management and Stockholders.
 Denis Maia Marcos Aurélio Madureira da Silva CEO denis@choice. com. br 55 -21 -3970 -6875 www. choice. com. br Corporate Commercial Director madureira@cataguazes. com. br 55 -83 -2106 -7002 www. scl. com. br