

04accecdef2dd7746e70bd6d1433c9ef.ppt
- Количество слайдов: 22
 The MEDINA e-infrastructure: indicators and models for marine ecosystem assessment Roberto Pastres Department of Environmental Sciences, Informatic and Statistic pastres@unive. it
 • MEDINA: Marine Ecosystem Dynamics • and Indicators for North Africa http: //www. medinaproject. eu/ • • • FP 7 Collaborative Project Duration: 36 months Start date: 01/10/2011 12 Participants from 9 countries Coordinator: Roberto Pastres
 IT 2 Universitat Autònoma de Barcelona (UAB) ES") 1 Università “Ca’ Foscari” Venezia (UNIVE) IT 2 Universitat Autònoma de Barcelona (UAB) ES 3 Universidade Pablo de Olavide (UPO) ES 4 Université Abdelmalek ESSAADI (UAE-FPL) 5 Joint Research Centre - EC (JRC) 6 7 National Inst. for Oceanography and Fisheries (NIOF) Union International pour la Conservation de la Nature et de ses ressources (IUCN) Morocco EU Egypt CH 8 Commissariat National du Littoral (CNL) 9 Plymouth Marine Laboratory (PML) 10 ACRI Etudes et Conseil (ACRI) Morocco 11 European Space Agency (ESA) FR 12 CNR -IIA Istituto sull’Inquinamento Atmosferico IT Algeria GB
1 Università “Ca’ Foscari” Venezia (UNIVE) IT 2 Universitat Autònoma de Barcelona (UAB) ES 3 Universidade Pablo de Olavide (UPO) ES 4 Université Abdelmalek ESSAADI (UAE-FPL) 5 Joint Research Centre - EC (JRC) 6 7 National Inst. for Oceanography and Fisheries (NIOF) Union International pour la Conservation de la Nature et de ses ressources (IUCN) Morocco EU Egypt CH 8 Commissariat National du Littoral (CNL) 9 Plymouth Marine Laboratory (PML) 10 ACRI Etudes et Conseil (ACRI) Morocco 11 European Space Agency (ESA) FR 12 CNR -IIA Istituto sull’Inquinamento Atmosferico IT Algeria GB
: -To contribute to the assessment of coastal ecosystem status in") MEDINA Overall objectives (1): -To contribute to the assessment of coastal ecosystem status in North African countries; -To enhance the monitoring capacity for those regions. -To identify major risks due to climate change and suggest adaptation strategies. -To feedback MEDINA’s scientific contribution within the EU regulatory framework.
MEDINA Overall objectives (1): -To contribute to the assessment of coastal ecosystem status in North African countries; -To enhance the monitoring capacity for those regions. -To identify major risks due to climate change and suggest adaptation strategies. -To feedback MEDINA’s scientific contribution within the EU regulatory framework.
: -To ensure the optimal exploitation of the GEOSS Common Infrastructure") MEDINA Overall objectives (2): -To ensure the optimal exploitation of the GEOSS Common Infrastructure (GCI) capabilities in supporting on-going monitoring&assessment, also through the fusion of satellite Earth Observation and conventional monitoring data. -To promote international cooperation for sharing data and services with on-going EU efforts, with the relevant GEO Community of Practices and with GOOS-Africa
MEDINA Overall objectives (2): -To ensure the optimal exploitation of the GEOSS Common Infrastructure (GCI) capabilities in supporting on-going monitoring&assessment, also through the fusion of satellite Earth Observation and conventional monitoring data. -To promote international cooperation for sharing data and services with on-going EU efforts, with the relevant GEO Community of Practices and with GOOS-Africa
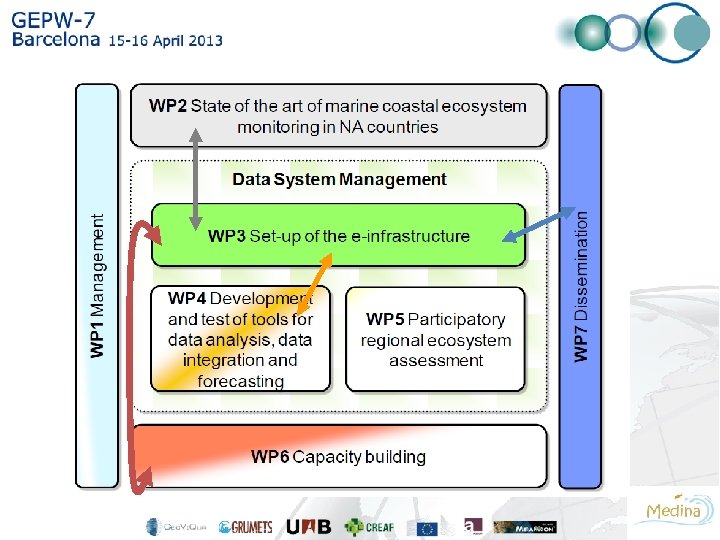
 MEDINA’s key features: - Driver-Pressure-State-Impact-Response conceptual framework for on-going monitoring and assessment. - Use of mechanistic models (biogeochemical, Habitat Suitability, Food Web etc …. ) for establishing causal links between Drivers/Pressures and State/Impacts. - Fusion of remotely-sensed and in-situ observation, through modelling, for monitoring optimization.
 Ecological indicators EO indicators WP 5 WP 4 Environmental drivers/stressors GCOMS model In situ data Habitat model Model hindcasts and forecasts Pilot cases WP 3 Regional ecosystem assessment Foodweb model Local ecosystem assessment FVCOM model EIA model
 The e-Infrastructure is the key component of MEDINA The Medina e-Infrastructure is being developed by
 To achieve the goals of MEDINA, a key element is the use and exploitation of existing data and spatial information • The MEI, built in WP 3, will act as a tool for discovering, accesing and visualising spatial, indicators and model results. • It will be fully compatible in design and usability with GEOSS GCI, and thus accesible through GEOSS website. • MEDINA e-infrastructure will guarantee viability, compatibility and sustainability with existing databases.
 What is the MEDINA e-Infrastructure? • Infrastructure interoperable that supports access spatial to geographic information. • Distributed geographic database, based on standardized protocols to ensure interoperability. • A tool to disseminate Medina products.
 Me. I conceptual model
 COMPONENT") Main features and components of the Me. I FEATURE (i. e. what? ) COMPONENT (i. e. how? ) DISCOVERY CATALOG VISUALIZATION MAP SERVICES (WMS), ONLINE VIEWER, DELIVERY DATA ACCESS MAP SERVICES (WFS, WCS)
Main features and components of the Me. I FEATURE (i. e. what? ) COMPONENT (i. e. how? ) DISCOVERY CATALOG VISUALIZATION MAP SERVICES (WMS), ONLINE VIEWER, DELIVERY DATA ACCESS MAP SERVICES (WFS, WCS)
 How will the Me. I work Indicators results from PML Partners Access MEI CASES Local Goverments Medina e. Infrastructure Researchers Others 01/02/13 Download, visualise and use maps D A T A Indicators results from ACRI Indicator results from UAB Other spatial results from MEDINA Relevant layers from JRC, ESA. . 14
 The MEDINA e-Infrastructure will be tested at 5 pilot sites.
 are ongoing: Me. I Viewer (www. medinageoportal.") Tests on MEDINA indicators (WP 5 -UAB) are ongoing: Me. I Viewer (www. medinageoportal. eu) Chlorophyll a Bathymetry
Tests on MEDINA indicators (WP 5 -UAB) are ongoing: Me. I Viewer (www. medinageoportal. eu) Chlorophyll a Bathymetry
 MEDINA will also make available web-based models : Habitat Suitability model for Posidonia oceanica (ACRI+UNIVE)
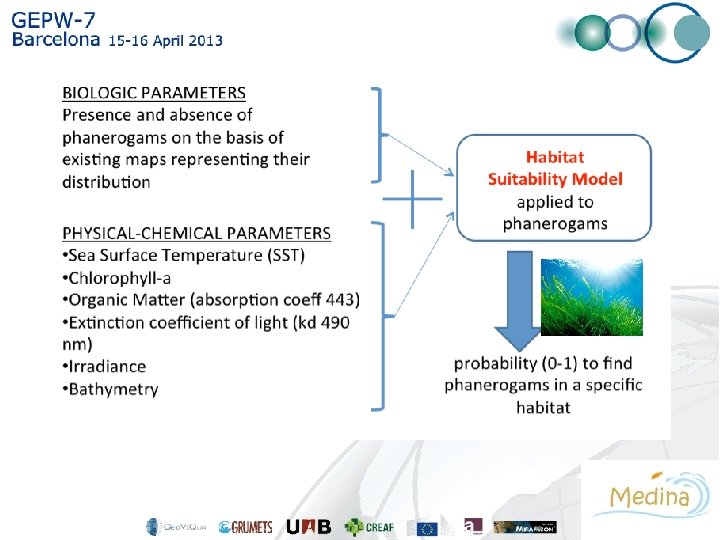
 The model was calibrated at five mediterranean areas and is now being tested on North African sites Model output (green = presence) Observations
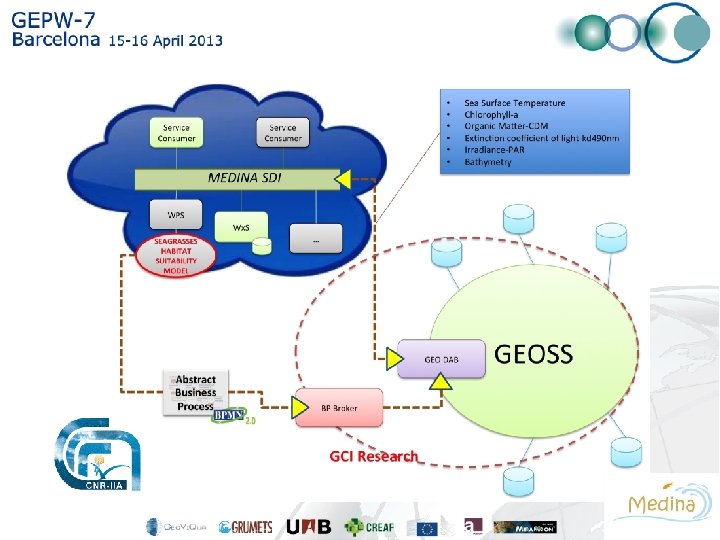
 We presented the HS model as case study at GEOSS Architecture Implementation Pilot. Phase -6. • The aim of this pilot is to demonstrate the added-value of developing the models in the context of the GEOSS Common Infrastructure (GCI). • A new Business process Broker component will be used to extend the current GCI capabilities. Where needed, new interoperability arrangements will be developed to integrate new capacities underpinning MEDINA and this pilot.
 MEDINA contribution to GEOSS Task Description Relevant Area IN-02 C 2 Earth Data Sets IN-05 C 1 GEOSS Design and Interoperability SB-01 C 1 Global Ocean Information Coordination and Access Provide a suite of global datasets based on improved and validated data sources. Execute and document Architecture Implementation Pilots (AIPs) and related research activities – this is a software test environment Develop vulnerability and integrated management of coastal zones in order to inventory, protect and monitor coastal lands SB-01 C 2 Operational Systems for Monitoring of Marine and Coastal Ecosystems SB-01 C 3 A Global Operational Ocean Forecasting Network for sustainable fishery and aquaculture Establish a global coastal network of observations and modeling that target sentinel and reference sites for rapid detection of changes in ecosystem states caused by landbased sources of pollution, fishing and climate change Develop and test the next generation of systems extending from open-ocean into shelfseas and coastal waters, SB-01 C 4 Applications of Earth Observations and Information Design and implement a suite of ecological indicators. Making available EIA models BI-01 C 1 Global Biodiversity Observation Develop standards for monitoring biodiversity.