

fb761f533351e0953c82e896eae99d1b.ppt
- Количество слайдов: 45
 The Israeli VC Industry: Emergence, Operation and Impact
 . …Emergence • Clearly, Yozma played a significant role in the development of the Israeli VC Industry. • Yozma acted as main catalyst in creating the VC industry in Israel – the supply side • However…The success of Yozma was much depended on the existence of other enabling factors - mainly the demand size.
 Main Objectives • Identifying the background conditions for Yozma success • Learning some lessons on policy design processes. • Implications for Italy
 Contents Of Presentation • Part A: Background- Phases in the Israeli high tech industry and Innovation Technology Policy • Part B: Phases in the Emergence and growth of the Israeli VC industry • Part C: Policy Implications for Italy • Part D – The Israeli case of Biotechnology
 Part A: Phases in the Israeli High Tech Industry and Innovation Technology Policy: 1. R&D penetration period: 60 -89 2. Silicon Valley period: 90 -00
 R&D Penetration Period 1960 -1970 • 50’s-60’s: emergence of an innovative agriculture sector. • After 67’: create a domestic capability for supplying advanced military equipment (this required also high level Military R&D). • Military R&D cooperation with US, Germany and France - transfer of technology from those countries to Israel’s military industry.
 R&D Penetration Period 1970 -1980 • 70’s-80’s: dominance of strong military industry • 70’s-80’s: first foreign multinational companies establish R&D centers in Israel: Motorola (1964), IBM (1972), Intel (1974) and National Semiconductors (1978). • In 1972, Elscint (Hi-Tech company) became the first Israeli company to be traded on an US stock exchange.
 R&D Penetration Period 1980 -1990 • Mid 80 s: re-structuring of the military industries • Share of high-tech industries in total manufacturing output (and exports) increased between 1968 and 1983 from 6 % (5%) to 24% (28%).
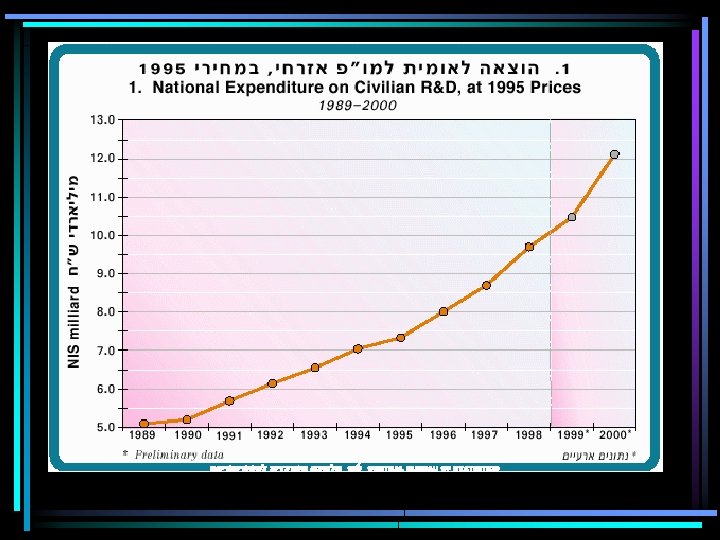
 R&D Penetration Period 1980 -1990 – Cont. • High Growth Rate of industrial Civilian R&D from 26 M$ real to 347 M$ between 1970 and • Numbers of Skilled employees in Manufacturing grew from 3400 in 1968 to over 20000 in 1987; • Skill intensity increased from 1. 3 % to 5. 8%
 Silicon Valley Period 1990 -2000 • The breakdown of the Soviet Union, which brought a very large number of immigrant Scientists and Engineers to Israel. • Liberalization process which generate a better environment for doing business in Israel. • Beginnings of Globalization of US capital markets with respect to SU
") : (Intermediate Conclusions (1 • The creation of the high-tech industry (the “demand side”) was a result of: – – Changes in national priorities Institutional changes Global Economical changes Availability of skilled labor
: (Intermediate Conclusions (1 • The creation of the high-tech industry (the “demand side”) was a result of: – – Changes in national priorities Institutional changes Global Economical changes Availability of skilled labor
 Part B: Innovation & Technology Policy
 Innovation & Technology Policy 1950 -1970 • 50’s-60’s: Promotion of capital investments in Industry. This stimulated the establishment of R&D performing MNE in Israel during the 70 s & 80 s • No policy supporting Industrial R&D till 1969.
 Innovation & Technology Policy 1970 -1980 • 1969 -70: Establishment of the Office of the Chief Scientist (OCS) • R&D incentives since 1970 induced a high rate of growth of business sector R&D and a strong process of learning about innovation
 Innovation & Technology Policy 1980 - 1990 • 1977 Implementation of BIRDF • Till the 90 s, more than 90 % of R&D subsidies to companies still came through the regular “R&D Industrial fund”(‘backbone’ program)
 New ITP Programs • Other OCS support programs– Marketing, Innovation in SMEs, Export research, etc. • Technology Incubator program – supporting startup companies in very early stages. . • INBAL program – gives guarantee to public VC companies on the down side. • MAGNET program – Support generic R&D. • …… Yozma program (1993 -97)
 Influences of the R&D Policies • Significant growth in R&D expenditures • Rapid growth in employment of Engineers & Scientists in the Industry • Strong ‘Learning to Innovate’ process • Creation of a identifiable civilian oriented High Tech industry • High growth rate in high tech output and exports • Rapid increase in the share of High Tech in Manufacturing output and exports
 Year Total Grants Regular R&D support MAGNET") Table 1: OCS R&D Grants (Nominal M$) Year Total Grants Regular R&D support MAGNET Technology Incubators Miscellaneous Royalties 1990 136 NA 0 0 NA NA 1991 179 NA 0 1. 8 NA NA 1992 199 NA 5 10 NA NA 1993 231 NA 10 18 NA NA 1994 316 NA 10 23 NA NA 1995 346 286 15 31 13 64 1996 348 276 36 30 5 91 1997 303 53 30 11 121
Table 1: OCS R&D Grants (Nominal M$) Year Total Grants Regular R&D support MAGNET Technology Incubators Miscellaneous Royalties 1990 136 NA 0 0 NA NA 1991 179 NA 0 1. 8 NA NA 1992 199 NA 5 10 NA NA 1993 231 NA 10 18 NA NA 1994 316 NA 10 23 NA NA 1995 346 286 15 31 13 64 1996 348 276 36 30 5 91 1997 303 53 30 11 121
 Exports (000$) Employees") Table 2: IT High Tech Manufacturing Industry Year Total Sales (000$) Exports (000$) Employees Sale per Employee (000$) 1991 3, 618 2, 283 33, 000 109 1992 3, 996 2, 660 34, 000 117 1993 4, 610 3, 200 36, 500 126 1994 5, 200 3, 750 38, 000 137 1995 5, 890 4, 300 40, 000 147 1996 6, 500 4, 880 42, 000 155 1997 7, 200 5, 700 43, 000 166 1998 8, 030 6, 550 44, 700 180 1999 8, 580 7, 130 45, 800 187 2000 12, 500 11, 000 53, 800 232
Table 2: IT High Tech Manufacturing Industry Year Total Sales (000$) Exports (000$) Employees Sale per Employee (000$) 1991 3, 618 2, 283 33, 000 109 1992 3, 996 2, 660 34, 000 117 1993 4, 610 3, 200 36, 500 126 1994 5, 200 3, 750 38, 000 137 1995 5, 890 4, 300 40, 000 147 1996 6, 500 4, 880 42, 000 155 1997 7, 200 5, 700 43, 000 166 1998 8, 030 6, 550 44, 700 180 1999 8, 580 7, 130 45, 800 187 2000 12, 500 11, 000 53, 800 232
 . . copare. xls דןקורסגרפים וטבלאות
 : (Intermediate Conclusion (2 • The different support schemes of the OCS and the Incubator programs have created the conditions for civilian R&D oriented industries and for entrepreneurship. • These conditions enabled the emergence of the VC industry
 Phases in the Emergence and Growth of the Israeli VC Industry
 Creation-Emergence and Learning (1) • Dominated by Yozma funds. •") Phase 1 (1993 -1996) Creation-Emergence and Learning (1) • Dominated by Yozma funds. • Very low SU company valuations. • Small funds (~$20 M). • Small amount invested in each startup and small numbers of investments. • Large share of co-investment with other Israeli VCs • Little seed investments and no specialization in areas.
Phase 1 (1993 -1996) Creation-Emergence and Learning (1) • Dominated by Yozma funds. • Very low SU company valuations. • Small funds (~$20 M). • Small amount invested in each startup and small numbers of investments. • Large share of co-investment with other Israeli VCs • Little seed investments and no specialization in areas.
 Creation-Emergence and Learning (2) • Foreign partners had important role") Phase 1 (1993 -1996) Creation-Emergence and Learning (2) • Foreign partners had important role and operational role. • Cumulative learning • Very little understanding of the market and the VC business - Very small added value. • Goal of VCs to make fast exit through M&A (in low valuations - $10 M-$70 M).
Phase 1 (1993 -1996) Creation-Emergence and Learning (2) • Foreign partners had important role and operational role. • Cumulative learning • Very little understanding of the market and the VC business - Very small added value. • Goal of VCs to make fast exit through M&A (in low valuations - $10 M-$70 M).
- Growth (1) • First round of private VC funds not") Phase 2 (1996 -1998)- Growth (1) • First round of private VC funds not related to Yozma • still low valuation in private investment, compared to US startups. • medium sized funds (~$100 M). • Increase in the amount invested in each startup and fewer portfolio companies. • Increase in seed investments and beginning of specialization in areas. • Foreign partners had less important, non-operational roles.
Phase 2 (1996 -1998)- Growth (1) • First round of private VC funds not related to Yozma • still low valuation in private investment, compared to US startups. • medium sized funds (~$100 M). • Increase in the amount invested in each startup and fewer portfolio companies. • Increase in seed investments and beginning of specialization in areas. • Foreign partners had less important, non-operational roles.
 - Maturity (1) • Many VC companies and large variety") Phase 3 (1999 -2000) - Maturity (1) • Many VC companies and large variety of VC company types. • Normal valuation in private placements, compared to US startups. • Most VCs specialized in certain areas • increase in seed investments. • Increase in VCs added value capabilities.
Phase 3 (1999 -2000) - Maturity (1) • Many VC companies and large variety of VC company types. • Normal valuation in private placements, compared to US startups. • Most VCs specialized in certain areas • increase in seed investments. • Increase in VCs added value capabilities.
 – Maturity (2) • Increase in co-investment with US VCs.") Phase 3 (1999 -2000) – Maturity (2) • Increase in co-investment with US VCs. • Goal of VCs to create successful independent companies or very high valuation Exits. • Israeli startup companies becoming less dependent on Israeli VC’s added value
Phase 3 (1999 -2000) – Maturity (2) • Increase in co-investment with US VCs. • Goal of VCs to create successful independent companies or very high valuation Exits. • Israeli startup companies becoming less dependent on Israeli VC’s added value
 The Israeli VC “Case-Study” suggests : That • Success of targeted policies is much depend on: – Clearly analyzing the failures – Identifying the required enabling elements – Create the condition for these elements to exist • Timing is Crucial • Carrying on-going learning process is important
 : This may require • Coordination with existing policies • The implementation of new policies/schemes • Institutional changes • Political/Economical changes • Cultural changes • Etc.
 The Emergence of VC industry was : the Result of • High demand backed with strong R&D capabilities • High entrepreneurial activity backed with public support schemes • Many good investments opportunities • Proper economical and political conditions • …Targeted incentives for VCs (YOZMA)
 Part C: The Israeli Biotechnology Study
 10 Public companies") The Israeli Biotechnology Market • • 160 companies (30% in therapeutics) 10 Public companies 4000 employees Market valuation: $3. 5 billion Market capitalization: $2. 7 billion Av. Growth in no. of companies: 14% Sales: $800 million (incl. the Copaxon) 75% of the companies employs less then 20
The Israeli Biotechnology Market • • 160 companies (30% in therapeutics) 10 Public companies 4000 employees Market valuation: $3. 5 billion Market capitalization: $2. 7 billion Av. Growth in no. of companies: 14% Sales: $800 million (incl. the Copaxon) 75% of the companies employs less then 20
 • First IPOs in early 80 th • The experience gained in IT is partly be relevant in Biotech • Therefore, only 8 Israeli VCs are focused on Biotechnology • Other financial tools have been developed during the 90 th.
 : Other Financing Tools include • • • Public Incubators Private Incubators Corporation Biotech Funds TTOs’ funds Angels New Incubator scheme
 Israel Biotechnology Sector
 Israeli Biotechnology Companies by Location Tel-Aviv 19% Rehovot 27% Other Beer-Sheva 3% 8% Jerusalem 22% Haifa 21%
 Israeli Biotechnology Companies By Field of Technology
 Typical Limitations of Bio. Pharmaceutical companies • Complex regulation • Research is complex, lengthy and costly • Costly infrastructure is required carry out the research • Marketing of new drugs is an extremely difficult task
 Typical Business Model Strong Team of entrepreneurs Significant Innovative Idea Pre - Clinical Tests Royalties Phase I + II After 2 -3 successful drugs IPO Strategic Partner Phase III NDA + Marketing Licensing / Selling of IPR Phase III
 Conclusion from the Israeli Biotech : (Study (1 • Bio-Pharmaceutical function as R&D companies for long period of time without reaching an economical independency • IPO is commonly not an “Exit” but rather part of R&D financing • Complex networks are necessary for the firm development (IPR, Regulation issues, Financing, Infrastructure, CROs, Strategic Partners, etc. )
 Conclusion from the Israeli Biotech : (Study (2 • Proximity to academic institutes is important in order to ease the flow of knowledge • VCs find difficulties in entering biotechnology. Thus relatively small no. of VCs are active. • Policies directed towards Biotech can hardly be mixed with other regional development policies
 Part C: Policy Implication For Italy
 Implication for Italy The policy for promoting SU should focus on: • Creating higher demand (increasing entrepreneurial activity) • Extending and simplifying the support for R&D oriented firms • Closing the information gap between potential entrepreneurs and VCs • Strengthening of relations between universities and SU • Institutional changes (especially in regards to technology transfer)
 end
end