

ed6e93494b9e2108884f70e9eea58bb5.ppt
- Количество слайдов: 41
") The Interpretation of Financial Statements Chapter 16 © Luby & O’Donoghue (2005)
The Interpretation of Financial Statements Chapter 16 © Luby & O’Donoghue (2005)
 Why use ratio analysis Provides framework Comparison to previous years Trends identified Identify areas of concern Targets can be set Comparison to other similar organisations
 Limitations Accounting statements present a limited picture Accounting policies can distort any inter-firm comparisons and trend analysis Historical Ratios can be misleading if used in isolation Effects of inflation ignored Year end figures in statements may not be representative of whole year
 Ratio analysis Profitability Efficiency Liquidity Capital Structure Investment
 Data for ratio illustrations Profit Statements for year ended 31 December Balance sheet as at 31 December Fixed assets 500 Current assets Net purchases 6, 800 Stock 850 Closing stock (850) (6, 450) Debtors 780 120 Turnover Less cost of sales Opening stock 9, 885 8, 595 Gross profit 3, 435 Bank less expenses (1, 200) 2, 235 Current liabilities Net operating profit (PBIT) 1, 750 Less interest payable (162) Creditors 585 Net profit before tax 2, 073 Bank/ short term loans 500 Less taxation (413) Profit after interest and tax 1, 660 Long term liabilities less dividends preference (100) Debentures (1, 800) less dividends ordinary (800) 7, 460 760 Retained profit for the year Retained profit b/f 1, 200 Capital and reserves Retained profit c/f 1, 960 Ordinary shares Preference shares Market price of shares 1. 21 8, 000 (1, 085) 665 4, 000 1, 000 Retained profit 1, 960 8 million ordinary shares issued Reserves 500 7, 460
 Profitability Measured st in s a ag ale s Efficiency Liquidity l ita ap t c yed ns ai plo ag em • Gross profit margin • Return on capital employed • Net profit margin • Return on owners equity • Expenses to sales Capital Structure Investment
 Gross profit margin Gross Profit x 100 Sales This indicates the margin of profit between sales and cost of sales. € 3, 435 x 100= 34. 7% € 9, 885 PROFITABILITY
 Net profit margin Net Profit x 100 Sales This shows the amount of profit after all expenses are deducted. € 2, 235 x 100 = 22. 6% € 9, 885 PROFITABILITY
 Expenses to sales Expenses x 100 Sales This shows the percentage of sales needing to cover expenses. This ratio assesses the ability of management in controlling expenses of the business. € 1, 200 x 100 = 12. 1% € 9, 885 PROFITABILITY
 Usually net profit before interest and tax Net Profit") Return on Capital Employed (ROCE) Usually net profit before interest and tax Net Profit x 100 Capital employed share capital + reserves + Loans This shows the ratio of net profit to the investment in the business. € 2, 235 x 100 = 24. 1% € 9, 260 PROFITABILITY
Return on Capital Employed (ROCE) Usually net profit before interest and tax Net Profit x 100 Capital employed share capital + reserves + Loans This shows the ratio of net profit to the investment in the business. € 2, 235 x 100 = 24. 1% € 9, 260 PROFITABILITY
 Can be before or after interest and tax Net") Return on Owners Equity (ROOE) Can be before or after interest and tax Net Profit x 100 Shareholders funds Should only relate to ordinary shareholders This ratio assesses the return (profit) for the ordinary (equity) shareholders alone. € 1, 660 x 100 = 22. 3% € 7, 460 PROFITABILITY
Return on Owners Equity (ROOE) Can be before or after interest and tax Net Profit x 100 Shareholders funds Should only relate to ordinary shareholders This ratio assesses the return (profit) for the ordinary (equity) shareholders alone. € 1, 660 x 100 = 22. 3% € 7, 460 PROFITABILITY
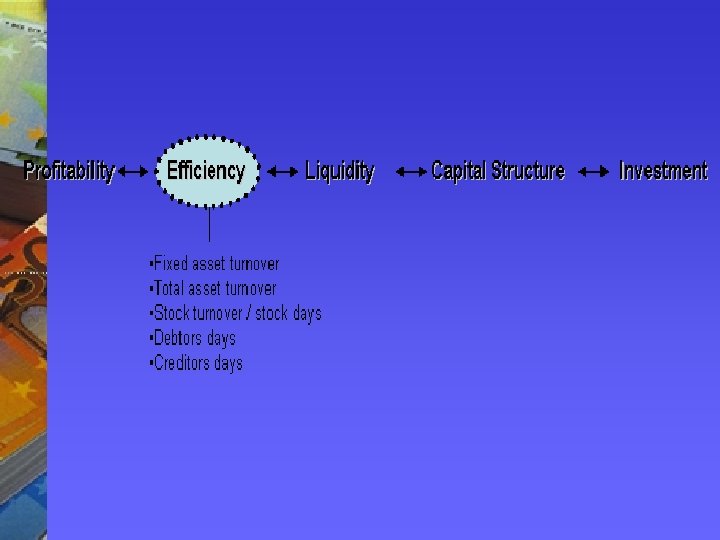
 Fixed asset turnover Sales _ Fixed Assets This shows the number of times that the fixed assets are turned over in the period. A high rate of return indicates that a business is operating efficiently and is making the best possible use of assets. A low rate suggests inefficient use of assets. € 9, 885 = 1. 2 : 1 € 8, 595 EFFICIENCY
 Total asset turnover Sales _ Total assets This shows the number of times that the total net assets are turned over in the period. A high rate of return indicates that a business is operating efficiently and is making the best possible use of assets. A low rate suggests inefficient use of assets. € 9, 885 = 1. 067 : 1 € 9, 260 EFFICIENCY
 Stock turnover Cost of sales Average stock Stock turnover is the average number of times per year that the whole value of stock is purchased and resold. The quicker stock is told the quicker profit will be made on that item. A low rate of turnover shows that old stock is being left on the shelves. € 6, 450 = 9. 6 times 675 EFFICIENCY
 Stock days Stock can also be measured by examining the number of days on average that stock is held. Average stock Cost of sales x 365 € 675 x 365 = 38. 2 days € 6, 450 EFFICIENCY
 Debtors days Trade Debtors x 365 Credit Sales Indicates how quickly debtors pay. This ratio can be expressed as the number of days credit taken by debtors. € 780 x 365 = 28. 8 days € 9, 885 EFFICIENCY
 Creditors days Trade Creditors x 365 Credit Purchases Indicates how long before creditors are paid. This ratio can be expressed as the number of days credit taken before payment. € 585 x 365 = 31. 4 days € 6, 800 EFFICIENCY
 Note: the combination of net profit margin and") Return on Capital Employed (ROCE ) Note: the combination of net profit margin and the asset turnover gives the return on capital employed. Profit Margin Sales Capital Employed x x Asset Turnover Net Profit Sales x 100 = Net Profit x 100 Capital Employed
Return on Capital Employed (ROCE ) Note: the combination of net profit margin and the asset turnover gives the return on capital employed. Profit Margin Sales Capital Employed x x Asset Turnover Net Profit Sales x 100 = Net Profit x 100 Capital Employed
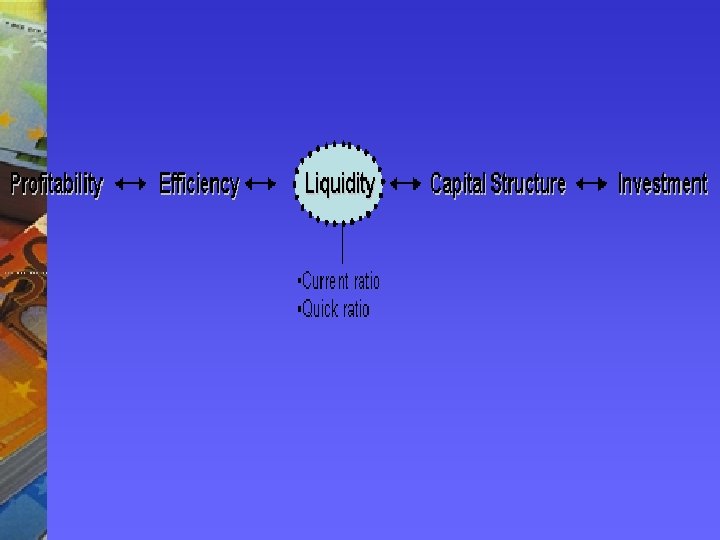
 Current ratio Current Assets Current Liabilities This is a measure of the short term solvency of a business. € 1, 750 = 1. 6 : 1 € 1, 085 LIQUIDITY
 Current ratios – sector norms Industry Type Manufacturing Wholesalers Current Ratio 2. 5 – 4. 5 : 1 2: 1 Retail/Supermarkets 0. 8 : 1 Hotels, restaurants, fast foods 0. 4 : 1
 Acid-test ratio Current Assets - Stock Current Liabilities Also know ability of a liabilities liquidation assets. as quick business without of stock ratio. Indicates the to pay off short term resorting to the or the sale of fixed € 900 € 1, 085 LIQUIDITY = 0. 8 : 1
 Capital structure measures the funding mix of a business.
 Financing Through debt Through equity Interest must be paid on the debt Dividends will be paid to shareholders Interest is tax deductible Dividends deductible Debt generally cheaper Equity requires higher returns to compensate for risk Debt is risky because interest must be paid Dividends are at discretion of management and may be deferred Loan must be repaid Equity does repayment CAPITAL STRUCTURE are not tax require
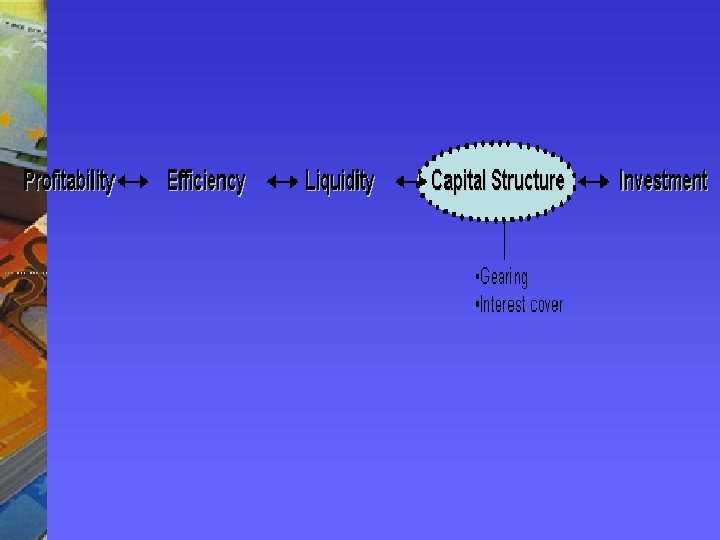
 Gearing Preference shares and long term loans All shareholders funds and long term loans This is the ratio of fixed interest debt and capital to ordinary share capital. € 2, 800 = 0. 38 : 1 € 7, 460 CAPITAL STRUCTURE 38%
 Gearing The higher the ratio of debt to equity, dependent the organisation is upon funds, and the greater the risk that unable to meet interest payments funds as they fall due. Low gearing = where debt is less than capital & reserves. Neutral gearing = debt = capital & reserves. High gearing = debt is greater than capital & reserves. CAPITAL STRUCTURE the more borrowed it will be on these < 100% = 100% > 100%
 Interest cover Profit before interest Interest payable The ability of a company to meets interest commitments, measured by expressing the profit before interest as a multiple of the interest paid and payable. € 2, 235 = 13. 8 : 1 € 162 CAPITAL STRUCTURE
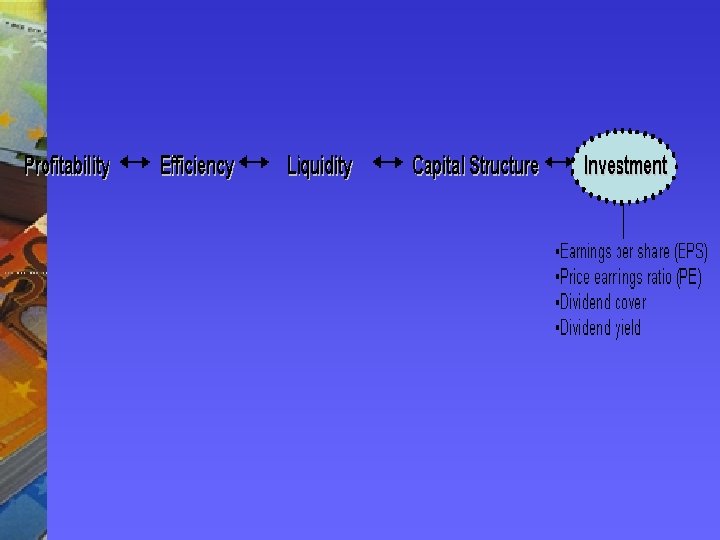
 Profit available for ordinary dividend Number of equity shares issued") Earnings per share (EPS) Profit available for ordinary dividend Number of equity shares issued Earnings is measured in pence / cents and is concerned with the profits available to ordinary shareholders from which a dividend can be paid. € 1, 560 = € 0. 195 ie 19. 5 cent 8, 000 INVESTMENT
Earnings per share (EPS) Profit available for ordinary dividend Number of equity shares issued Earnings is measured in pence / cents and is concerned with the profits available to ordinary shareholders from which a dividend can be paid. € 1, 560 = € 0. 195 ie 19. 5 cent 8, 000 INVESTMENT
 Market Price Earnings per share Market price as a multiple of") Price/earnings ratio (PE) Market Price Earnings per share Market price as a multiple of the latest earnings per share. Used as a relative measure of stock market performance. Relates the EPS to the price the shares sell at in the market. The greater the PE the greater the € 1. 21 = 6. 2 times demand for shares. € 0. 195 INVESTMENT
Price/earnings ratio (PE) Market Price Earnings per share Market price as a multiple of the latest earnings per share. Used as a relative measure of stock market performance. Relates the EPS to the price the shares sell at in the market. The greater the PE the greater the € 1. 21 = 6. 2 times demand for shares. € 0. 195 INVESTMENT
 The P/E ratio depends mainly on four things: P/E ratio Commentary") Price/earnings ratio (PE) The P/E ratio depends mainly on four things: P/E ratio Commentary INVESTMENT The market feels that these companies have poor future prospects and/or are trading in unfashionable business sectors. 8 -12 The market feels that these companies have reasonable prospects but are unsure regarding if and when these companies will shine. 12 -20 The market feels these companies have very good prospects and that these prospects are beginning to be reflected in the share price as demand for the share increases. Companies with P/Es of 15 are considered good safe blue chip investments >20 The overall level of the stock market (e. g. bull or bear). The industry in which the company operates. The company’s record. The markets view on the company’s prospects. <8 These are the boom stocks or high flyers. Their potential is generally reflected already in their share price and the demand for the share is on the increase. These type of companies tend to be young high flyers who retain all their profits for future growth.
Price/earnings ratio (PE) The P/E ratio depends mainly on four things: P/E ratio Commentary INVESTMENT The market feels that these companies have poor future prospects and/or are trading in unfashionable business sectors. 8 -12 The market feels that these companies have reasonable prospects but are unsure regarding if and when these companies will shine. 12 -20 The market feels these companies have very good prospects and that these prospects are beginning to be reflected in the share price as demand for the share increases. Companies with P/Es of 15 are considered good safe blue chip investments >20 The overall level of the stock market (e. g. bull or bear). The industry in which the company operates. The company’s record. The markets view on the company’s prospects. <8 These are the boom stocks or high flyers. Their potential is generally reflected already in their share price and the demand for the share is on the increase. These type of companies tend to be young high flyers who retain all their profits for future growth.
 Dividend cover Profit available to pay dividend Dividends paid and proposed This ratio indicates the proportion of available profits, which is distributed to shareholders, and the amount which is retained by the organisation. € 1, 560 = 2 times € 800 INVESTMENT
 Dividend yield Dividend per share Price per share The real rate of return on investment in shares. 0. 10 x 100 = 8. 3% 1. 21 INVESTMENT
 Dividend yield The average dividend yield for the major world markets over the last twenty years Dividend Yield % UK Ireland Eurobloc (ex UK) USA Japan Asia pacific (ex Japan) 2. 7% 1. 8% 2. 4% 1. 5% 0. 9% 3. 1% (Source: Irish Times Business Supplement)
 Setting the context The age of the business The size of the business The economic and political environment Industry Trends
 Company performance – number of years Have sales increased or decreased and by what percentage? Has operating profit increased or decreased and by what percentage? Has loan interest increased or decreased and by what percentage? Check the long-term loans in the balance sheet to see if they have increased/decreased. Compare profit after tax to see if it has increased or decreased. Calculate percentage increase/decrease in fixed assets. If assets have been increased, has this been financed through increased loans or issued share capital? Check to see if the business has cash or an overdraft, and is this increasing or decreasing? Check current assets and liabilities for any major increases. Check the percentage increase/ decrease in long-term loans.
 Company comparison Check both businesses are in the same industry/sector Compare the size of each business. This is normally done, by comparing the total asset levels in the balance sheet (fixed assets + current assets- current liabilities). Compare sales and profit levels. Compare financing. For example is one company highly geared and the other low geared? Compare cash balances/overdraft levels.
 Sector overviews Hospitality and tourism performance is commented on throughout chapter 16 and should be read and studied carefully. For a retail overview the performance of Arnotts is analysis in a case study from page 339 of the text book.
 Hospitality ratios Ratio Occupancy ratios Formula Rooms occupied x 100 Rooms available Number of guests x 100 Guest capacity Actual room revenue x 100 Potential room revenue Average room rate Room revenue Rooms occupied Average rate per guest Room revenue Number of guests Average spend Sales Number of covers Sales mix Rooms revenue x 100 Total hotel revenue Food revenue x 100 Total hotel revenue Bar revenue x 100 Total hotel revenue