

5. The Industry Structure.pptx
- Количество слайдов: 17
 The Industry Structure
 Instead of "majors" the large multinational oil companies are commonly referred to as International Oil Companies or IOCs. The IOCS are listed corporations with 100% of their stock owned by the public and actively traded. In contrast, knowledge about the companies charted and owned by national governments (National Oil Companies or NOCs) is sketchy at best. The ordinariness of the title, however, cloaks their operations. Sometimes they are little more than engines of national revenue —taxmen by another name. Most of the companies hide profitability, operating revenue, numbers of employees, and other key variables from public view, and, in a few cases, the information is a state secret.
 In addition to IOCs and NOCs, a third class of oil companies became increasingly popular in the last decade—companies that are part public and part government owned. This is an apt description for companies like ENI, from Italy, OMV from Austria, and Petrobras from Brazil. The publicly owned portion trades on stock exchanges and most GSEs provide key data in annual reports. In some instances, GSEs have shed all previous government ownership. (Prominent examples are BP, Total, Repsol, and Petro Canada. ) Figure 1 classifies companies based on their present status. NOCs are in white, IOCs are in dark gray, and GSEs (as a blend of government and public ownership) are in light gray.
 Typically, IOCs operate in oil importing countries where they manage largerefinery and distribution systems. They also develop large scale oil and gas production projects in countrie where the local NOC lacks the technology and financial resources. Most NOCs stay close to home, developing local resources with the aid of international service companies. The various OPEC governments created NOCs in the 1970 s when they successfully broke away from the major oil companies' influence. GSEs are also the step children of government policy, but their structure provides far greater flexibility. These companies actively seek investment funds and have a structure that allows them to accede major capital markets. Russia IOCs, such as Lukoil, were able to tap western capital markets and expertise. Rosneft, as an NOC, fell behind such private development. Once recast as GSE, however, Rosneft had adequate corporate governance, an incentive to become efficient, and an opportunity to access capital markets.
 Although GSEs structure themselves like modern corporations, their motivations are more complex. The public expects them to be profitable and at the same time, serve broader political goals. Petro China is good example. China National Petroleum Corporation owns the bulk of Petro China, and the government owns all of CNPC. Petro China serves a number of purposes—CI is a bridge between China's state owned enterprises and an emerging class on publicly owned corporations. Both Petro. China and CNPC manage resources in China and invest abroad to secure the country's oil imports. Petro China has a broader agenda than just profitability. The company serves the national interest of China, where government policy makers seek to secure reliable oil imports.
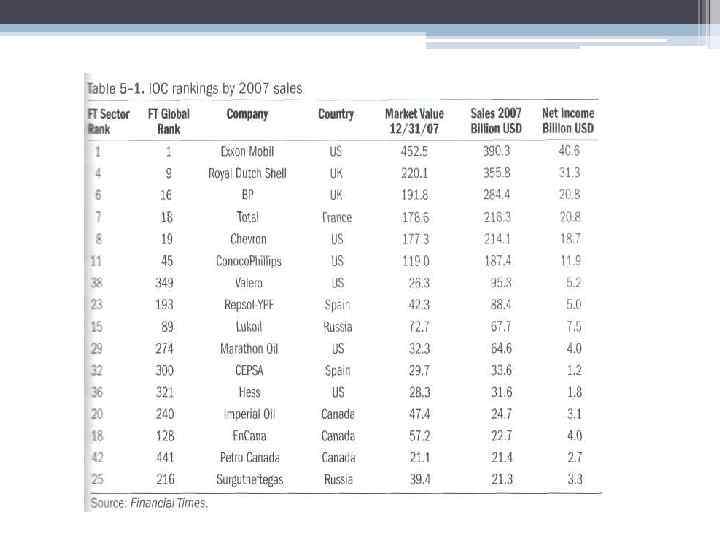
 listed 43 oil and gas producing companies among its top") The Financial Times (FT) listed 43 oil and gas producing companies among its top 500. This group of companies had a total market capitalization of $3. 9 trillion and an annual turnover, or sales, of $3. 2 trillion in 2007. The four remaining sisters—Еххon. Mobil, Royal Dutch Shell, BP, and Chevron—represented only 27% of the FT oil and gas group's market capitalization, and 39% of total sales. Table 5— 1 lists the 16 largest investor owned oil and gas companies, ranked by 2007 sales. The top companies today were at the top in the 1970 s, but only four survive. Today six companies can be classified as traditional majors. The remaining companies are smaller and typically more specialized by sector or geographic area.
The Financial Times (FT) listed 43 oil and gas producing companies among its top 500. This group of companies had a total market capitalization of $3. 9 trillion and an annual turnover, or sales, of $3. 2 trillion in 2007. The four remaining sisters—Еххon. Mobil, Royal Dutch Shell, BP, and Chevron—represented only 27% of the FT oil and gas group's market capitalization, and 39% of total sales. Table 5— 1 lists the 16 largest investor owned oil and gas companies, ranked by 2007 sales. The top companies today were at the top in the 1970 s, but only four survive. Today six companies can be classified as traditional majors. The remaining companies are smaller and typically more specialized by sector or geographic area.
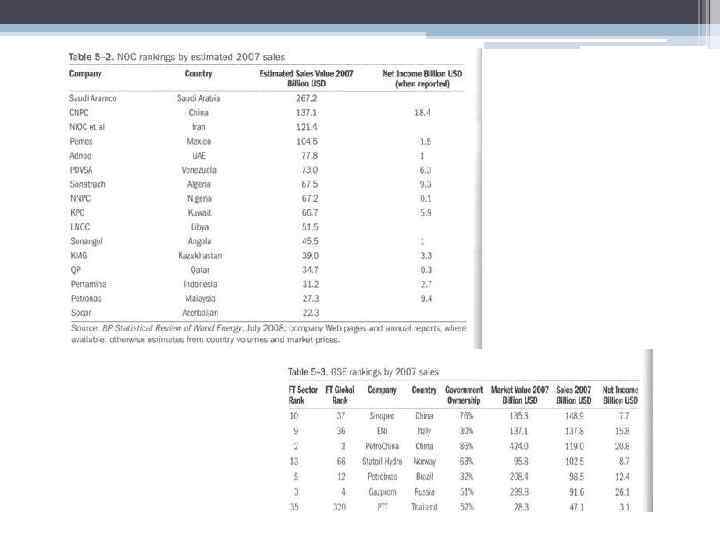
 The NOCs listed in table 5— 2 are mainly from oil exporting countries The figures in the table represent the country's production times the average annual oil price. The GSEs listed in table 5— 3 were designed to meet a variety of national and corporate goals. At one end of the spectrum, Petrobras, Statoil Hydro, Gazprom, and Roseneft, were founded on the intention to manage and control the sponsoring country's oil and gas development. Nonetheless, some of these companies like Statoil Hydro pursue development in other oil producing regions, particular where they have a leading technology, such as deepwater development. At the other end of the spectrum companies like OMV were designed to manage the country's refinery and distribution capacity and procure imported oil.
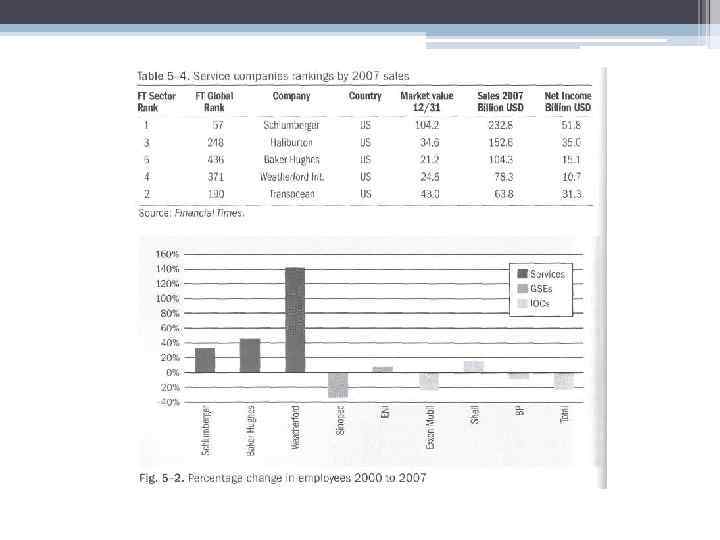
 The Rise of the Service Companies The shift in resource control from vertically integrated multinational corpo rations to the governments of oil exporting countries has been the primary force behind industry restructuring. One aspect of the shift has been a locking out of companies traditionally responsible for the development and management of the world's largest oil fields. NOCs have taken over, but often they lack the expertise to manage and develop and consequently turn to a different type of company. Table 5— 4 lists the five largest energy service companies tabulated by the Financial Times. These companies grew rapidly through the 2005 to 2008 oil boom. In a major turn of events, Schlumberger's 2007 sales revenue was greater than all but two IOCs. As the IOCs consolidated and shrank the service companies grew. Figure 5— 2 illustrates the impact in terms of number of employees.
 Conflicting Political Motivations, Incentives, and Opportunities The international oil industry is a complex and dynamic combination of (public and private ownership. Recently the tide has shifted toward far greater government participation or outright control of the companies that explore or and develop crude oil resources around the globe. The NOCs and GSEs are now the major players for future oil supplies. Western international oil companies "now control less than 10% of the world's oil and gas resource base. " (Baker Institute 2007, p. 1). Western companies are too lower quality and will have a higher cost of development. The most promping oil and gas reserves and greatest potential for new supplies remain in the Midle East, which is unlikely to be opened up to IOCs in the way it once was. Although the extent of government involvement is greater than before, the organizational paradigm is not new. Eight of the IOCs listed in table 5— 1 have had partial or full government ownership at one time in their history.
 Because NOCs do not have to meet these standards set for listed companies, they may be highly inefficient. At its peak, CNPC had more than 2 million employees; the company did everything. The measure of profitability is, however, frequently suspect because many of these companies receive hidden subsidies. The subsidies most often take the form of preferential access to either resources or markets. It is, however, worth pointing out that preferential access to resources has frequently been instrumental in the initial success of a number of previous GSEs that are now IOCs including ENI, Total, Respol, Lukoil, Petro Canada, and Surgutneftegaz. Thus, the pendulum could easily swing back to more exten sive private control and less government involvement. Many of the GSEs, and even some NOCs, could transition to IOCs in the coming decades. All the current GSEs receive some kind of special advantage or access that purely private companies have been denied.
 Political motivations may be in conflict with a firm's profitability. Is the mission of a GSE to maximize profits or to secure energy supplies for its sponsoring government? For example, Petro Canada was required to make substantial investments in oil sands irrespective of oil prices or profitability. The popularity of the NOC struc ture in oil exporting countries reflects a low cost and abundant resource base. Although they often face a dilemma—how to divert the cash flow from government spending to energy projects that would provide a high rate of return. Recent trends in the development of GSE's have been quite different from earlier experiences, such as BP and Petro Canada. Russia is the prime example of a resource endowed country seeking to assert control over the pace of development and the rights to the associated revenue. The Russian experience is unique—shifting from complete government control to privatization and then back to a mix of government and private ownership and control.
 Vertical Integration Table 5— 5 lays out crude oil production and refining capacity of the larger IOCs, GSEs, and NOCs, allowing measurement of vertical integration in the key sectors. Two of the six majors, BP and Chevron, coordinate resources in the traditional manner. That is, they have a balance between crude oil production and refining capacity. Three of the majors, Exxon. Mobil, Royal Dutch Shell, and Conoco. Phillips, are weighted towards refining; that is they depend on a large volume purchase of crude oil to keep their refineries fully utilized. All the majors are active natural gas producers and now count gas reserves in crude oil equivalents. Thus, they are maintaining a reason able balance between production and refining. The remaining large IOCs listed in table 5— 5 vary in their organization. Overall, the major IOCs listed in table 5 5 have crude oil production aver aging about two thirds of refinery capacity. In trading terms they are "net short, " depending on purchased crude oil to round out their refinery runs. The devel opment of efficient markets for crude oil and petroleum products allow greater specialization than in previous eras.
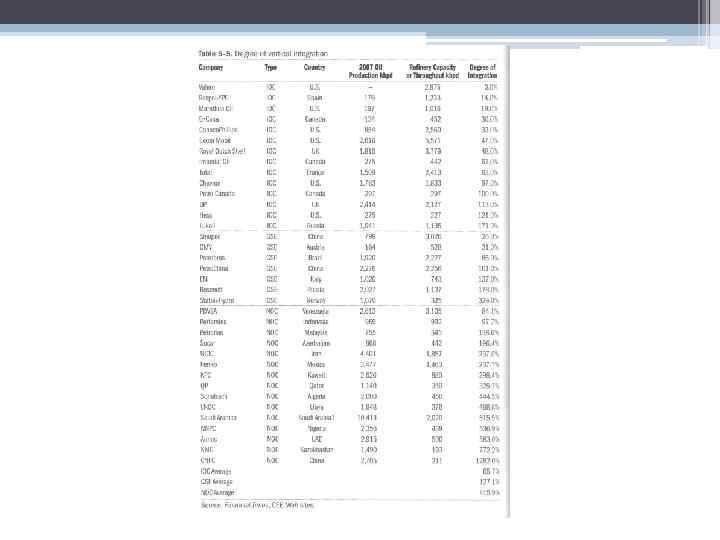
 In contrast, the GSEs in table 5— 5 are closer to the vertically integrated model, with crude oil production 122% of refinery capacity. There is, however, substan tial variation with Sinopec's oil production only 26% of its refinery capacity and Roseneft's at 178%. When governments invest directly in the oil sector, the primary factor influencing the degree of vertical integration is the at hand opportunity. ' Countries with a large resource base have companies that maintain a higher proportion of crude oil production relative to refinery capacity. Countries with a limited resource base are far less likely to have a vertically integrated industry. The NOCs in table 5— 5 have a crude oil production capacity 416% of their refinery capacity. The primary funcproduction and export.