

bcfc85adeb92b7e7830455e7fac430e2.ppt
- Количество слайдов: 71
 The High Plains Project Michael Ward, Professor of Epidemiology, Univ of Sydney Bo Norby, Assistant Professor of Epidemiology Bruce Mc. Carl, DIstinguished Professor, Agricultural Economics Levan Elbakidze, Asst. Prof, Idaho Texas A&M University
 The High Plains Project Goal: “Develop and apply a decision support system that assists policy formulation to efficiently detect and respond to incursions of FMD within the high plains of Texas” – develop framework for integrated decision support systems – timeframe: January to September, 2006
 Deliverables 1. Realistic regional FMD epidemic model in an integrated system 2. Decision support system for FMD incursion assessment 3. Evaluation of mitigation strategies
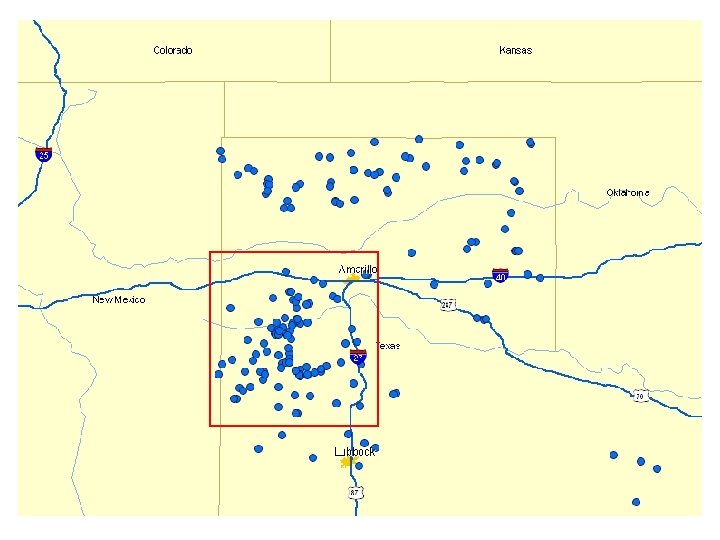
 8 counties 7, 942 miles 2 92 feedlots 2, 231, 300 cattle on feed 411, 019 grazing cattle 17, 471 land parcels
 Specific Objectives • modify epidemic model structure to represent livestock industry in the high plains 3 months • integrate epidemic model with economic models 6 months • investigate the consequences of FMD incursions 1 month • determine the impact of a range of mitigation strategies 2 months
 Study Design Identify Key Industry Components Form spatial, herd type representation of High Plains animals Estimate herd to Herd Animal and Other Contact Rates Study consequences of alternative Disease introduction scenarios Study consequences of ex ante and ex post interventions Stake holder reporting Setup linked regional Epidemiologic/ Economic Model Legend Done First cut done, detailed underway Nearing completion Just beginning Follow on
 Animal and Contact Data: The High Plains Project Bo Norby, Assistant Professor of Epidemiology National Center for Foreign and Zoonotic Disease Defense Texas A&M University
 High Plains Study Area Interviews as per August 28, 2006 Operation types Done Scheduled Cattle on feed 30 … Dairies 12 1 Swine 2 7
 High Plains Study Area 30 Feedlots Interviewed as of August 28, 2006 August 3, 2006
 High Plains Study Area Feedlots Average Median 25 29, 848 27, 100 2, 400 75, 000 Cattle received per month 25 4, 093 4, 300 322 5, 500 Locations received from per day 25 2. 7 2. 4 1. 0 7. 5 Days per month receiving cattle 25 11 9 3 22 Capacities Minimum Maximum Cattle received Average direct contacts per day 0. 99 Cattle shipped per month 25 4, 556 4, 000 300 10, 000 Locations shipped to per day 25 2. 4 2 1 5 Days per month shipping cattle 25 11 10 2 25 Average direct contacts per day 0. 8
 High Plains Study Area
 Application of Epidemic Models: The High Plains Project Michael Ward, Professor of Epidemiology National Center for Foreign and Zoonotic Disease Defense Texas A&M University
 Foot-and-Mouth Disease – can cause economically devastating outbreaks in countries free of infection • $US 1. 6 billion, Taiwan 1997 (Yang et al. , 1997) • >£ 8 billion, United Kingdom 2001 (Kao, 2003) – estimated costs of incursions • $AUD 2– 13 billion, Australia (Anon. , 2002) • $US 6 billion, California (Ekboir, 1999) • $US 14 billion, United States (Paarlberg et al. , 2002)
 FMD Models – response to incursions: rapid application of appropriate control measures – decisions with little current or empirical data political, economic and other issues – disease spread models: guidance on probable extent and time span of an outbreak design of optimal control strategies policy formulation gap analysis: research agenda – links between disease modelers, stakeholders, decision-makers
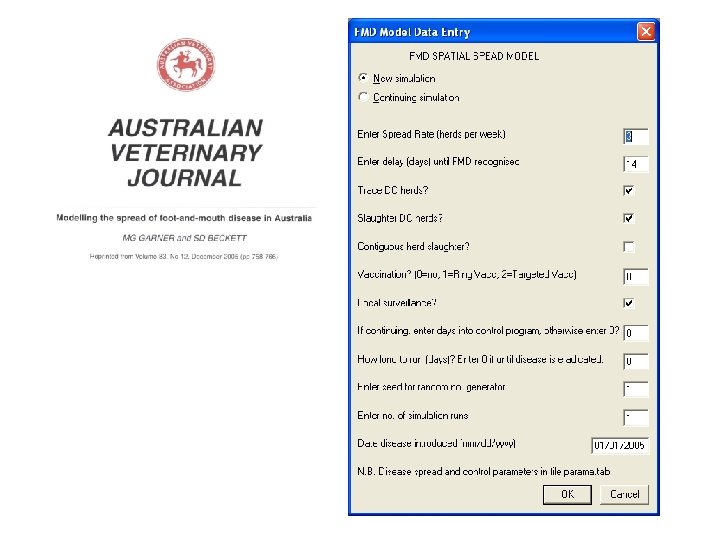
 Aus. Spread Model – state transition, stochastic model – spatial distribution of livestock – industry contact structures – default herd types – FMD virus transmission options • sale barns, auctions, order buyers • wind-borne spread • spread rate parameter
 – SLIR: Susceptible - Latent - Infectious – Recovered") Aus. Spread(Garner and Beckett, 2005) – SLIR: Susceptible - Latent - Infectious – Recovered – Stochastic state transition model which operates within a geographic information system (GIS) framework – Probabilities of transition – functions of direct and indirect contacts – sale barns, order buyers and windborne spread Recovered/ Removed / dead Susceptible α Latent γ β Symptomatic α – Infection rate β - Rate at which latent become infectious γ – Rate of recovery
Aus. Spread(Garner and Beckett, 2005) – SLIR: Susceptible - Latent - Infectious – Recovered – Stochastic state transition model which operates within a geographic information system (GIS) framework – Probabilities of transition – functions of direct and indirect contacts – sale barns, order buyers and windborne spread Recovered/ Removed / dead Susceptible α Latent γ β Symptomatic α – Infection rate β - Rate at which latent become infectious γ – Rate of recovery
 High Plains Study: herd types – in consultation with TCFA, 13 herd types defined: 1. feedlot 1, company-owned 7. small dairy (<1000) 2. feedlot 2, stockholder 8. large dairy 3. feedlot 3, custom 9. backyard beef (<10 head) 4. feedlot 4, backgrounder 10. goat/sheep 5. feedlot 5, yearling-pasture 11. swine 6. dairy calf raiser 7. small commercial beef (<100) 8. large commercial beef
 High Plains Study: feedlots – – – specific location of some feedlot types unknown feedlot locations with capacity estimates known allocated by size: 1. >50, 000 feedlot 1, company-owned 2. 20, 000 50, 000 feedlot 2, stockholder 3. 5, 000 20, 000 feedlot 3, custom 4. feedlot 4, backgrounder: known locations 5. <5, 000 feedlot 5, yearling-pasture 6. dairy calf raiser: one only (10, 000)
 High Plains Study: herd types Figure 1. Number of animals by herd type (n=10, 675)
 High Plains Study: order buyers 26 order buyers estimated based on expert opinion order buyer locations randomly distributed across region day of the week order buyers could sell randomly assigned assumed frequency of selling: once per week order buyers assigned a number of buyers each order buyer was assigned 5, 10, or 15 clients per sale day 50% probability of selling animals within the region 50% probability of selling animals out of the region
: known day-of-week estimated buyers, 100/sale/week (expert opinion)") High Plains Study: sales saleyards (Tulia, Muleshoe): known day-of-week estimated buyers, 100/sale/week (expert opinion) 90% of sales remain in region, 10% out of region buyers assumed to travel between 10 km (minimum) and 150 km (maximum) to a sale assumed 20% probability of buying latently infected animals disease periods (latent, infectious and immune) updated based on expert elicitation of parameters for Texas using an average of the expert response values
High Plains Study: sales saleyards (Tulia, Muleshoe): known day-of-week estimated buyers, 100/sale/week (expert opinion) 90% of sales remain in region, 10% out of region buyers assumed to travel between 10 km (minimum) and 150 km (maximum) to a sale assumed 20% probability of buying latently infected animals disease periods (latent, infectious and immune) updated based on expert elicitation of parameters for Texas using an average of the expert response values
 High Plains Study: scenarios – 5 incursion scenarios, 2 mitigation strategies initially selected to “test” the DSS – scenarios: 1. single FMD incursion, backyard herd 2. single FMD incursion, saleyard facility 3. single FMD incursion, small feedlot 4. single FMD incursion, large feedlot – mitigations: 1. slaughter of infected herds and dangerous contacts 2. slaughter plus ring vaccination
; saleyards shut day") High Plains Study: slaughter begins 1 day post detection (day 15); saleyards shut day 15: only 1 herd slaughtered (index case) days 16 -24: 5 herds/day slaughtered days 25 -30: 7 herds/day slaughtered days >30 10 herds/day slaughtered probability of each targeted herd being slaughtered per day: (capacity for the day) (total number of herds to be slaughtered)
High Plains Study: slaughter begins 1 day post detection (day 15); saleyards shut day 15: only 1 herd slaughtered (index case) days 16 -24: 5 herds/day slaughtered days 25 -30: 7 herds/day slaughtered days >30 10 herds/day slaughtered probability of each targeted herd being slaughtered per day: (capacity for the day) (total number of herds to be slaughtered)
 High Plains Study: vaccination vaccine unavailable until day 21 days 21 -28: 12 herds/day vaccinated days 29 -34: 25 herds/day vaccinated days >34 50 herds/day vaccinated probability of each herd being vaccinated per day: (capacity for the day) (number of herds awaiting vaccination) vaccination reduces the resources available for slaughter by 25% dangerous contact (DC) slaughter stops once vaccination begins (backlogged DC herds placed under surveillance) suspect herds, DC and dead herds not vaccinated
 High Plains Study: current status – 100 model runs per scenario/mitigation combination – run time: ~12 hours ~12 days – current status: Scenario backyard saleyard small feedyard large feedyard = currently running Slaughter Vaccination
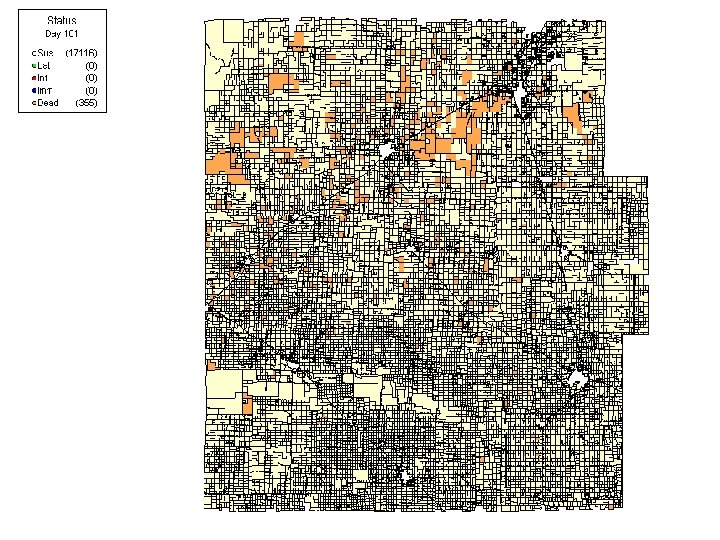
 High Plains: preliminary results – uncontrollable outbreaks (>10% of herds infected by day 60– 120): Scenario Slaughter Vaccination 0 small feedyard 0 100 4 10 large feedyard 29 51 backyard saleyard …
 FMD incursions: slaughter only mitigation strategy Herds infected Av. herds infected Minimum Maximum Backyard 6 1 35 Small feedyard 64 2 459 Large feedyard 183 61 561 Scenario
 FMD incursions: slaughter vs. slaughter and vaccination Herds infected
 FMD incursions: slaughter only mitigation strategy Epidemic length Av. epidemic length Minimum Maximum Backyard 28 2 145 Small feedyard 53 4 118 Large feedyard 75 47 88 Scenario
 FMD incursions: slaughter vs. slaughter and vaccination Epidemic length
 Number of herds infected, small feedlot introduction Herds infected
 Number of herds infected, small feedlot introduction Cattle slaughtered
 FMD incursions: small feedlot scenario Total cattle slaughtered Slaughter only Slaughter and vaccination Ratio Average 18, 030 15, 821 1. 14 Minimum 849 825 1. 03 Maximum 119, 725 68, 342 1. 75 IQR 2, 803 26, 299 2, 416 68, 342 1. 16 2. 60 interquartile range (IQR): 50% of simulation results
 FMD incursions: small feedlot scenario Daily average number of cattle slaughtered Average Maximum IQR Slaughter only Slaughter and vaccination 360 300 Ratio 1. 20 2, 036 2, 004 1. 02 52 – 550 22 – 445 2. 36 – 1. 24
 The next steps … technical issues – data needs and expert opinion • geographic distribution of feedlot types • update other herd types • contact rates: are these realistic? • total contacts versus adequate contacts: have we seriously overestimated spread from feedlots?
 Direct and Indirect Contacts=total number of contacts per day; DContact=total number of direct contacts per day; IContact=total number of indirect contacts per day; PIDC=probability of infection from direct contact; PIIC=probability of infection from indirect contact
 The next steps … technical issues – data needs and expert opinion • number of buyers at sales, destination of purchased cattle • probability of buying latently infected animals at a sale – 20% likely to be too high • probability of selling cattle from an infected herd via a sale – 20% likely too high – – epidemic-economic link: automated carcass disposal and capacity link transportation model for long-distance spread faster simulation speed: re-coding, grid computing
 The next steps … Vulnerability assessment – critical components of the system • E. g. Feed availablity – the role of sales, order buyers – feedlot vulnerabilities – seasonality – multiple FMD incursions – wildlife reservoirs?
 The next steps … Policy issues – increase range, diversity of scenarios simulated … what are the important questions? – increase types of mitigation strategies simulated … what are the options? – policy and response implications … how do you use insights gained to assist policy formulation and decision-making?
 The next steps … Key decision issues – – – – time-to-detection vaccination strategies limited labor availability welfare slaughter and feed availability other vaccine strategies e. g. blanket (area) vaccination to live vs. kill targeted vaccination time to availability of vaccination, decision to employ use of anti-virals timing of control strategies
 High Plains Study design Identify Key Industry Components Form spatial, herd type Representation of High Plains animals Estimate herd to Herd Animal and Other Contact Rates Study consequences of alternative Disease introduction scenarios Study consequences of ex ante and ex post interventions Stake holder reporting Setup linked regional Epidemiologic/ Economic Model Legend Done First cut done, detailed underway Nearing completion Just beginning Follow on
 Economic Effects: The High Plains Project Bruce Mc. Carl, Regents Professor, Ag. Economics National Center for Foreign and Zoonotic Disease Defense Texas A&M University
 Economic Valuation Module • Estimate losses to local livestock industry Valuation Assumptions Epidemiologic output Data Costing Module Results 46
 Economic Module • Economic costing of an event – Livestock cost components • • • Value of lost animals Lost gross income (60 days) Value of vaccinated animals: slaughtered or salvaged (50% value loss) Carcass disposal Quarantined animals Welfare cost/slaughter Cost of strategy implementation – Value of alternative disease management policies • • • Quarantines Vaccination Ring and Target Culling/euthanasia Animal Traceability Surveillance Disinfection Disposal Vulnerability Assessment Applying economics to the problem of balancing prevention, preparedness and response under limited budget Incentive policy design Market Effects Applied to a random set of outbreak simulations 47
 Economic Epidemiological link Linked econ model handles Valuation of lost herds according to distribution by 21 animal categories Gender Age Weight Type Gross income associated with lost animals Gross income associated with periods of inactivity Differential value of alternative herds by size and type Costing of strategies by herd size Welfare slaughter Does this do the market price and consumers’ surplus? 48
 Data • Spread of disease an effects of control options • Epi model – ARS (USDA) Premise boundary data – Texas Commission on Environmental Quality – data on CAFOs – from face-to-face interviews with producers (34 feedlot, 21 dairy, and 16 swine were interviewed) - Management practices and direct and indirect contact rates • Costs of Control Options • • Schoenbaum and Disney 2003, Carpenter and/or Bates Industry representatives • Market values • • • Extension Specialists USDA publications, Texas Agricultural Statistics Industry representatives • Herd Compositions • • Interviews Extension specialists • Various operation costs and assumptions • Industry representatives 49
 Data • Spread of disease an effects of control options • Epi model • Costs of Control Options • Schoenbaum and Disney 2003, Carpenter and/or Bates • Market values • Extension Specialists • USDA publications, Texas Agricultural Statistics • Herd Compositions • Surveys (Bo) • Extension specialists • Various operation costs and assumptions • Industry representatives
 Welfare slaughter • Data from the 2001 UK FMD outbreak reveal that 39% of animals slaughtered for welfare purposes because of movement bans and limited feeding capacity. • There is cost saving potential if welfare slaughter can be reduced. • High plains is at risk • 3 -6 days feed supply • Quarantine longer than that • Mature/young animals may need to be held plus in transit • We examined assumption that in a 3 KM ring there would be no movement and after 8 days in that zone intensive operation cattle lost unless feed left in
 Scenarios Scenario Introduction 1 Backyard 2 “ 3 Saleyard 4 “ 5 Small Feedlot 6 “ 7 Large feedlot 8 “ Strategy Surveillance, Quarantine (3 kilometers), Slaughter of infected and dangerous contacts “ + target vaccination Surveillance, Quarantine, Slaughter of infected and dangerous contacts “ + target vaccination (still running) Surveillance, Quarantine, Slaughter of infected and dangerous contacts “ + target vaccination
 Bottom Line Summary of Average Event Costs by Control Strategy in Million $ Back yard W/out vaccination W/out With vaccination Feed Value vaccination With Feed Sale Yard Small Feed Lot Large Feed Lot 110 1215 172 415 39 314 503 71 -142 -88 95 355 W/out vaccination 7 With vaccination 4 314 503 Value vaccination 3 -219 -148 77 60 W/out Value vaccination 103 1212 3
 Risk Results – what do we see Prob 0. 1 0. 25 15. 66 0. 5 85. 65 0. 75 184. 66 0. 9 206. 87 0. 95 240. 60 0. 99 345. 81 Avg 100 trials each with prob 0. 01 Max amount of money lost with a probability level 10% of time lose $210, 000 or less 50% of time $85, 650, 000 or less 99% of time $345, 800, 000 or less 0. 21 110. 30
 Risk Results – Feed/No Vaccination NO Feed YES Feed 0. 10 15. 7 0. 6 0. 50 85. 6 2. 3 0. 75 184. 7 3. 0 0. 90 206. 9 13. 1 0. 95 240. 6 43. 6 0. 99 Gain to feed with a probability level 10% of time $0 or less 50% of time $83, 300, 000 or less 99% of time $270, 000 or less Moving line to upper left is best 0. 25 Avg 0. 2 345. 8 75. 9 110. 3 39. 0
 Results on all strategies Vaccinate and feed the best Returns to vaccinate much lower with feed Returns to feed lowered by vaccinate Risk much lower with changed managment
 Results on all strategies No Vaccinate and feed the best Returns to vaccinate negative Returns to feed not very great Risk great better management alternative?
 Results on all strategies No Vaccinate and feed the best Returns to vaccinate negative Returns to feed not very great Risk great better management alternative?
 Results on all strategies Feed slightly the best No vaccinate results yet Returns to feed not very great Risk great can’t hardly manage at all? better alternatives?
 Animal Disease Control Options and Objectives • Objectives – Early detection vs. late detection • – Day 7 vs. day 14 (Ward et al. 2007) Early vs. late vaccine availability • • – Day of detection vs. +7 Ring (emergency, 5 km) and target (protective) vaccination Regular vs. enhanced surveillance • – 3 herds on 1 st day and suspects twice/week vs. 6 herds on 1 st day and suspects four/week Culling • • 1 day post detection 1 to 10 on day 21
 Scenarios Large Backgrounder Fdlt Mitigation: Ring Depopulation Enhanced Surveillance Ring Vaccination Targeted Vaccination Lrg. beef Backyard Early detection Late detection Adequate vaccine Inadequate vaccine Early detection 1 5 9 13 17 21 25 29 33 2 6 10 14 18 22 26 30 34 3 7 11 15 19 23 27 31 35 4 8 12 16 20 24 28 32 36 Late detection Adequate vaccine Inadequate vaccine Early detection Late detection Adequate vaccine Inadequate vaccine 37 41 45 49 53 57 61 38 42 46 50 54 58 62 39 43 47 51 55 59 63 40 44 48 52 56 60 64 61
 Results • Early detection 250 Early Detection Median Economic Costs 200 Late Detection 150 100 50 0 Large Feedlot Backgrounder Large Beef Backyard Feedlot Type of Herds 62
 Results • Early vs. late Vaccine availability 350 Adequate Vac. 250 Median Economic Costs 300 Inadequate Vac. 200 150 100 50 0 Large Feedlot Backgrounder Large Beef Backyard Feedlot Type of Herds 63
 Results • Enhanced surveillance Median Economic Costs 200 Enhanced Surveillance 180 160 Regular Surveillance 140 120 100 80 60 40 20 0 Large Feedlot Backgrounder Large Beef Backyard Feedlot Type of Herds 64
 Results • Early detection reduced the median epidemic costs by – – $150 million (68%)- Large Feedlot, $40 million (69%)- Backgrounder Feedlot, $5 million (74%) - Large Grazing, $3 million (97%) - Backyard introductions • Vaccine availability and early application – Increased total costs dues to costs of vaccination and assumed 50% loss in animal value • Enhanced surveillance – – Increased by $53 million (45%) -Large Feedlot. Decreased by $16 million (31%) - backgrounder feedlots, Decreased $1 million (23%)- large grazing operations, Decreased $1. 6 million (77%) - backyard incursion scenarios,
 Results: CDFs of losses in $ Millions 66
 – Large feedlot – RAC Є") Results • Break even RAC (Mc. Carl 1990) – Large feedlot – RAC Є (0. 01; 0. 09) – early detection enhanced surveillance (scenario 17) – Otherwise –regular surveillance and early detection (scenario 1) – Backgrounder feedlot – RAC <-0. 09 –early detection and enhanced surveillance (scenario 18) – RAC >-0. 09 –early detection and regular surveillance (scenario 12) – Large grazing – RAC < 0. 13 – regular surveillance and early detection (19) – RAC > 0. 13 – enhanced surveillance and early detection (3) – Backyard – For all RAC Enhanced surveillance and early detection (20) 67
Results • Break even RAC (Mc. Carl 1990) – Large feedlot – RAC Є (0. 01; 0. 09) – early detection enhanced surveillance (scenario 17) – Otherwise –regular surveillance and early detection (scenario 1) – Backgrounder feedlot – RAC <-0. 09 –early detection and enhanced surveillance (scenario 18) – RAC >-0. 09 –early detection and regular surveillance (scenario 12) – Large grazing – RAC < 0. 13 – regular surveillance and early detection (19) – RAC > 0. 13 – enhanced surveillance and early detection (3) – Backyard – For all RAC Enhanced surveillance and early detection (20) 67
 Results • Welfare cost depends on introduction scenario – High cost in high density and multiple introduction – Feed truck disinfection leads to gains not always large • Vaccination – Effective under backyard introduction – Ineffective under feedlot introductions
 Next Econ Activities in High Plains Study • More on welfare slaughter • Formulation of strategies to examine • More on vaccination • Preventative • Feed Truck disinfection • Sanitary practices • Other?
 Follow on Econ Activities in High Plains and more General FAZD • Follow on • Balance Problem • Examine risks that merit select strategies • Examine resiliency / robustness • Examine compensation and cooperation • Add strategies • Carcass disposal • Disease mkt events
 Scope of Strategy Manipulations • Size of slaughter and vaccination ring • Speed of detection – Diagnostics – Animal inspection, sensors? • Contact rates – Pre event – Post event discovery time to fall • Resources for control – Slaughter force – Vaccination force – Timing and quantity of dose availability • • Feed and welfare slaughter Alternative vaccination strategies Anti-virals Carcass disposal and slow down strategies