129cbdcfad0f7ba3d5f9d5e6f004e95d.ppt
- Количество слайдов: 42
 1, 60, 590 ha") The fate of Wetlands 7, 66, 076 ha ( 2004) 1, 60, 590 ha (2011) Loss in 7 years: 6, 05, 486 ha. 79%; (2004, C. N. Mohan; 2011, SAC)
The fate of Wetlands 7, 66, 076 ha ( 2004) 1, 60, 590 ha (2011) Loss in 7 years: 6, 05, 486 ha. 79%; (2004, C. N. Mohan; 2011, SAC)
 40, 876 ha (2011)") Loss of brackish water wetlands. 3, 48, 111 ha (2004) 40, 876 ha (2011) Loss in 7 years 3, 07, 235 ha; 88%. Ecosystem service value loss: 3, 31 lakh cr. (Rs. 1, 07, 67, 450/ha)
Loss of brackish water wetlands. 3, 48, 111 ha (2004) 40, 876 ha (2011) Loss in 7 years 3, 07, 235 ha; 88%. Ecosystem service value loss: 3, 31 lakh cr. (Rs. 1, 07, 67, 450/ha)
 1, 17, 122 ha (2011)") Fate of freshwater wetlands 4, 17, 965 ha (2004) 1, 17, 122 ha (2011) Loss in 7 years: 3, 00, 841 h (72%) Eco. Service value loss: 66, 918 cr.
Fate of freshwater wetlands 4, 17, 965 ha (2004) 1, 17, 122 ha (2011) Loss in 7 years: 3, 00, 841 h (72%) Eco. Service value loss: 66, 918 cr.
 1. 94 lakhs ha (2014)") Fate of Paddy Lands 8. 75 lakhs ha: (1975) 1. 94 lakhs ha (2014) Loss: 6. 81, 000 ha Ecosystem service loss: 1. 51 lakh cr.
Fate of Paddy Lands 8. 75 lakhs ha: (1975) 1. 94 lakhs ha (2014) Loss: 6. 81, 000 ha Ecosystem service loss: 1. 51 lakh cr.
 Kerala’s annual rice requirement: 45 lakhs tones Current annual production: hardly 6 lakhs tones
 Therefore, the top priority of the State should be to reclaim the lost wetlands, paddy fields and try to increase production and productivity to achieve food security Certainly not AIR PORTS
 Paddy lands (1975 –") Wetland loss in Kerala In 7 years (2004 – 2011) Paddy lands (1975 – 2011) 12, 98, 486 ha. Total ecosystem service value loss 5. 34 lakh crore Who will be accountable for this loss?
Wetland loss in Kerala In 7 years (2004 – 2011) Paddy lands (1975 – 2011) 12, 98, 486 ha. Total ecosystem service value loss 5. 34 lakh crore Who will be accountable for this loss?
 Ecosystem services & Kerala Budget Paddy Eco. Service : 44, 042 cr Brackish water eco. Services: 4, 40, 130 cr. Freshwater wet. eco. service: 26, 628 cr Total ecosystem service : 5, 10, 800 cr. Kerala Budget 2014 - 2015 Expenditure: Rs. 79, 414. 01 cr. Receipt: 79, 558. 56 cr. Ecosystem services are more than 6 times
 wetlands: 124") Total annual ecosystem service values in India (Rs. in lakh cr. ) wetlands: 124 lakh cr. Forests: 76. 95 lakh cr. Total ecosystem service values: 200. 95 lakh cr. Union budget: 2013 -2014 Rs. 17. 63 lakh cr. Ecosystem services are 11 times more
Total annual ecosystem service values in India (Rs. in lakh cr. ) wetlands: 124 lakh cr. Forests: 76. 95 lakh cr. Total ecosystem service values: 200. 95 lakh cr. Union budget: 2013 -2014 Rs. 17. 63 lakh cr. Ecosystem services are 11 times more
 Fate of Rivers Riverine area: 2004: 85, 000 ha 2011: 65, 162 ha Total loss of river area : 19, 838 ha
 How our rivers are shrinking? • • • Reduced down flow Sand mining Large scale abstraction by industries Increased saline ingress Deterioration of catchments Pollution from industries and agricultural run off • Waste dumping • etc
 Groundwater Total groundwater recharge: 2001: 8100 MCM Total groundwater recharge : 2006: 6841 MCM decrease: 1259 MCM Decline 1996 – 2005 13% during monsoon 30% post monsoon (CGWB, 2005) Shaji et. el. 2009
 Categorisation of Blocks in Kerala State GW Development Net draft/Net availability*100 GWDevpt >100% 5 blocks 90 -100% 15 “ 70 -90% 30 “ Rest
 Surface 60") Decadewise Share of Surface Water and Groundwater in Net Irrigated Area (%) Surface 60 50 40 30 20 10 0 Ground water Other sources 1950 -60 60 -70 70 -80 80 -90 90 -2000 2000 -2010 Source: Indian Agricultural Statistics (2008).
Decadewise Share of Surface Water and Groundwater in Net Irrigated Area (%) Surface 60 50 40 30 20 10 0 Ground water Other sources 1950 -60 60 -70 70 -80 80 -90 90 -2000 2000 -2010 Source: Indian Agricultural Statistics (2008).
 Periyar") Water quality Rivers 10 major rivers polluted with pesticides (SACON for KSBB) Periyar : highly polluted with heavy metals Vembanad: heavy metals 20 – 25 times more than 10 years ago (CUSAT) • Lost around 70 microbial organisms • Many areas became dead zones • Only pollutant resistant Polychaetes are present
Water quality Rivers 10 major rivers polluted with pesticides (SACON for KSBB) Periyar : highly polluted with heavy metals Vembanad: heavy metals 20 – 25 times more than 10 years ago (CUSAT) • Lost around 70 microbial organisms • Many areas became dead zones • Only pollutant resistant Polychaetes are present
 • Comprehensive Environmental Pollution Index for Cochin area: 75. 08. 24 th rank among the 64 polluted (Mo. EF & IIT Delhi) cities.
 • Achankoil, Kuttiyadi, Chaliyar, Kallayi : all samples had coliform bacteria, during pre-monsoon 65 -100%; varied in other seasons. (Economic Review 2012).
 Quality of ground water Flouride: Alappuzha and Palakkad 1. 5 & 1. 8 mg/litre (maximum) Most parameters (Coliform; p. H; TDS) are beyond desirable limit (IISC, 2007)
 Mother’s gift to the baby: Umbilical code contains: 287 pesticides and heavy metals 180 cause cancer 217 : toxic to brain and nervous system 208 cause birth defect/abnormal development
 Fish species Loss Earlier Current Loss Nileshwaram river 50 25 Kuppam river 38 12 26 Valapattanam river 55 11 44 Kuttiyadi river 38 10 28 Kallayi river 33 9 24 Chaliyar river 63 35 28 Kadalundi river 31 14 17
 Loss of Fish species Earlier Present Loss Bharathappuzha 73 24 49 Chalakudy river 87 38 49 Periyar 84 36 48 Pampa river 60 22 38
 Drinking water Scarcity, contamination, accessibility 34% water for drinking are contaminated with iron, fluride, salinity, nitrate, arsenic, and bacteria (State Economic Review 2012)
 70% house hold depend on wells, ponds, tanks, rivers, streams etc 30% on treated tap water Proliferations of bore wells lead to water scarcity
 Privatization of Water • Water: a fundamental right of all organisms including human beings • Right to life is a fundamental right enshrined in the constitution • Right to life includes right to clean water , clean air as per the Supreme Court • Ensuring this right to every citizen is the basic responsibility of the Government
 No wetlands, paddy fields, rivers, water bodies and no forests shall be destroyed in future for any development projects.
 A totally different Development paradigm
 GDP based development Economic growth in India GDP during 1950: 3% GDP during 2011: 9%
 India 2011 : 1, 53, 000 Source: http: //www. andhranews.") Millionaires (possessing 5 crores) India 2011 : 1, 53, 000 Source: http: //www. andhranews. net/Intl/2011/India 153000 -millionaires-Report-10958. htm,
Millionaires (possessing 5 crores) India 2011 : 1, 53, 000 Source: http: //www. andhranews. net/Intl/2011/India 153000 -millionaires-Report-10958. htm,
 in 2012 54") Number of billionaires (possessing Rs. 5000 crore) in 2012 54
Number of billionaires (possessing Rs. 5000 crore) in 2012 54
 1950 3, 000 1980: 52, 000 1991: 2, 34, 000 2010: 4, 00, 000
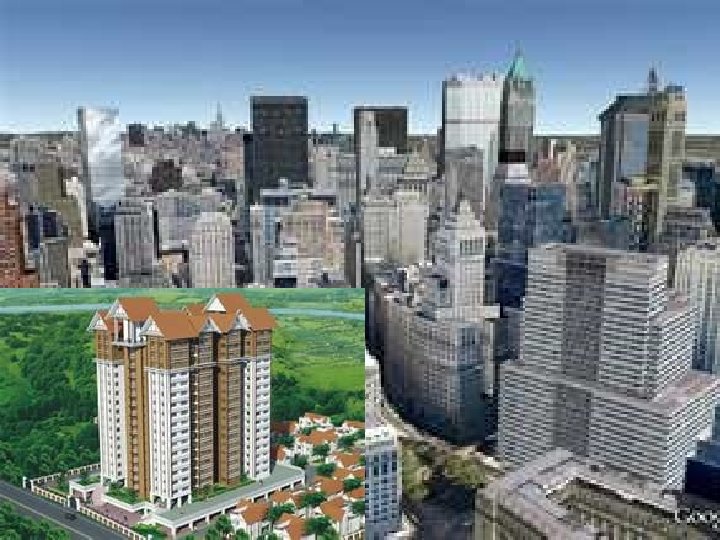
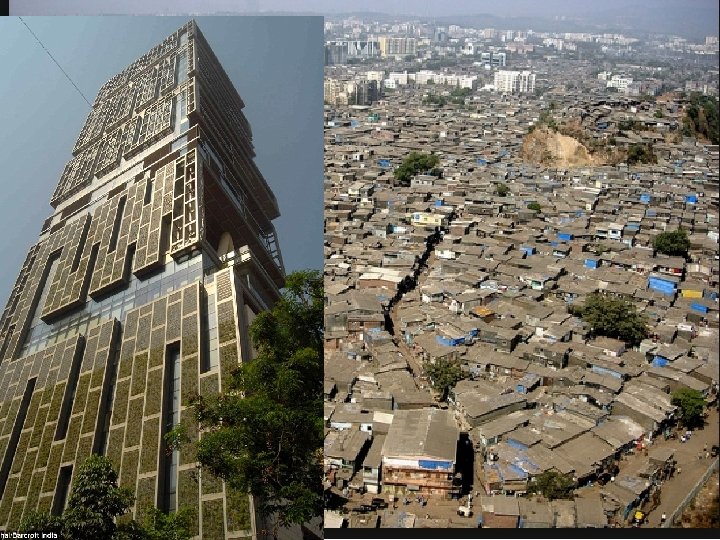
 See the other side of India Shining India
 45% below poverty line Polluted the air, water, soil & food
 • • 49% of Indians do not have toilet – they do it in the open • Child death before the age of 5 every year : 21 lakhs (Diarrhoea, typhoid, malaria, measles, pneumonia)
 Slum dwellers: 4. 26 crore.
 Homeless: 2. 7 crore
 Agro-biodiversity Rice : 1, 10, 000 varieties Currently about 10 – that too hybrids 1975 : 8. 75 lakhs ha 2014: 1. 9. 4 lakhs ha Tubers
 Farm suicide 2005 – 2012 2, 84, 694 National Crime Records Bureau
 Holistic Eco-friendly Development Pprogramme ശ ദധ ജല ശ ദധ ഭകഷ ണ ശ ച തവ പര സ സ മപ ര തത ക ഭദരത ക ട ബസ വ യ സ മ ഹയ ആര ഗയ സ രക ഉപജ വ ഷണ ന സ രക ഭ വന ഷ ജ സ ര അട സ കഷ ഥ ന വ ദയ
 The achievements of the government must be assessed by the conservation of the number and extent of these life supporting systems.