f16415f0475ba0e2802f5331720d7a92.ppt
- Количество слайдов: 38


The Evolution of Substantive and Descriptive Representation, 1974 -2004 David Epstein Sharyn O’Halloran Columbia University

Georgia’s Gerrymander Range Baseline Proposed 0 -25 31 26 25 -40 11 17 40 -50 2 0 50 -60 2 8 60+ 10 5 Plan: Reallocate black voters to elect Democrats

Is This Retrogression?

The Perfect Storm o o DC denied preclearance, saying state didn’t prove non-retrogression in three districts SC overruled in Georgia v. Ashcroft: n n n Retrogression should be assessed statewide, not district-by-district States could pursue substantive rather than descriptive representation Put much weight on testimony of black legislators

Consensus View o A conventional wisdom is forming about the meaning and importance of Ashcroft: 1. 2. 3. It abandoned a previous, “relatively mechanical” retrogression test based on electability; It did so in favor of an amorphous concept of substantive representation that will be difficult to administer; and The crux of the debate revolves around whether states should pursue substantive as opposed to descriptive representation.

This Paper o We disagree with all three of these statements n The previous standard for retrogression was crumbling anyway, due to political changes o n n The Court revised this, too, in the opinion, moving to a statewide assessment of retrogression Substantive representation is not difficult to measure and administer Real arguments aren’t over descriptive vs. substantive representation, for the most part o Rather, the question is on how best to achieve secure levels of substantive representation

Electability: High Polarization

Measuring Descriptive Representation High Polarization P* % BVAP 0 50 100

Measuring Descriptive Representation High Polarization P* % BVAP 0 50 No Minority Control 100 Minority Control

Electability: Low Polarization

Measuring Descriptive Representation High Polarization P* % BVAP 0 50 No Minority Control Low Polarization 100 Minority Control P* % BVAP 0 50 100

Measuring Descriptive Representation High Polarization P* % BVAP 0 50 No Minority Control Low Polarization 100 Minority Control P* % BVAP 0 50 Coalitional 100

Measuring Descriptive Representation High Polarization P* % BVAP 0 50 100 Minority Control No Minority Control Low Polarization P* PS % BVAP 0 50 Coalitional Unsafe Control 100

Measuring Descriptive Representation High Polarization P* % BVAP 0 50 100 Minority Control No Minority Control Low Polarization P* PS PP % BVAP 0 50 Coalitional Unsafe Control 100 Safe Control Packing

Measuring Descriptive Representation High Polarization P* % BVAP 0 50 100 Minority Control No Minority Control Low Polarization PI P* PS PP % BVAP 0 No Minority Influence Control 50 Coalitional Unsafe Control 100 Safe Control Packing

Measuring Descriptive Representation High Polarization P* % BVAP 0 50 100 Minority Control No Minority Control Low Polarization PI P* PS PP % BVAP 0 50 No Minority Influence Control Coalitional Unsafe Control 100 Safe Control Packing How to make tradeoffs?

Retrogression in Electability o Forget categories; just use the probability of electing a minority candidate in each district n Estimate this using “S-curves”

Low Polarization

Retrogression in Electability o Forget categories; just use the probability of electing a minority candidate in each district n o Then add up the probabilities to get the expected number of minorities elected n o Estimate this using “S-curves” Can consider the variance of this distribution, too For Georgia, the proposed plan had slightly fewer expected minorities elected n Problem with overpopulated districts

Ashcroft & Substantive Representation Descriptive Pareto Frontier Substantive

Ashcroft & Substantive Representation Descriptive Pareto Frontier SQ Substantive

Ashcroft & Substantive Representation Descriptive Pareto Frontier 2 3 SQ 1 4 Substantive

Ashcroft & Substantive Representation Descriptive Pareto Frontier 2 3 SQ 1 X 4 X Pre-Ashcroft Substantive

Ashcroft & Substantive Representation Descriptive Pareto Frontier 2 3 SQ 1 X 4 Post-Ashcroft Substantive

Ashcroft & Substantive Representation Descriptive Pareto Frontier 2 3 SQ 1 X 4 P Substantive A move to P is now non-retrogressive

Measuring Substantive Representation o Great leaps have been made in the past two decades in the analysis of voting behavior n o Not because voting is the only important act n o This is now commonly used as a measure of members’ policy preferences But because it correlates with constituency service, committee work, etc. For substantive representation of black interests, define a legislator’s Black Support Score: BSS= % of votes cast with the black majority

White Dem. Black Dem. South Carolina State House Rep.

Overall Expected Representation o Can compare plans by calculating the expected substantive representation n n Combines prob. of election and support scores For Georgia, this was: Baseline Proposed o Mean 62. 3% 65. 9% Median 50. 2% 69. 2% Real argument is over the distribution of these scores, not over descriptive vs. substantive representation

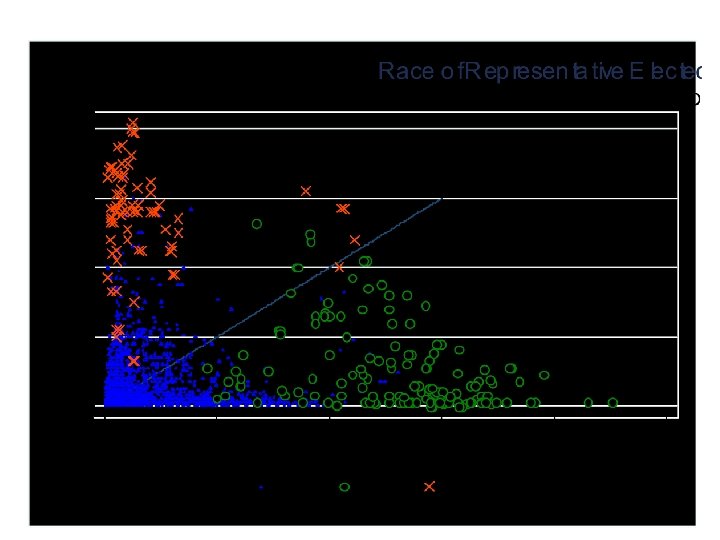
Trends, 1974 -2004 o Show changes in n o Election probabilities Substantive representation Maximizing plans Results: n n n Greater crossover in voting means point of equal opportunity is under 50% BVAP Southern Democrats become more liberal A tradeoff emerges between substantive and descriptive representation

Republicans White Dems Black Dems Probability White Dems Republicans Black Dems Republicans Probability Republicans White Dems

Substantive Representation, 1974 -2000
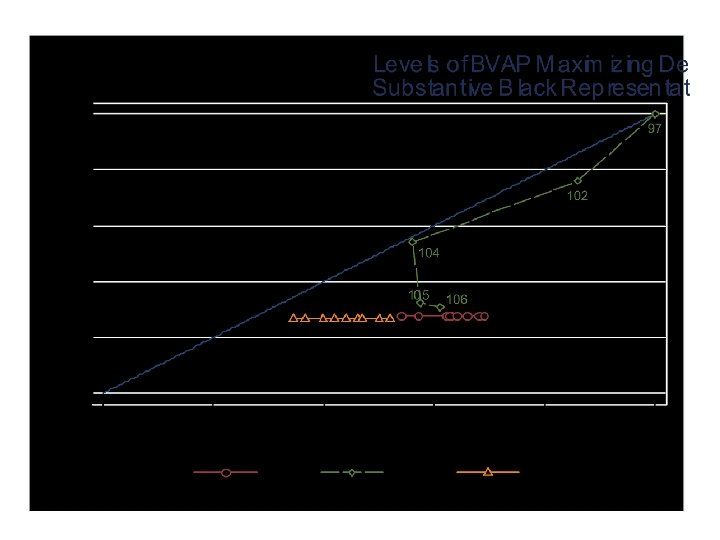

The Emerging Pareto Frontier

BVAP & HVAP Combinations for PEO

Georgia State Senate, 1999 -2002

Descriptive Representation, 1974 -2000

Black Dem. White Dem. Rep.
f16415f0475ba0e2802f5331720d7a92.ppt