804998184feaac0e5d32f61169c81558.ppt
- Количество слайдов: 80


The Education Library Layout What is Spatial? Slides: 1 2 3 4 62 Community Expectations Slides: 5 6 7 Case Studies 8 Qld 9 Vic 10 Aust 11– 12 WA 13 Aust 14 – 24 NZ Locating the Resource Defining the problem Slides: 25 26 27 28 29 30 31 32 33 34 Slides: 35 36, AB printing 37 Structured Searches Slides: 38, A printing 39 40 41 Metadata Slides: 42, A printing 43 44 45 46 Standards Slides: 47 48 49 50 Profile Slides: 60 61 51 52 53 54 55, AB printing ANZMet Lite Slides: 56 57 58 59 Metadata Education for Non-spatial Audience Technical Education for Use of the Metadata Entry Tool The ratio of slides to allocate for your presentation depending on the audience

ANZLIC Spatial Resource Discovery and Access Toolkit - Introducing Metadata - Images contained in this presentation are licensed under Creative Commons BY-NC-ND. If you use your own images, the license reverts to

Introduction ANZLIC, the Spatial Information Council, is the peak intergovernmental organisation providing leadership in the collection, management and use of spatial information in Australia and New Zealand. The Office of Spatial Data Management (OSDM) facilitates and coordinates spatial data management across Australian Government agencies. Images contained in this presentation are licensed under Creative Commons BY-NC-ND. If you use your own images, the license reverts to

What is spatial?

What is spatial information? “Spatial information …describes the physical location of objects and the metric relationships between objects. ” Google Maps Initially, spatial information was accessed in the form of a paper map Google Maps Google Earth Even aerial photography was easily available for a price Now Web 2. 0 allows mashups to create freely available spatial information online.

Everyday spatial use from A convergence of: § § § Off the shelf technology User knowledge and expectations Complex national drivers With recognition of: § § The power of ‘place’ an estimated 70 -80% of all government transactions having a land or geographic component Courtesy MODIS Rapid Response Team

Everyday Spatial Use FUNDAMENTAL Cadastre Roads Imagery Topography Census Admin. Bdys. LOCATIONAL Police Fire Ambulance SES Schools Hospitals Aged care Community Centres Icons Key buildings Sports facilities CCTV Conybeare 2001 DYNAMIC Demography Employment Valuations Public transport schedules Pedestrians Floor plans Hazard models etc. INFRASTRUCTURE Electricity Sub-stations Gas Water Hydrants Sewerage Stormwater Telecoms

Community expectations

Spatial expectations of the future now. Where is: Geoscience Australia? Street View Google Maps You not only get where it is on a road map, but a visual picture of what the building looks like when you get there.

Why this expectation? § an estimated 70 -80% of all government transactions having a land or geographic component. Credit Card billing to pay rates… Education Records Block & Section Rates, Power, Water Address Shopfront taking post code on enquiry Employee Records Free. Digital. Photos. net Medicare Number Income Tax Dental Records Electoral Roll

Spatial effect on Community Key areas of use at state and territory level include the following: http: //maps. met. p olice. uk • urban planning • service planning and delivery • land management and planning • crime prevention and response • emergency management, for police, fire and ambulance services - ACIL Tasman report 2008 www. intelematics. com. au

Community Expectations - Case Studies

The Impact of Spatial Case Study I If we get it right: “Energex is an electricity distributor servicing about 2. 7 million people in South East Queensland. It has • $6. 6 billion in assets • covers 25, 000 sq. km. • 50, 000 km of electricity lines and cables • half a million power poles • 43, 000 transformers and 290, 000 street lights. ” When Energex upgraded their geospatial technology in 2005 by linking their customer systems with the existing GIS: • They found “$500 million worth of assets” • Prior to the upgrade, Energex operated a call centre with 10 people involved in handling emergency calls. The same load is currently handled by only 1 person. ”

The Impact of Spatial Case Study II Victorian Department of Justice Speed Camera locations and certification. • 80% cut in requests to challenge the fine. © Victorian Government

The Impact of Spatial Case Study III In the ACIL Tasman report, prepared for the CRC for Spatial Information in March 2008, it was found that: • Australian Government agencies spent around $85 million on spatial data production and management in 2006 -07. • geospatial information has enhanced the way in which many Australian Government agencies plan and deliver services. • 67% of agencies expected to reduce costs significantly due to improved business processes and 64% expected to reduce staff costs and other direct costs.

The Impact of Spatial Case Study IV Western Australian Government study - 2004 A Western Australian Government Taskforce found that substantial gains were likely from integrating land geographic data held by State agencies. This integration would include: • • steps to clarify data custodianship, the establishment of a land information directory, standard procedures for data collection, and improved marketing of data. The annual costs of integrating land information were estimated at $1. 8 million and the potential annual benefits at $10. 7 million – resulting in a benefit/cost ratio of 5. 9 : 1
")
The Impact of Spatial Case Study V The Western Australian Land Information System (WALIS) is an alliance of diverse public and private sector organisations, as well as community groups. It: • oversees the management of spatial information across the state community, and • it coordinates capture of fundamental spatial data through the State Land Information Capture Programme.

The Impact of Spatial Case Study VI Case study - asthma The Australian Institute of Health and Welfare’s latest Burden of Disease and Injury report shows that • 4, 045 years of life (YLL) were lost to asthma in 2003 – this is due to premature deaths attributed to the disease • in addition to the 59, 054 years of life with disability (YLD) attributable to asthma in 2003. Even a conservative valuation of $150, 000 per YLL and $50, 000 per YLD would put the total loss to Australia due to asthma alone at $3. 6 billion in 2003. More accurate spatial information enabling a 10% reduction in these figures would therefore be worth at least $370 million per year.

Spatial Case studies from NZ Case Studies VII • NZ Case I: Geological and Nuclear Sciences’ Earthquake Risk Assessment Research (Courtesy of GNS) • NZ Case 2: Forestry NZ Ministry of Agriculture and • NZ Case 3: Ravensdown Precision Agriculture

area threatening one site GNS Risk assessment research NZ Case Study Use of their modelling can save $100’s of thousands in individual organisations’ insurance premiums, for example, the Presbyterian Church & Ministry of Corrections properties.

GNS Risk assessment research =

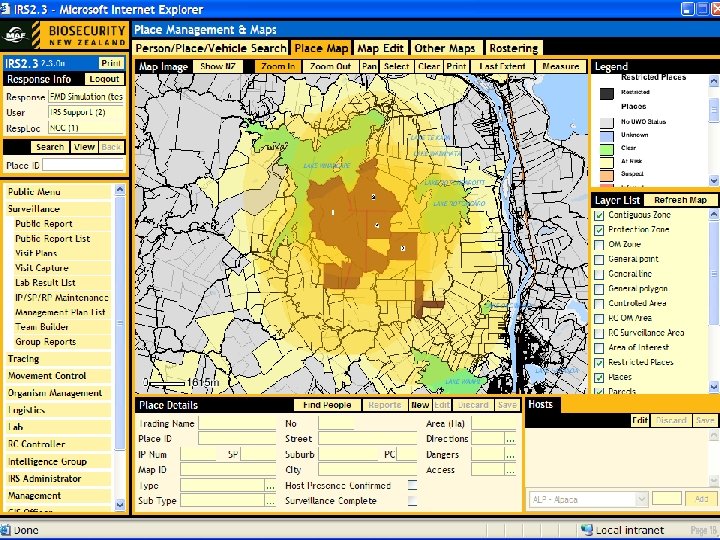
NZ Ministry of Agriculture and Forestry NZ Case Study New Zealand’s Incursion Response System • To mitigate the effects of any fast-moving exotic organism incursion – e. g. Avian flu, Foot-and-Mouth Disease (Foot-and-Mouth potential cost of $6 billion and 20, 000 jobs loss in first year) • Rapid response is the difference between a minor or major disaster • Biosecurity is a critical area needing ready access to accurate geospatial information

Ravensdown Precision Agriculture NZ Case Study • NZ Primary Industries contribute 7. 2% to GDP annually & represent more than 50% of the country’s export earnings. Agriculture alone contributes NZ$19 billion annually. • Generally it is accepted that higher efficiency in the industry will translate to higher earnings BUT, there are future challenges and opportunities around: • Traceability • Environmental impact • Emissions Trading and Carbon Storage

Creating Value through Spatial Intelligence and Traceability • • Soil Sampling Soil Testing Nutrient Budgeting Fertiliser Planning Spreading Application Nutrient History Archiving Nutrient Reporting Ease of access to information


Creating Value through Spatial Intelligence and Traceability

Creating Value through Spatial Intelligence Data captured every 1 second and Traceability Event Name, Operator, Material, Crop, Weather, Notes, Date, Time, Field latitude, Field longitude, Field Area, Productive Area, Area Units, Perimeter, Pattern, Number of Headlands, Swath Width, Application Width, Average Offline, Standard Dev. Offline, Total Time, Total Distance, Application Area, Spread 70 kght 2 Murray Smith Dap Grass Drizzling Night time 16 -Apr-2003 18: 40: 01 45° 32' 35" S 167° 54' 33" E 13. 2899 ha 1495. 4456 Headlands 0001 28. 0000 0. 0375 1. 5165 000: 22: 20. 94 4945. 6755 13. 8479

Creating Value through Spatial Intelligence and Traceability In the future: 3 D GIS modelling of the properties tied into the management system.

Defining the problem
![Spatial Impact on the Australian Economy The [ACIL Tasman] study estimates inefficient access to](https://present5.com/presentation/804998184feaac0e5d32f61169c81558/image-31.jpg "Spatial Impact on the Australian Economy The [ACIL Tasman] study estimates inefficient access to")
Spatial Impact on the Australian Economy The [ACIL Tasman] study estimates inefficient access to data reduces the direct productivity of some sectors by between 5% and 15%, and highlights the reasons for this.

Spatial Impact on the Australian Economy Social, economic and environmental activities where there has been direct impact include: © State of Victoria Dept of Primary Industries Reproduced with permission © Commonwealth of Australia 2009 © Commonwealth of Australia Courtesy Chris&Steve 2009 Courtesy Longreach Regional Council © CSIRO 2009 Courtesy M. Smith Courtesy City of Sydney Courtesy GAVA Courtesy SWDC © State of Victoria © BHP Billiton 2009 Courtesy SWDC

Spatial Impact on the Australian Economy “It is conservatively estimated that industry revenue in 2006 -07 could have been in the order of $137 billion annually and industry gross value added around $682 million. ”ACIL Tasman Report This is from: • a gain in GDP • increased household consumption • increased investment • imports and exports higher • real wages were higher

Why labelling the resource matters Users of spatial data also have questions about the data that they obtain from other sources. • What is the accuracy of the data? © NLA Smith, J D • Who created it? Smith, John D • How large is this dataset? John Smith • What is the geographic extent of the dataset? • When was the data created? • How often is the data updated? • What restrictions are placed on its reuse?

Why labelling the resource matters Users of spatial data also have questions about the data that they obtain from other sources. • What is the accuracy of the data? • Who created it? • How large is this dataset? Smith, J D Smith, John D John Smith

Why labelling the resource matters Users of spatial data also have questions about the data that they obtain from other sources. • What is the accuracy of the data? • Who created it? • How large is this dataset? • What is the geographic extent of the dataset? • When was the data created? • How often is the data updated? • What restrictions are placed on its reuse? © NLA

Using labels to locate resources If we start with an object… … we will need to answer some questions about it…

Using labels to locate resources Is there a user guide? Who created this? When? What intellectual property rights are vested in the object? What format is it? What software will I need to render it? Is this software currently available? Are there any other dependencies? Is it related to other objects located within this (or any other) repository? Can I be sure that the object is what it claims to be? Who currently has custody of this? Who updated it? When? Has the object been updated?

Business benefits of using a standard label • Valuing your data as a business asset • Being able to locate the data Only 20% of enterprise documentation may exist in paper format. 1 This is equivalent to “Information workers 2. 2 hrs per day spend up to 30% of or their working day just $15, 000 of a looking for data they need $50, 000 annual salary to complete a task…” - Butler Group Dec’ 06 (based on a 36. 75 hr week) In other words, for an organisation with 1, 000 staff at this pay level, $15 million a year is spent looking for company information out of existing systems.

Business benefits of using a standard label • Valuing your data as a business asset • Being able to locate the data • Fitness for purpose Across Australia, almost 50% of employees find the greatest obstacle to how they make decisions at work is the lack of accurate, consistent and complete information. 3

Business benefits of using a standard label • Valuing your data as a business asset • Being able to locate the data • Fitness for purpose • Effective risk mitigation tool 90% of the documents that are created have no useful metadata. As a result, as much as 10% of a company's salary costs are wasted on ineffective searches. 1 Overcoming ineffective searches is certainly a priority for law firms due to changing regulatory and risk considerations. 1 Poor information leads to poor decisions, wrong information leads to wrong decisions.

Locating the resources

Finding the information The unstructured search “ 20 -25% of queries per day have never been seen before. ” 400 million unique downloads since 2005

Finding the information The Unstructured Search more structured Search ANZLIC metadata profile site: au 3, 510 43, 400 1, 600 Results: 53, 100

Finding the information The unstructured search ANZLIC Results: 53, 100

Finding the information The more structured search ANZLIC metadata profile site: au Results: 1, 600

Finding the information A growing portion of the Web cannot be indexed by standard search engines. Databases… create "pages" dynamically on demand for an individual user, and thus are not available for a search engine's spider to scan. This is often called the “Deep Web”

Structured Searches

The solution – structured searches How can I find a particular resource at my workplace? e. g. the 1999 Annual General Report for your division Using the search function in your file management system, your success will depend on how the file was initially labelled before saving. Final Annual Report 30 -6 -99 30 Jun 1999 CSDC Annual 1999 Annual. Report General Report 30 Jun 1999 OSDM Draft General Report General 30 Jun 1999

The solution – structured searches How can I find a particular resource at my workplace? e. g. the 1999 Annual General Report for your division Using the search function in your file management system, your success will depend on how the file was initially labelled before saving. Annual General Report 30 Jun 1999 Draft Annual General Report 30 Jun 1999 Final Report 1999 OSDM Annual General Report 30 Jun 1999 CSDC Annual Report 30 -6 -99

The solution – structured searches So you need structured information that describes, explains, locates or otherwise makes it easier to retrieve, use or manage an information resource. This is Metadata. It is simply a file that sits with each record and provides background information about that record that is “computer readable”. Courtesy of North Caroline State Archives

Discovery Metadata is the starting point for access as it provides the means for ‘discovery’ of spatial information. e. g. the Australian Spatial Data Directory However • metadata remains in many formats; and • many are currently not completely valid. For example, a recent study of 5, 141 metadata records of NSW natural resource sectors confirmed that the records were out of date and could not be automatically upgraded to fit the ANZLIC 19115 profile.

Discovery If you create metadata, other people can discover your data. If you create metadata, you can find your own data.

Metadata

What’s Metadata? • A painting by Gauguin sold at two Auction houses at the same time. Sotheby’s had the real one… • How did they know? Lilac Bouquet 1885 • One painting had provenance (metadata). • One didn’t.

What’s Metadata? • A painting by Gauguin sold at two Auction houses at the same time. Sotheby’s had the real one… • How did they know? Lilac Bouquet 1885 • One painting had provenance (metadata). • One didn’t.

What’s Metadata? Metadata is information about a resource that can be used to identify, assess and access that resource without actually having to touch that resource. Identify • keywords • geographic location • time periods • attributes Assess • use constraints • access constraints • data quality • availability/pricing Access • online access • order process • contacts

Using labels to locate resources Imagine walking down your supermarket shopping aisle looking for a specific can of food but there were no labels on the products. Courtesy M. Teresa Simao

What’s in this Can?


Standards
 is a world-wide federation of national")
Standards • The International Organization for Standardization (ISO) is a world-wide federation of national standards bodies. • It is responsible for promoting the development of standards to facilitate the international exchange of goods and services. www. oceantrader. com www. fortunewatch. com

Standards A popular geographic standard, ISO 19115, contains almost 300 metadata elements, most of which are optional. The ANZLIC 19115 profile is made up of 24 of these elements. Another commonly used archival standard is Dublin Core and the Australian Government Locator Service (AGLS) was derived from a hybrid of this and ISO 19115. The AGLS and ANZLIC profile are regularly reviewed an overview of common elements is available.

Standards A standard establishes: • common terms • common definitions • common structure (whether an element is mandatory, conditional on another element, or optional) • a method for extending the profile to address specialized or custom needs ab·stract (for adj. , ab strakt, ab′strakt) adjective • thought of apart from any particular instances or material objects; not concrete • expressing a quality thought of apart from any particular or material object beauty is an abstract word • not easy to understand because of being extremely complex, remote from concrete reality, etc. ; abstruse • theoretical; not practical or applied • designating or of art abstracted from reality, in which designs or forms may be definite and geometric or fluid and amorphous: a generic term that encompasses various nonrealistic contemporary schools

The value of standard labelling When it goes wrong… “Two Teams, Two Measures Equaled One Lost Spacecraft” “A team of Lockheed Martin engineers sent NASA key manoeuvring data for the $125 million Mars Climate Orbiter in non-standard units, probably since the craft was launched in 1998, according to a NASA official trying to explain the loss of the craft. © NASA Miscalculations due to the use of English units instead of metric units apparently sent the craft slowly off course – 60 miles in all – leading it on a suicide course through the Martian atmosphere. House Science Committee Chairman F. James Sensenbrenner, Jr. , sounding stunned, released a twoword statement after hearing the news about the miscommunication: "I'm speechless. "

Profile

19115: 2003

ISO 19115: 2003 Scope. . . the schema required for describing geographic information and services. . information about the identification, the extent, the quality, the spatial and temporal schema, spatial reference, and distribution of digital geographic data. . applicable to the cataloguing of datasets, clearinghouse activities, and the full description of datasets for a wide range of geographic applications. …applicable to geographic datasets, dataset series, and individual geographic features and attributes. . . may be used for other forms of geographic data such as map, charts, textual documents

The ANZLIC ISO 19115 Profile has been created from the ISO 19115 Standard. Minimum ISO Elements ANZLIC Core Elements Opportunity for Community to specify extended elements.

What are ANZLIC elements? • ANZLIC 19115 elements provides the structure to describe resources. • Whilst it was implemented for the use of the spatial community, it also provides appropriate information about all resources.

What are elements? Mandatory • Title Optional • Keywords • Date of next update • Abstract • Contact Conditional • Language • Character set • Topic category • Maintenance • Status • Fitness of Use • Classification • Legal • Geographic location • Lat/Longitude Elements are the descriptors used to label the resource

ANZLIC elements
 code…")
What they look like People readable HTML… XML (machine search-able) code…
 code…")
What they look like XML (machine search-able) code…

What they look like People readable HTML…

ANZMet Lite

How will you apply the label? Circa 1920’s Office scene courtesy of www. officemuseum. com

An example of a Metadata Entry Tool

Metadata elements Is it part of a bigger set? What kind of data?

FAQ - The ANZMet Lite How much does the MET cost? • This tool is currently free for Government use. Can we have other elements added for our community of practice? • This tool was chosen because of it’s adaptability but it will cost you the time of a programmer to add the components you require.
804998184feaac0e5d32f61169c81558.ppt