

3a41ff80821e1dd097d7112a698d1c91.ppt
- Количество слайдов: 79
 The Data Avalanche Talk at University of Tokyo, Japan October 2005 Jim Gray Microsoft Research Gray@Microsoft. com http: //research. microsoft. com/~Gray
 Numbers Tera. Bytes and Gigabytes are BIG! • • Mega – a house in san francisco Giga – a very rich person Tera – ~ The Bush national debt Peta – more than all the money in the world • A Gigabyte: the Human Genome • A Terabyte: 150 mile long shelf of books.
 Outline Historical trends imply that in 20 years: 1. we can store everything in cyberspace. The personal petabyte. 2. computers will have natural interfaces speech recognition/synthesis vision, object recognition beyond OCR Implications We are here 1. The information avalanche will only get worse. 2. The user interface will change: less typing, more writing, talking, gesturing, more seeing and hearing 3. Organizing, summarizing, prioritizing information is a key technology. Yotta Zetta Exa Peta Tera Giga Mega Kilo
 How much information is there? Yotta • Soon everything can be recorded and indexed • Most bytes will never be seen by humans. • Data summarization, trend detection anomaly detection are key technologies See Mike Lesk: How much information is there: http: //www. lesk. com/mlesk/ksg 97/ksg. html See Lyman & Varian: How much information http: //www. sims. berkeley. edu/research/projects/how-much-info/ 24 Yecto, 21 zepto, 18 atto, 15 femto, 12 pico, 9 nano, 6 micro, 3 milli Everything ! Recorded All Books Multi. Media All books (words). Movie A Photo A Book Zetta Exa Peta Tera Giga Mega Kilo
 Things Have Changed 1956 • IBM 305 RAMAC • 10 MB disk • ~1 M$ (y 2004 $)
 The Next 50 years will see MORE CHANGE ops/s/$ Had Three Growth Curves 1890 -1990 1890 -1945 Mechanical Relay 7 -year doubling 1945 -1985 Tube, transistor, . . 2. 3 year doubling 1985 -2004 Microprocessor 1. 0 year doubling Combination of Hans Moravac + Larry Roberts + Gordon Bell Word. Size*ops/s/sysprice
 Constant Cost or Constant Function? • 100 x improvement per decade • Same function 100 x cheaper • 100 x more function for same price Mainframe SMP Lo Constellation Constant Price M ini we r Cluster Pr SMP ice Constellation W or ks tat –N ew ion Ca te g Graphics/storage or y PD A Camera/browser
 Growth Comes From NEW Apps • The 10 M$ computer of 1980 costs 1 k$ today • If we were still doing the same things, IT would be a 0 B$/y industry • NEW things absorb the new capacity
 The Surprise-Free Future in 20 years. • 10, 000 x more power for same price – Personal supercomputer – Personal petabyte stores • Same function for 10, 000 x less cost. – Smart dust --the penny PC? – The 10 peta-op computer (for 1, 000$).
 10, 000 x would change things • Human computer interface – Decent computer vision – Decent computer speech recognition – Decent computer speech synthesis • Vast information stores • Ability to search and abstract the stores.
 How Good is HCI Today? • Surprisingly good. – Demo of making faces http: //research. microsoft. com/research/pubs/view. aspx? pubid=290 – Demo of speech synthesis • Daisy, Hal • Synthetic voice – Speech recognition is improving fast, – Vision getting better – Pen computing finally a reality. – Displays improving fast (compared to last 30 years)
 Outline Historical trends imply that in 20 years: 1. we can store everything in cyberspace. The personal petabyte. 2. computers will have natural interfaces speech recognition/synthesis vision, object recognition beyond OCR Implications We are here 1. The information avalanche will only get worse. 2. The user interface will change: less typing, more writing, talking, gesturing, more seeing and hearing 3. Organizing, summarizing, prioritizing information is a key technology. Yotta Zetta Exa Peta Tera Giga Mega Kilo
 How much information is there? Yotta • Almost everything is recorded digitally. • Most bytes are never seen by humans. • Data summarization, trend detection anomaly detection are key technologies See Mike Lesk: How much information is there: http: //www. lesk. com/mlesk/ksg 97/ksg. html See Lyman & Varian: How much information http: //www. sims. berkeley. edu/research/projects/how-much-info/ Everything ! Recorded All Books Multi. Media All books (words). Movie A Photo A Book Zetta Exa Peta Tera Giga Mega Kilo
 Low rent min $/byte Shrinks time now or later Shrinks space here or there Automate processing knowbots Immediate OR Time Delayed And >90% in Cyberspace Because: Point-to-Point OR Broadcast Locate Process Analyze Summarize
 My. Life. Bits The guinea pig • Gordon Bell is digitizing his life • Has now scanned virtually all: – – – – • • Books written (and read when possible) Personal documents (correspondence, memos, email, bills, legal, 0…) Photos Posters, paintings, photo of things (artifacts, …medals, plaques) Home movies and videos CD collection And, of course, all PC files Recording: phone, radio, TV, web pages… conversations Paperless throughout 2002. 12” scanned, 12’ discarded. Only 30 GB Excluding videos Video is 2+ TB and growing fast
 Capture and encoding
 I mean everything
 25 Kday life ~ Personal Petabyte 1 PB Will anyone look at web pages in 2020? Probably new modalities & media will dominate then.
 Challenges • • Capture: Get the bits in Organize: Index them Manage: No worries about loss or space Curate/ Annotate: atutomate where possible Privacy: Keep safe from theft. Summarize: Give thumbnail summaries Interface: how ask/anticipate questions Present: show it in understandable ways.
 Memex As We May Think, Vannevar Bush, 1945 “A memex is a device in which an individual stores all his books, records, and communications, and which is mechanized so that it may be consulted with exceeding speed and flexibility” “yet if the user inserted 5000 pages of material a day it would take him hundreds of years to fill the repository, so that he can be profligate and enter material freely”
 Too much storage? Try to fill a terabyte in a year Items/TB Items/day 300 KB JPEG 3 M 9, 800 1 MB Doc 1 M 2, 900 1 hour 256 kb/s MP 3 audio 1 hour 1. 5 Mbp/s MPEG video 9 K 26 290 0. 8 Petabyte volume has to be some form of video.
 How Will We Find Anything? • Need Queries, Indexing, Pivoting, Scalability, Backup, Replication, Online update, Set-oriented access • If you don’t use a DBMS, you will implement one! • Simple logical structure: – Blob and link is all that is inherent – Additional properties (facets == extra tables) and methods on those tables (encapsulation) • More than a file system • Unifies data and meta-data SQL ++ DBMS
 Photos
 Searching: the most useful app? • Challenge: What questions for useful results? • Many ways to present answers •
 Detail view
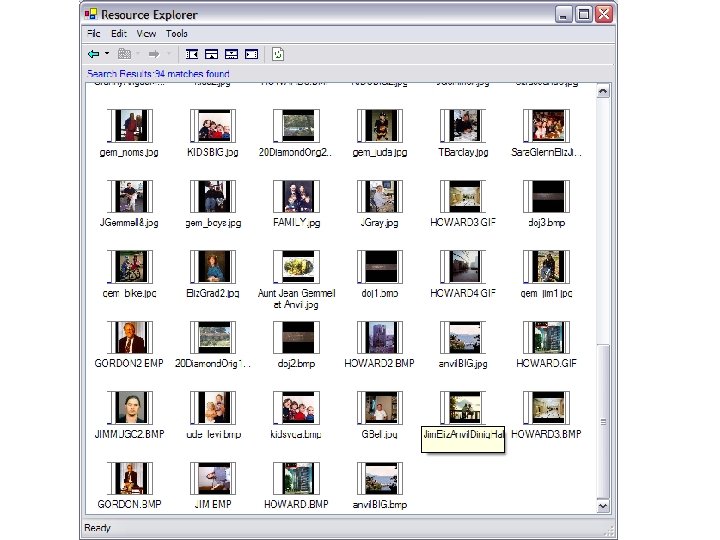
, annotations, descendant & preview panes turned on") Resource explorer Ancestor (collections), annotations, descendant & preview panes turned on
Resource explorer Ancestor (collections), annotations, descendant & preview panes turned on
 Synchronized timelines with histogram guide
 Value of media depends on annotations • “Its just bits until it is annotated”
 System annotations provide base level of value • Date 7/7/2000
 Tracking usage – even better • Date 7/7/2000. Opened 30 times, emailed to 10 people (its valued by the user!)
 Get the user to say a little something is a big jump • Date 7/7/2000. Opened 30 times, emailed to 10 people. “BARC dim sum intern farewell Lunch”
 Getting the user to tell a story is the ultimate in media value • • A story is a “layout” in time and space Most valuable content (by selection, and by being well annotated) Stories must include links to any media they use (for future navigation/search – “transclusion”). Cf: Movie. Maker; Creative Memories Photo. Albums Dapeng was an intern at BARC for the summer of 2000 We took him to lunch at our favorite Dim Sum place to say farewell At table L-R: Dapeng, Gordon, Tom, Jim, Don, Vicky, Patrick, Jim
 Value of media depends on annotations “Its just bits until it is annotated” • Auto-annotate whenever possible e. g. GPS cameras • Make manual annotation as easy as possible. XP photo capture, voice, photos with voice, etc • Support gang annotation • Make stories easy Dapeng was an intern at BARC for the summer of 2000 We took him to lunch at our favorite Dim Sum place to say farewell At table L-R: Dapeng, Gordon, Tom, Dapeng, Jim, Don, Vicky, Patrick, Jim
 80% of data is personal / individual. But, what about the other 20%? • Business – Wall Mart online: 1 PB and growing…. – Paradox: most “transaction” systems < 1 PB. – Have to go to image/data monitoring for big data • Government – Government is the biggest business. • Science – LOTS of data.
 Instruments: CERN – LHC Peta Bytes per Year Looking for the Higgs Particle • Sensors: 1000 GB/s (1 TB/s ~ 30 EB/y) • Events 75 GB/s • Filtered 5 GB/s • Reduced 0. 1 GB/s ~ 2 PB/y • Data pyramid: 100 GB : 1 TB : 100 TB : 1 PB : 10 PB CERN Tier 0
 Information Avalanche • Both – better observational instruments and – Better simulations are producing a data avalanche • Examples Image courtesy of C. Meneveau & A. Szalay @ JHU – Turbulence: 100 TB simulation then mine the Information – Ba. Bar: Grows 1 TB/day 2/3 simulation Information 1/3 observational Information – CERN: LHC will generate 1 GB/s 10 PB/y – VLBA (NRAO) generates 1 GB/s today – NCBI: “only ½ TB” but doubling each year, very rich dataset. – Pixar: 100 TB/Movie
 Q: Where will the Data Come From? A: Sensor Applications • Earth Observation – 15 PB by 2007 • Medical Images & Information + Health Monitoring – Potential 1 GB/patient/y 1 EB/y • Video Monitoring – ~1 E 8 video cameras @ 1 E 5 MBps 10 TB/s 100 EB/y filtered? ? ? • Airplane Engines – 1 GB sensor data/flight, – 100, 000 engine hours/day – 30 PB/y • Smart Dust: ? ? EB/y http: //robotics. eecs. berkeley. edu/~pister/Smart. Dust/ http: //www-bsac. eecs. berkeley. edu/~shollar/macro_motes/macromotes. html
 The Big Picture Experiments & Instruments fac Other Archives facts Literature ts facts ts Simulations fac ? questions answers The Big Problems • • • Data ingest Managing a petabyte Common schema How to organize it? How to reorganize it How to coexist with others • Query and Vis tools • Support/training • Performance – Execute queries in a minute – Batch query scheduling
 are not adequate – – You") FTP - GREP • Download (FTP and GREP) are not adequate – – You can GREP 1 MB in a second You can GREP 1 GB in a minute You can GREP 1 TB in 2 days You can GREP 1 PB in 3 years. • Oh!, and 1 PB ~3, 000 disks • At some point we need indices to limit search parallel data search and analysis • This is where databases can help • Next generation technique: Data Exploration – Bring the analysis to the data!
FTP - GREP • Download (FTP and GREP) are not adequate – – You can GREP 1 MB in a second You can GREP 1 GB in a minute You can GREP 1 TB in 2 days You can GREP 1 PB in 3 years. • Oh!, and 1 PB ~3, 000 disks • At some point we need indices to limit search parallel data search and analysis • This is where databases can help • Next generation technique: Data Exploration – Bring the analysis to the data!
 The Speed Problem • Many users want to search the whole DB ad hoc queries, often combinatorial • Want ~ 1 minute response • Brute force (parallel search): – 1 disk = 50 MBps => ~1 M disks/PB ~ 300 M$/PB • Indices (limit search, do column store) – 1, 000 x less equipment: 1 M$/PB • Pre-compute answer – No one knows how do it for all questions.
 Next-Generation Data Analysis • Looking for – Needles in haystacks – the Higgs particle – Haystacks: Dark matter, Dark energy • Needles are easier than haystacks • Global statistics have poor scaling – Correlation functions are N 2, likelihood techniques N 3 • As data and computers grow at same rate, we can only keep up with N log. N • A way out? – Relax notion of optimal (data is fuzzy, answers are approximate) – Don’t assume infinite computational resources or memory • Combination of statistics & computer science
 Analysis and Databases • Much statistical analysis deals with – – – – – Creating uniform samples – data filtering Assembling relevant subsets Estimating completeness censoring bad data Counting and building histograms Generating Monte-Carlo subsets Likelihood calculations Hypothesis testing • Traditionally these are performed on files • Most of these tasks are much better done inside a database • Move Mohamed to the mountain, not the mountain to Mohamed.
 Outline Historical trends imply that in 20 years: 1. we can store everything in cyberspace. The personal petabyte. 2. computers will have natural interfaces speech recognition/synthesis vision, object recognition beyond OCR Implications We are here 1. The information avalanche will only get worse. 2. The user interface will change: less typing, more writing, talking, gesturing, more seeing and hearing 3. Organizing, summarizing, prioritizing information is a key technology. Yotta Zetta Exa Peta Tera Giga Mega Kilo
 The Evolution of Science • Observational Science – Scientist gathers data by direct observation – Scientist analyzes data • Analytical Science – Scientist builds analytical model – Makes predictions. • Computational Science – Simulate analytical model – Validate model and makes predictions • Data Exploration Science Data captured by instruments Or data generated by simulator – Processed by software – Placed in a database / files – Scientist analyzes database / files
 e-Science • Data captured by instruments Or data generated by simulator • Processed by software • Placed in a files or database • Scientist analyzes files / database • Virtual laboratories – Networks connecting e-Scientists – Strong support from funding agencies • Better use of resources – Primitive today
 e-Science is Data Mining • There are LOTS of data – people cannot examine most of it. – Need computers to do analysis. • Manual or Automatic Exploration – Manual: person suggests hypothesis, computer checks hypothesis – Automatic: Computer suggests hypothesis person evaluates significance • Given an arbitrary parameter space: – – – Data Clusters Points between Data Clusters Isolated Data Groups Holes in Data Clusters Isolated Points Nichol et al. 2001 Slide courtesy of and adapted from Robert Brunner @ Cal. Tech.
 &") Terra. Server/Terra. Service http: //terra. Service. Net/ • US Geological Survey Photo (DOQ) & Topo (DRG) images online. • On Internet since June 1998 • Operated by Microsoft Corporation • Cross Indexed with – Home sales, – Demographics, – Encyclopedia • A web service • 20 TB data source • 10 M web hits/day
Terra. Server/Terra. Service http: //terra. Service. Net/ • US Geological Survey Photo (DOQ) & Topo (DRG) images online. • On Internet since June 1998 • Operated by Microsoft Corporation • Cross Indexed with – Home sales, – Demographics, – Encyclopedia • A web service • 20 TB data source • 10 M web hits/day
 USGS Image Data • Digital Ortho. Quads – 18 TB, 260, 000 files uncompressed – Digitized aerial imagery – 88% coverage conterminous US – 1 meter resolution – < 10 years old • Digital Raster Graphics – 1 TB compressed TIFF, 65, 000 files – Scanned topographic maps – 100% U. S. coverage – 1: 24, 000, 1: 100, 000 and 1: 250, 000 scale maps – Maps vary in age
 User Interface Concept Display Imagery: 316 m 200 x 200 pixel images 7 level image pyramid Resolution 1 meter/pixel to 64 meter/pixel Concept: User navigates an ‘almost seamless’ image of earth Navigation Tools: 1. 5 m place names “Click-on” Coverage map Longitude and Latitude search U. S. Address Search External Geo-Spatial Links to: USGS On-line Stream Gauges Home Advisor Demographics Home Advisor Real Estate Encarta Articles Steam flow gauges Click on image to zoom in Buttons to pan NW, N, NE, W, E, SW, S, SE Links to switch between Topo, Imagery, and Relief data Links to Print, Download and view meta-data information
 Terra Service New Things • A popular web service – Exactly the map you want. • Dynamic Map Re-projection – UTM to Geographic projection – Dynamic texture mapping? • New Data – 1 foot resolution natural color imagery – Census Tiger data • Lights Out Management – MOM – Auto-backup / restore on drive failure
 “Urban Area” Data Microsoft Campus at 4 meter resolution “Redundant Bunch 1” Ball field at. 25 meter resolution
 Terra. Server Becomes a Web Service Terra. Server. net -> Terra. Service. Net • Web server is for people. • Web Service is for programs – The end of screen scraping – No faking a URL: pass real parameters. – No parsing the answer: data formatted into your address space. • Hundreds of users but a specific example: – US Department of Agriculture
 Terra. Server Web Services Terra-Tile-Service • Get image meta-data • Query TS Gazetteer • Retrieve TS Image. Tiles • Projection conversions Landmark-Service • Geo-coded data of wellknown objects (points), e. g. Schools, Golf Courses, Hospitals, etc. • Polygons of well-known objects (shapes), e. g. Zip Codes, Cities, etc Sample Apps • Web Map Client – Open. GIS “like” – Landmarks layered on Terra. Server imagery • Fat Map Client – Visual Basic / C# Windows Form – Access Web Services for all data http: //terraservice. net
 Web Services • Web SERVER: – Given a url + parameters – Returns a web page (often dynamic) Your h t program tp • Web SERVICE: – Given a XML document (soap msg) – Returns an XML document – Tools make this look like an RPC. • F(x, y, z) returns (u, v, w) – Distributed objects for the web. – + naming, discovery, security, . . • Internet-scale distributed computing b We e pag Your s o program ap Data In your address space Web Server t jec l ob m in x Web Service
 Terra. Server Hardware • Storage Bricks – “White-box commodity servers” – 4 tb raw / 2 TB Raid 1 SATA storage – Dual Hyper-threaded Xeon 2. 4 ghz, 4 GB RAM • Partitioned Databases (PACS – partitioned array) – 3 Storage Bricks = 1 Terra. Server data – Data partitioned across 20 databases – More data & partitions coming • Low Cost Availability – 4 copies of the data • RAID 1 SATA Mirroring • 2 redundant “Bunches” – Spare brick to repair failed brick 2 N+1 design – Web Application “bunch aware” • Load balances between redundant databases • Fails over to surviving database on failure • ~100 K$ capital expense. KVM / IP
 Virtual Observatory http: //www. astro. caltech. edu/nvoconf/ http: //www. voforum. org/ • Premise: Most data is (or could be online) • So, the Internet is the world’s best telescope: – – It has data on every part of the sky In every measured spectral band: optical, x-ray, radio. . As deep as the best instruments (2 years ago). It is up when you are up. The “seeing” is always great (no working at night, no clouds no moons no. . ). – It’s a smart telescope: links objects and data to literature on them.
 Why Astronomy Data? IRAS 25 m • It has no commercial value –No privacy concerns –Can freely share results with others –Great for experimenting with algorithms 2 MASS 2 m • It is real and well documented –High-dimensional data (with confidence intervals) –Spatial data –Temporal data • Many different instruments from many different places and many different times • Federation is a goal • The questions are interesting DSS Optica IRAS 100 m WENSS 92 cm NVSS 20 cm –How did the universe form? • There is a lot of it (petabytes) ROSAT ~ke. V GB 6 cm
 Time and Spectral Dimensions The Multiwavelength Crab Nebulae Crab star 1053 AD X-ray, optical, infrared, and radio views of the nearby Crab Nebula, which is now in a state of chaotic expansion after a supernova explosion first sighted in 1054 A. D. by Chinese Astronomers. Slide courtesy of Robert Brunner @ Cal. Tech.
 Sky. Server. SDSS. org • A modern archive – Raw Pixel data lives in file servers – Catalog data (derived objects) lives in Database – Online query to any and all • Also used for education – 150 hours of online Astronomy – Implicitly teaches data analysis • Interesting things – – – Spatial data search Client query interface via Java Applet Query interface via Emacs Popular -- 1% of Terraserver Cloned by other surveys (a template design) Web services are core of it.
 Demo of Sky. Server • • • Shows standard web server Pixel/image data Point and click Explore one object Explore sets of objects (data mining)
 Data Federations of Web Services • Massive datasets live near their owners: – – Near the instrument’s software pipeline Near the applications Near data knowledge and curation Super Computer centers become Super Data Centers • Each Archive publishes a web service – Schema: documents the data – Methods on objects (queries) • Scientists get “personalized” extracts • Uniform access to multiple Archives Federation – A common global schema
 Sky. Query A Prototype WWT • Started with SDSS data and schema • Imported 12 other datasets into that spine schema. (a day per dataset plus load time) • Unified them with a portal • Implicit spatial join among the datasets. • All built on Web Services – Pure XML – Pure SOAP – Used. NET toolkit
 Federation: Sky. Query. Net • Combine 4 archives initially • Just added 10 more • Send query to portal, portal joins data from archives. • Problem: want to do multi-step data analysis (not just single query). • Solution: Allow personal databases on portal • Problem: some queries are monsters • Solution: “batch schedule” on portal server, Deposits answer in personal database.
 Sky. Query Structure • Each Sky. Node publishes – Schema Web Service – Database Web Service • Portal is – Plans Query (2 phase) – Integrates answers – Is itself a web service Image Cutout SDSS Sky. Query Portal FIRST 2 MASS INT
 Sky. Query: http: //skyquery. net/ • Distributed Query tool using a set of web services • Four astronomy archives from Pasadena, Chicago, Baltimore, Cambridge (England). • Feasibility study, built in 6 weeks – Tanu Malik (JHU CS grad student) – Tamas Budavari (JHU astro postdoc) – With help from Szalay, Thakar, Gray • Implemented in C# and. NET • Allows queries like: SELECT o. obj. Id, o. r, o. type, t. obj. Id FROM SDSS: Photo. Primary o, TWOMASS: Photo. Primary t WHERE XMATCH(o, t)<3. 5 AND AREA(181. 3, -0. 76, 6. 5) AND o. type=3 and (o. I - t. m_j)>2
 Sky. Node Basic Web Services • Metadata information about resources – Waveband – Sky coverage – Translation of names to universal dictionary (UCD) • Simple search patterns on the resources – Cone Search – Image mosaic – Unit conversions • Simple filtering, counting, histogramming • On-the-fly recalibrations
 Portals: Higher Level Services • Built on Atomic Services • Perform more complex tasks • Examples – – – Automated resource discovery Cross-identifications Photometric redshifts Outlier detections Visualization facilities • Goal: – Build custom portals in days from existing building blocks (like today in IRAF or IDL)
 Open Sky. Query • Sky. Query being adopted by Astro. Grid as reference implementation for OGSA-DAI (Open Grid Services Architecture, Data Access and Integration). • Sky. Node basic archive object http: //www. ivoa. net/twiki/bin/view/IVOA/Sky. Node • Sky. Query Language (Vo. QL) is evolving. http: //www. ivoa. net/twiki/bin/view/IVOA/Ivoa. VOQL
 The Registry • UDDI seemed inappropriate – Complex – Irrelevant questions – Relevant questions missing • Evolved Dublin Core – Represent Datasets, Services, Portals – Needs to be machine readable – Federation (DNS model) – Push & Pull: register then harvest • http: //www. ivoa. net/twiki/bin/view/IVOA/Ivoa. Res. Reg
 Unified Definitions • Universal Content Definitions http: //vizier. u-strasbg. fr/doc/UCD. htx – Collated all table heads from all the literature – 100, 000 terms reduced to ~1, 500 – Rough consensus that this is the right thing. – Refinement in progress as people use UCDs • Defines – Units: • gram, radian, second, janski. . . – Semantic Concepts / Metrics • Std error, Chi 2 fit, magnitude, flux @ passband, velocity,
 Classes and Methods Your program soap • First Class: VO table http: //www. us-vo. org/VOTable/ – Represents an answer set in XML Data In your address space • Defined by an XML Schema (XSD) • Metadata (in terms of UCDs) • Data representation (numbers and text) – First method • Cone Search: Get objects in this cone http: //voservices. org/cone/ ect obj ml in x Web Service
 Provenance • Most data will be derived. • To do science, need to trace derived data back to source. • So programs and inputs must be registered. • Must be able to re-run them. • Example: Space Telescope Calibrated Data – Run on demand – Can specify software version (to get old answers) • Scientific Data Provenance and Curation are largely unsolved problems (some ideas but no science).
 Other Classes Your program soap • Space-Time class – http: //hea-www. harvard. edu/~arots/nvometa/STCdoc. pdf • Image Class (returns pixels) – Sdss. Cutout – Simple Image Access Protocol Data In your address space ect obj ml in x http: //bill. cacr. caltech. edu/cfdocs/usvo-pubs/files/ACF 8 DE. pdf – Hyper. Atlas http: //bill. cacr. caltech. edu/usvo-pubs/files/hyperatlas. pdf • Spectral – Simple Spectral Access Protocol – 500 K spectra available at http: //voservices. net/wave • Query Services – ADQL and Sky. Node http: //skyservice. pha. jhu. edu/develop/vo/adql/ – And http: //Sky. Query. Net • Registry: – see below Web Service
 Object Model Your h • General acceptance of XML t program tp • Recent acceptance of XML Schema (XSD over DTD) Web Server b We e pag • Wait-and-See about SOAP/WSDL/… – “ Web Services are just Corba with angle brackets. ” – FTP is good enough for me. • Personal opinion: – Web Services are much more than “Corba + <>” – Huge focus on interop – Huge focus on integrated tools Your s o program ap Data • But the community says “Show me!” In your address – Many technologists convinced, space but not yet the astronomers t jec l ob m in x Web Service
 Data Sources • Literature online and cross indexed – Simbad, ADS, NED, http: //simbad. u-strasbg. fr/Simbad, http: //adswww. harvard. edu/, http: //nedwww. ipac. caltech. edu/ • Many curated archives online – FIRST, DPOSS, 2 MASS, USNO, IRAS, SDSS, Vize. R, … – Typically files with English meta-data and some programs • Groups, Researchers, Amateurs Publish – Datasets online in various formats – Data publications are ephemeral (may disappear) – Many have unknown provenance • Documentation varies; some good and some none.
 The WWT Components Outline What we learned • Data Sources • Astro is a community of 10, 000 • Homogenous & Cooperative • If you can’t do it for Astro, do not bother with 3 M bio-info. • Agreement – Literature – Archives • Unified Definitions – Units, – Semantics/Concepts/Metrics, Representations, – Provenance • • – Takes time – Takes endless meetings • Big problems are non-technical Object model – Legacy is a big problem. Classes and methods • Plumbing and tools are there Portals But… WWT is a poster child for the – What is the object model? Data Grid. – What do you want to save? – How document provenance?
 My. DB added to Sky. Query • Moves analysis to the data • Users can cooperate (share My. DB) • Still exploring this • Let users add personal DB 1 GB for now. • Use it as a workbook. • Online and batch queries. INT Image Cutout SDSS Sky. Query Portal My. DB FIRST 2 MASS
 The Big Picture Experiments & Instruments fac Other Archives facts Literature ts facts ts Simulations fac ? questions answers The Big Problems • • • Data ingest Managing a petabyte Common schema How to organize it? How to reorganize it How to coexist with others • Query and Vis tools • Support/training • Performance – Execute queries in a minute – Batch query scheduling