TENTATIVE OUTLINE International Economic Organizations Fall 2012 Instructor:



![Literature: Literature: [1] Мировая экономика и международные экономические отношения / Под ред. проф. А.С.Булатова Literature: Literature: [1] Мировая экономика и международные экономические отношения / Под ред. проф. А.С.Булатова](https://present5.com/customparser/3948878_132439531 --- presentation_weo_1.ppt/slide_5.jpg)
presentation_weo_1.ppt
- Количество слайдов: 79
 TENTATIVE OUTLINE International Economic Organizations Fall 2012 Instructor: Irina Karzanova, PhD e-mail: [email protected]
 International economic organizations IMF- World Economic Outlook, http://www.imf.org World Bank Group - World Development Report, http://www.worldbank.org International Finance Corporation, IFC http://www1.ifc.org Multilateral Investment Guarantee Agency http://www.miga.org World Trade Organization, WTO – International Trade Statistics, http://www.wto.org
 International economic organizations International Labour Organization, ILO http://www.ILO.org Food and Agricultural Organization, FAO http://www.fao.org UNCTAD - World Investment Report, http://www.unctad.org UNIDO – UN Industrial Development Organization http://www.unido.org
 International economic organizations World Intellectual Property Organization, WIPO http://www.wipo.org European Bank for Reconstruction and Development – EBRD http://www.ebrd.org Asian Development Bank http://www.adb.org African Developent Bank Group http://www.afdb.org Inter-American Bank Group http://www.iadb.org
![>Literature: Literature: [1] Мировая экономика и международные экономические отношения / Под ред. проф. А.С.Булатова >Literature: Literature: [1] Мировая экономика и международные экономические отношения / Под ред. проф. А.С.Булатова](https://present5.com/customparser/3948878_132439531 --- presentation_weo_1.ppt/slide_5.jpg) Literature: Literature: [1] Мировая экономика и международные экономические отношения / Под ред. проф. А.С.Булатова и Н.Н. Ливенцева, М., Магистр, Инфра-М, 2012 [2] Handouts Additional literature: [3] Герчикова И.Н. Международные экономические организации: регулирование мирохозяйственных связей и предпринимательской деятельности. М., 2000
Literature: Literature: [1] Мировая экономика и международные экономические отношения / Под ред. проф. А.С.Булатова и Н.Н. Ливенцева, М., Магистр, Инфра-М, 2012 [2] Handouts Additional literature: [3] Герчикова И.Н. Международные экономические организации: регулирование мирохозяйственных связей и предпринимательской деятельности. М., 2000
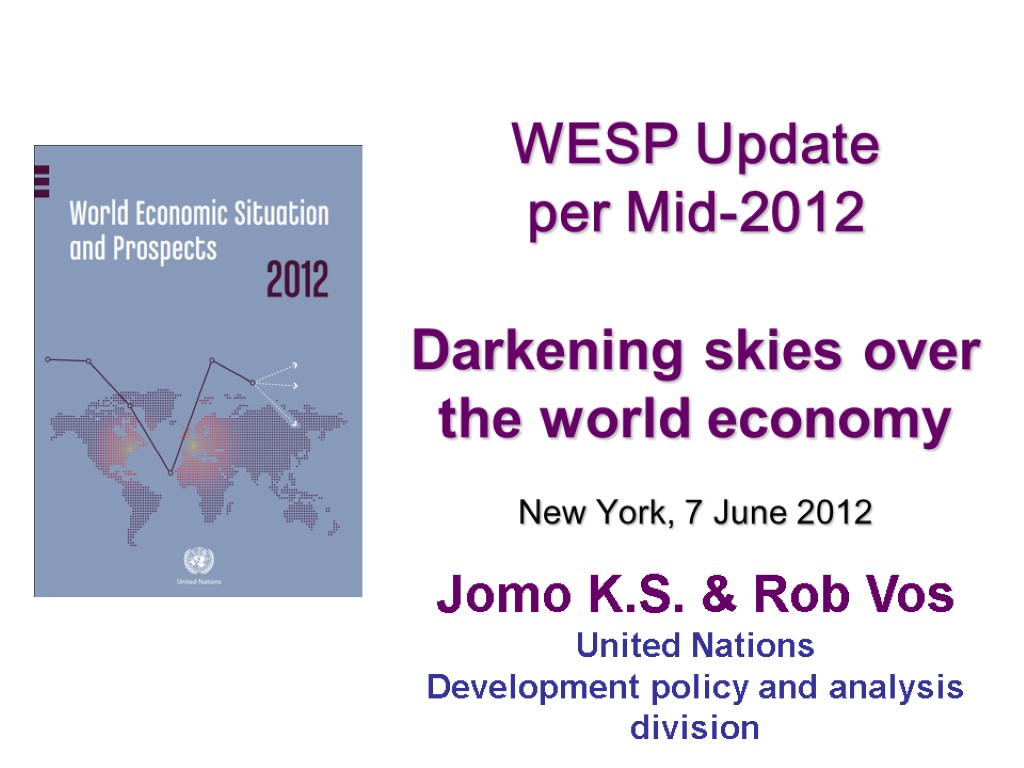
 WESP Update per Mid-2012 Darkening skies over the world economy New York, 7 June 2012 Jomo K.S. & Rob Vos United Nations Development policy and analysis division
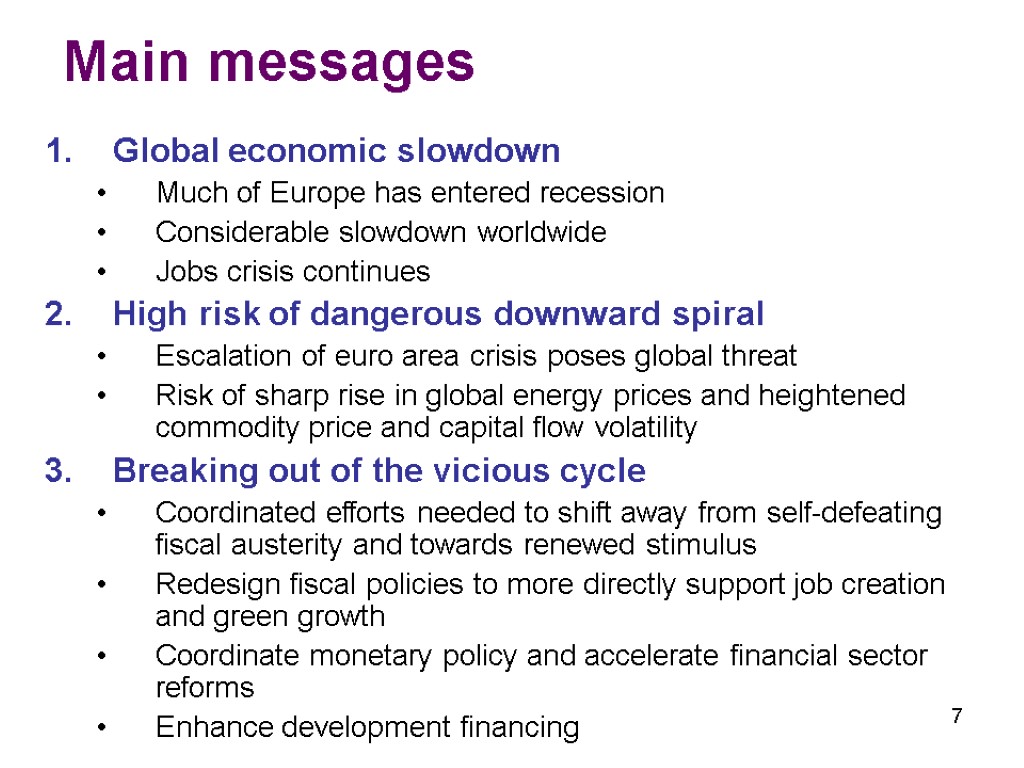
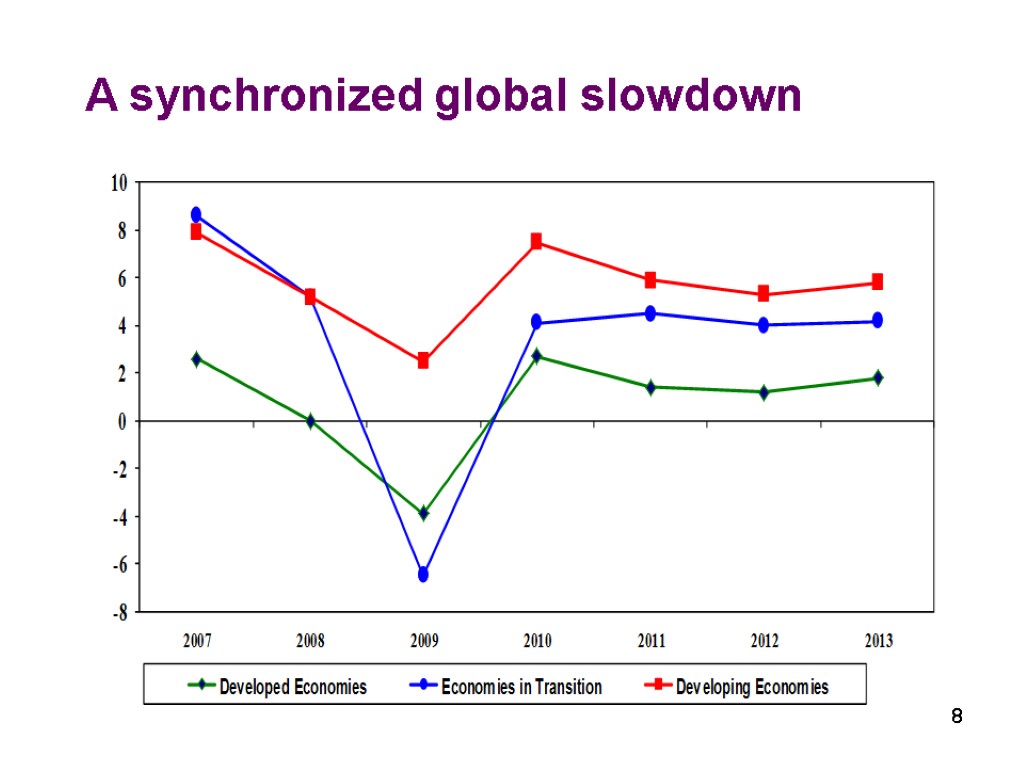
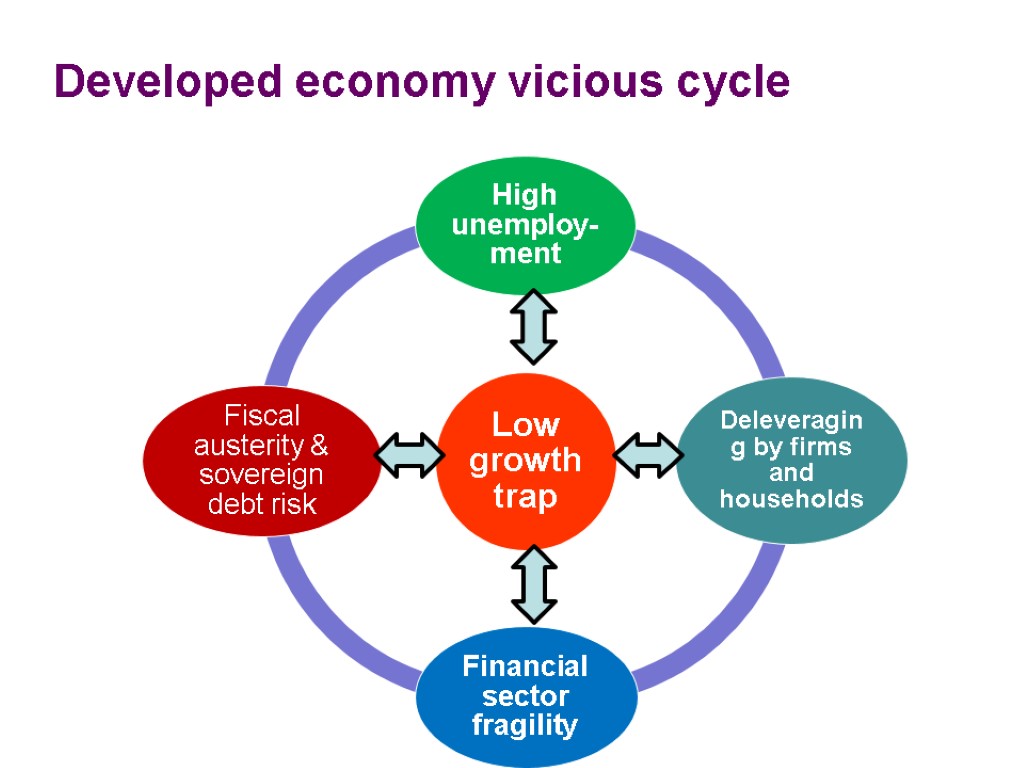
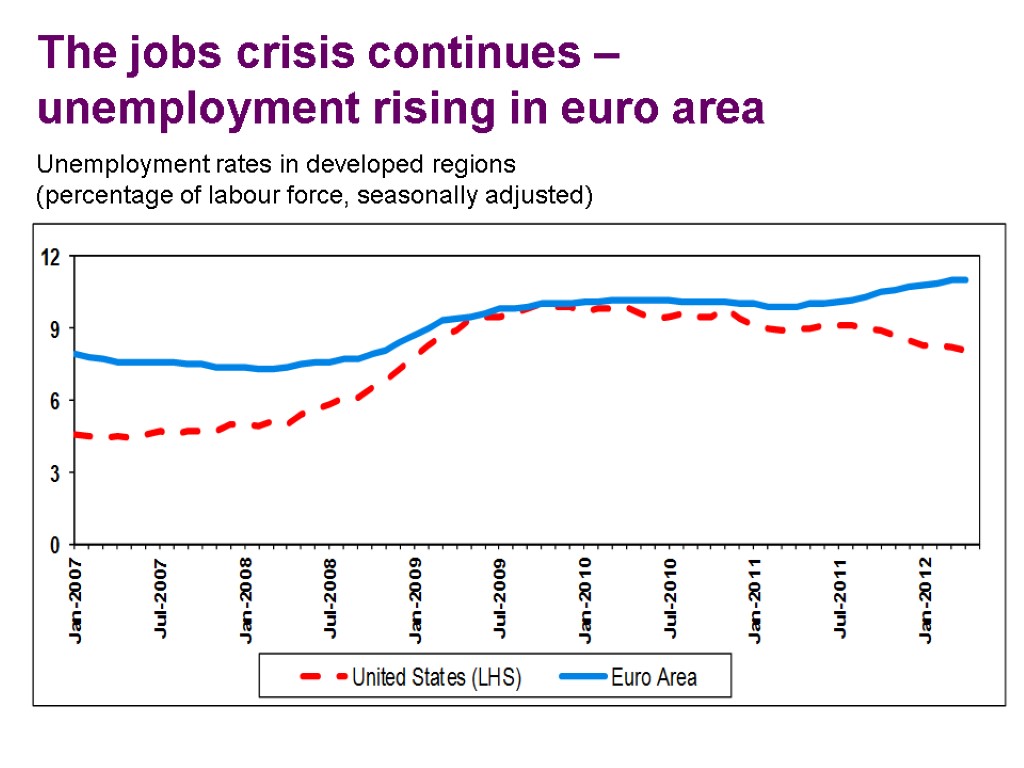
 7 Main messages Global economic slowdown Much of Europe has entered recession Considerable slowdown worldwide Jobs crisis continues High risk of dangerous downward spiral Escalation of euro area crisis poses global threat Risk of sharp rise in global energy prices and heightened commodity price and capital flow volatility Breaking out of the vicious cycle Coordinated efforts needed to shift away from self-defeating fiscal austerity and towards renewed stimulus Redesign fiscal policies to more directly support job creation and green growth Coordinate monetary policy and accelerate financial sector reforms Enhance development financing
 8 A synchronized global slowdown
 Developed economy vicious cycle 9
 The jobs crisis continues – unemployment rising in euro area Unemployment rates in developed regions (percentage of labour force, seasonally adjusted)
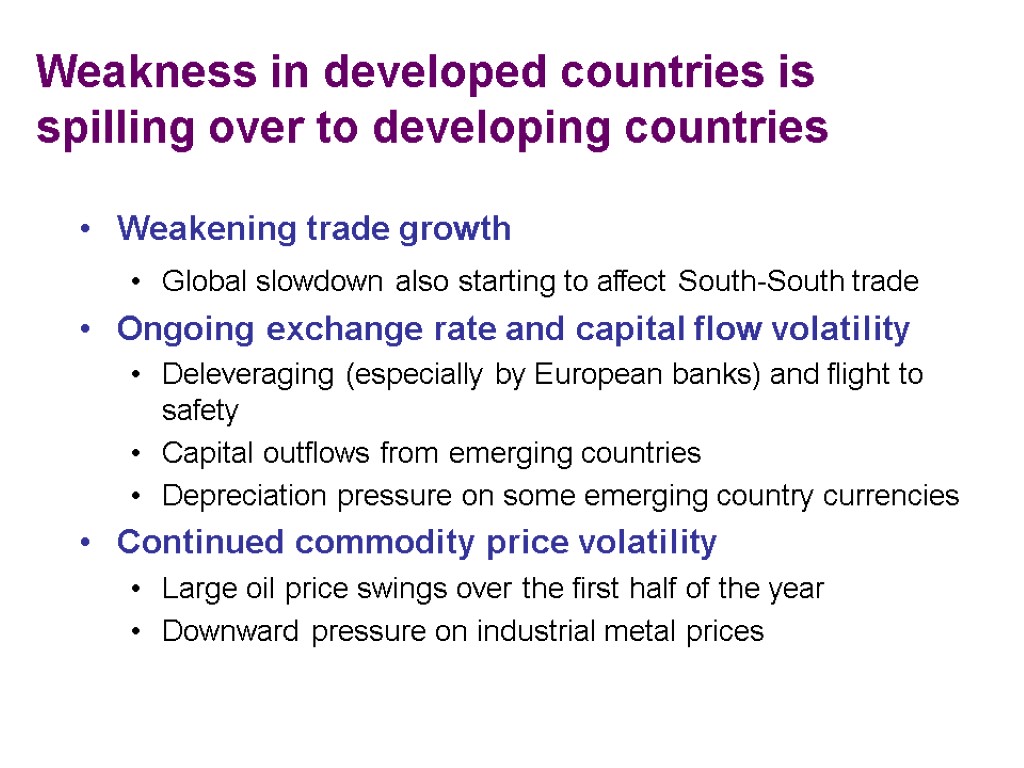
 Weakness in developed countries is spilling over to developing countries Weakening trade growth Global slowdown also starting to affect South-South trade Ongoing exchange rate and capital flow volatility Deleveraging (especially by European banks) and flight to safety Capital outflows from emerging countries Depreciation pressure on some emerging country currencies Continued commodity price volatility Large oil price swings over the first half of the year Downward pressure on industrial metal prices
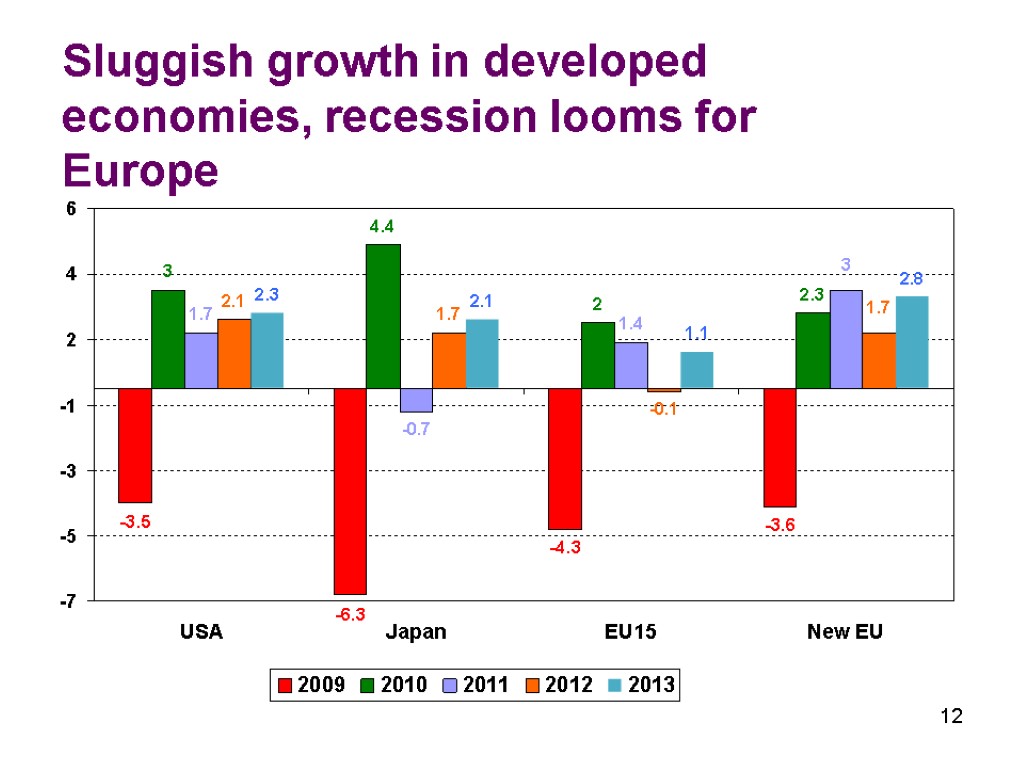
 12 Sluggish growth in developed economies, recession looms for Europe
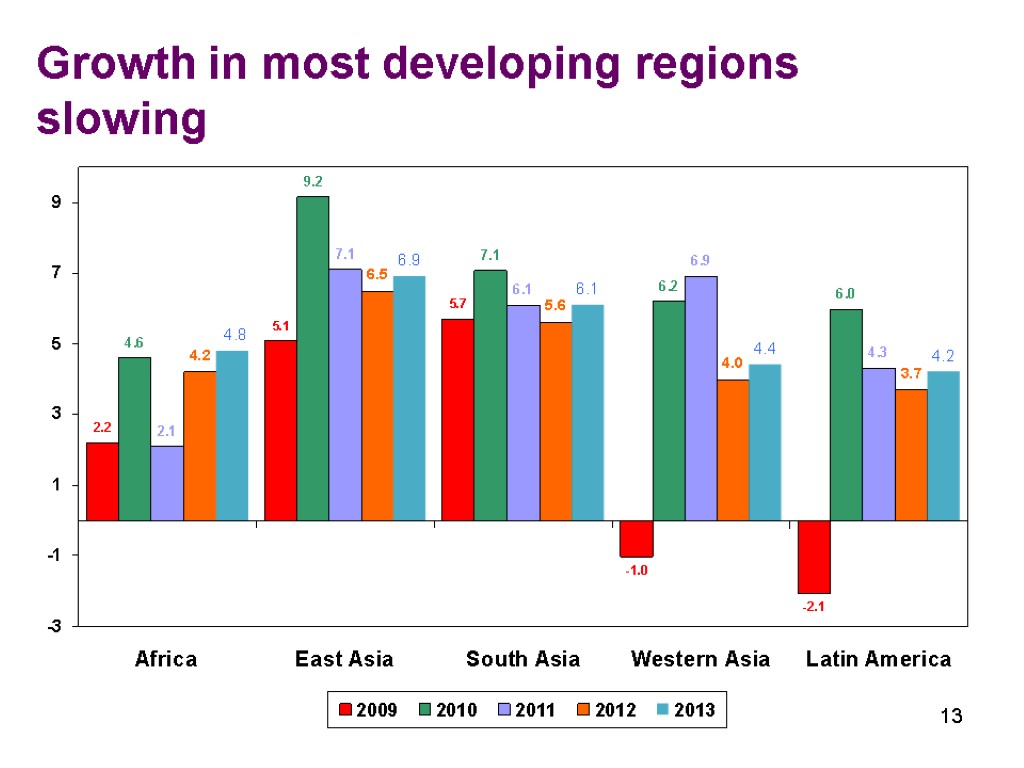
 13 13 Growth in most developing regions slowing
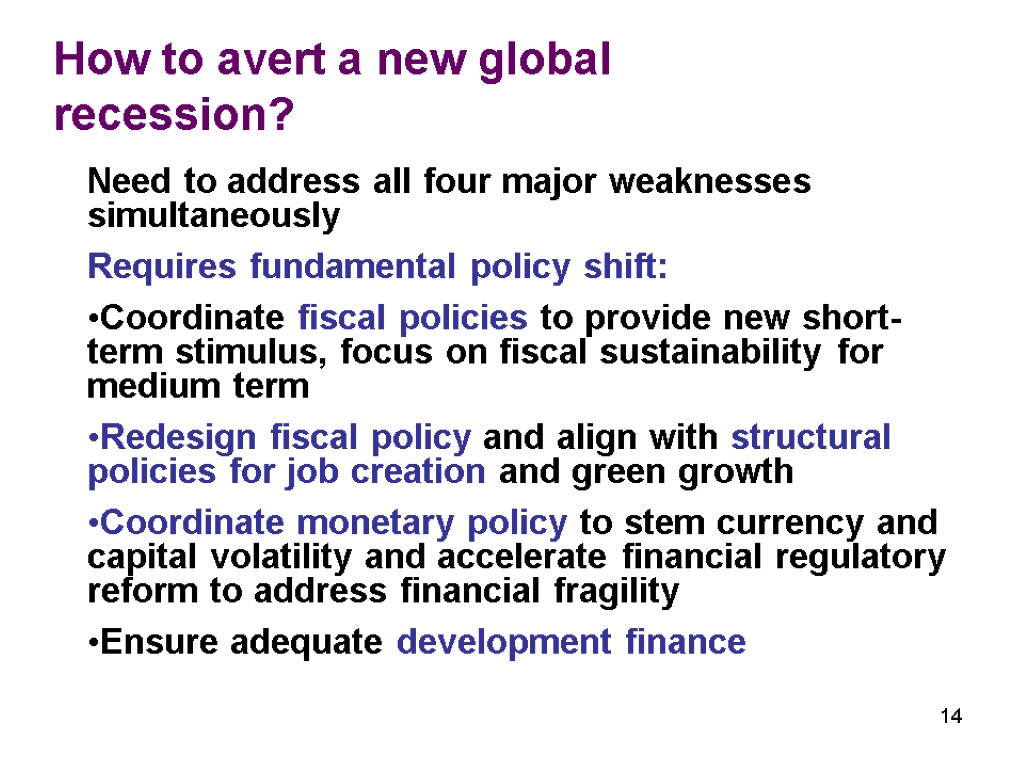
 14 Need to address all four major weaknesses simultaneously Requires fundamental policy shift: Coordinate fiscal policies to provide new short-term stimulus, focus on fiscal sustainability for medium term Redesign fiscal policy and align with structural policies for job creation and green growth Coordinate monetary policy to stem currency and capital volatility and accelerate financial regulatory reform to address financial fragility Ensure adequate development finance How to avert a new global recession?
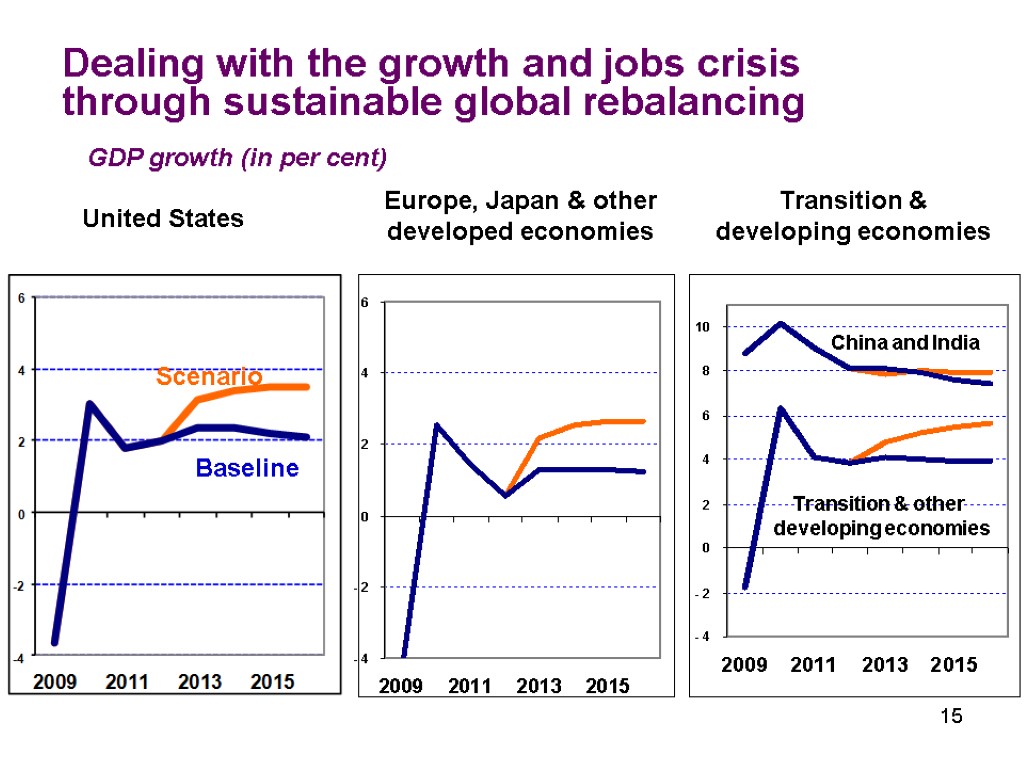
 15 Dealing with the growth and jobs crisis through sustainable global rebalancing United States Europe, Japan & other developed economies Transition & developing economies GDP growth (in per cent) Baseline Scenario China and India Transition & other developing economies
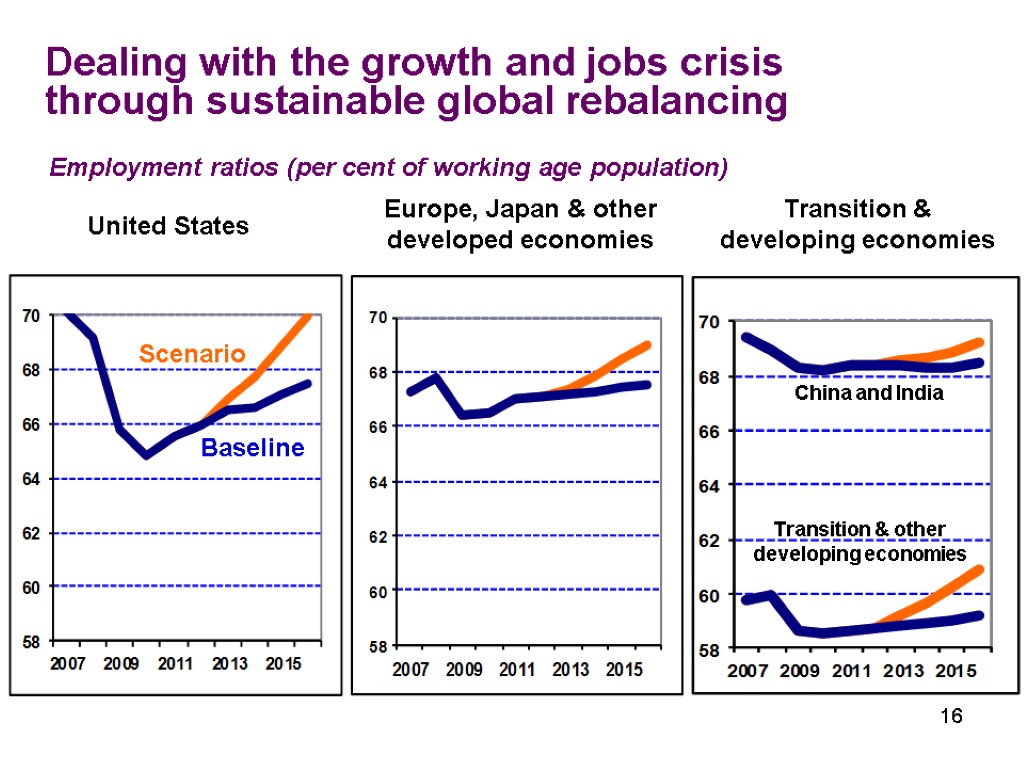
 16 Dealing with the growth and jobs crisis through sustainable global rebalancing United States Europe, Japan & other developed economies Transition & developing economies Employment ratios (per cent of working age population) Baseline Scenario China and India Transition & other developing economies
 Open-Economy Macroeconomics
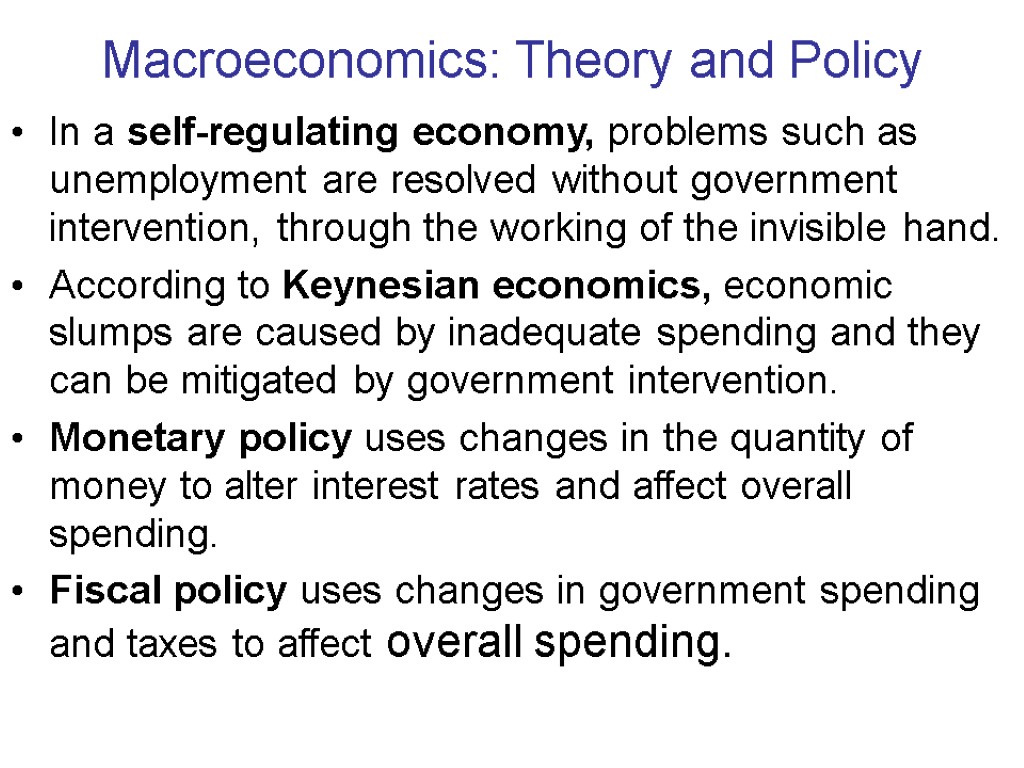
 Macroeconomics: Theory and Policy In a self-regulating economy, problems such as unemployment are resolved without government intervention, through the working of the invisible hand. According to Keynesian economics, economic slumps are caused by inadequate spending and they can be mitigated by government intervention. Monetary policy uses changes in the quantity of money to alter interest rates and affect overall spending. Fiscal policy uses changes in government spending and taxes to affect overall spending.
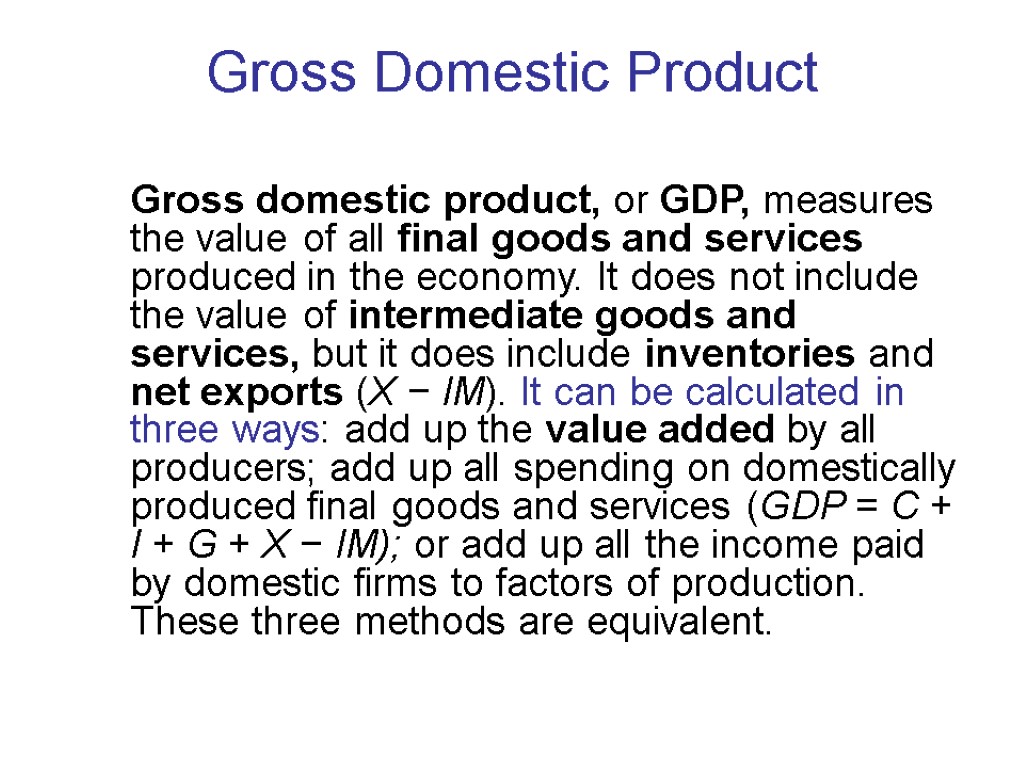
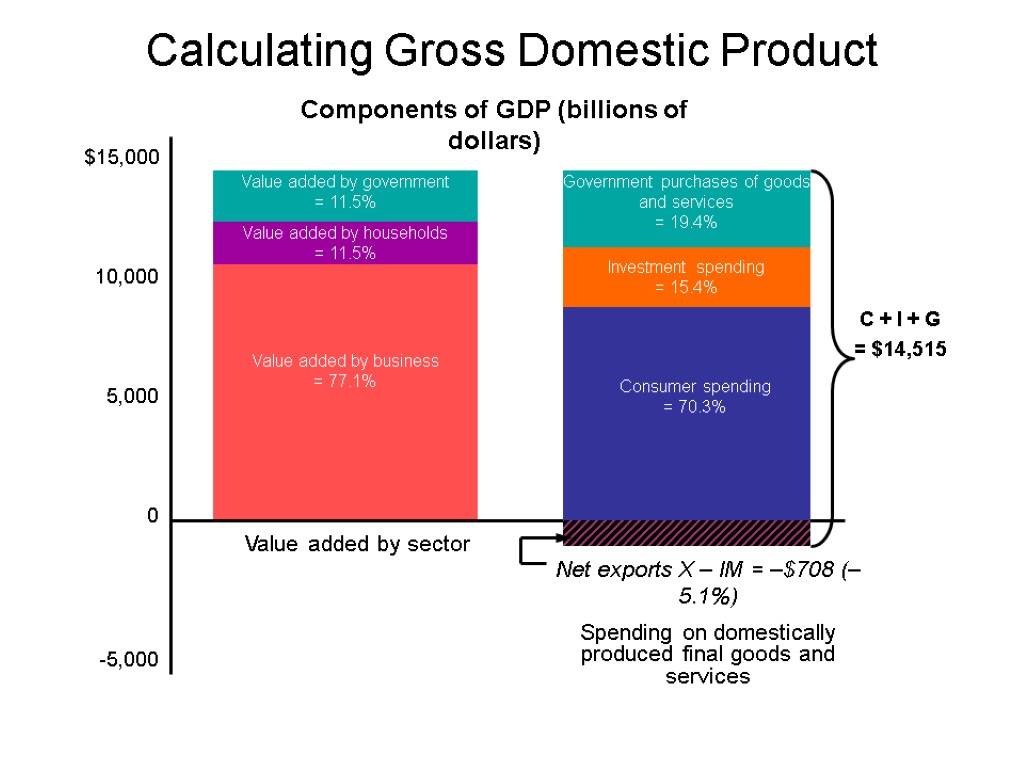
 Gross Domestic Product Gross domestic product, or GDP, measures the value of all final goods and services produced in the economy. It does not include the value of intermediate goods and services, but it does include inventories and net exports (X − IM). It can be calculated in three ways: add up the value added by all producers; add up all spending on domestically produced final goods and services (GDP = C + I + G + X − IM); or add up all the income paid by domestic firms to factors of production. These three methods are equivalent.
 Calculating Gross Domestic Product $15,000 10,000 5,000 0 -5,000 Value added by government = 11.5% Value added by households = 11.5% Value added by business = 77.1% Consumer spending = 70.3% Investment spending = 15.4% Government purchases of goods and services = 19.4% Components of GDP (billions of dollars) C + I + G = $14,515 Net exports X – IM = –$708 (–5.1%) Spending on domestically produced final goods and services Value added by sector
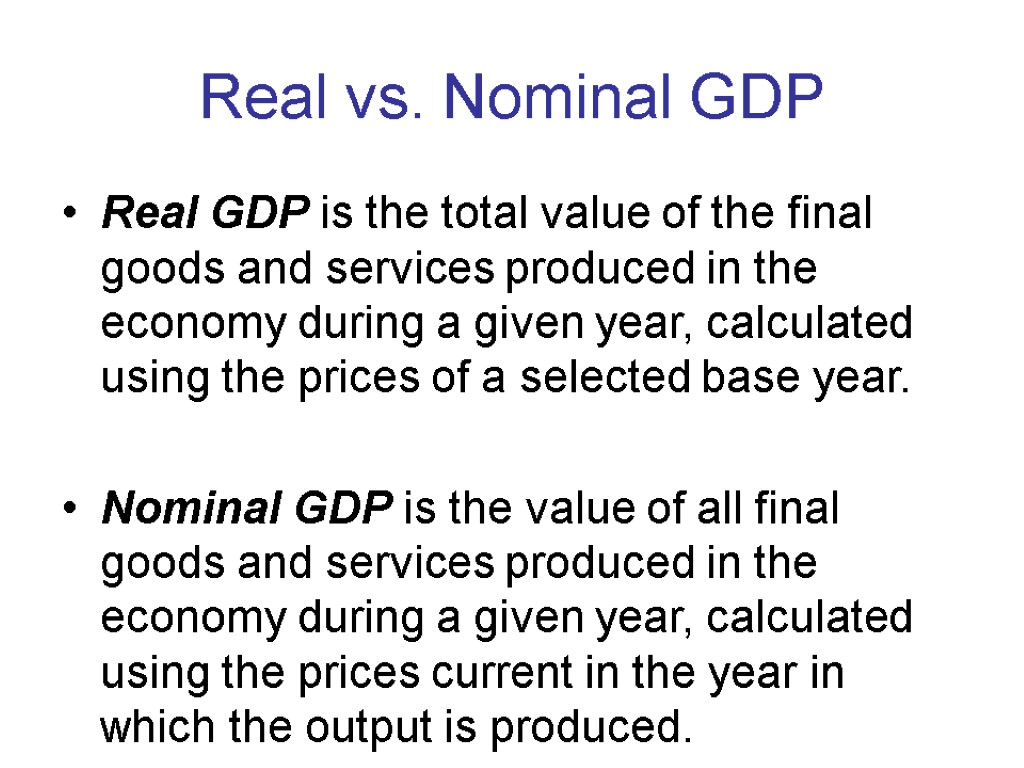
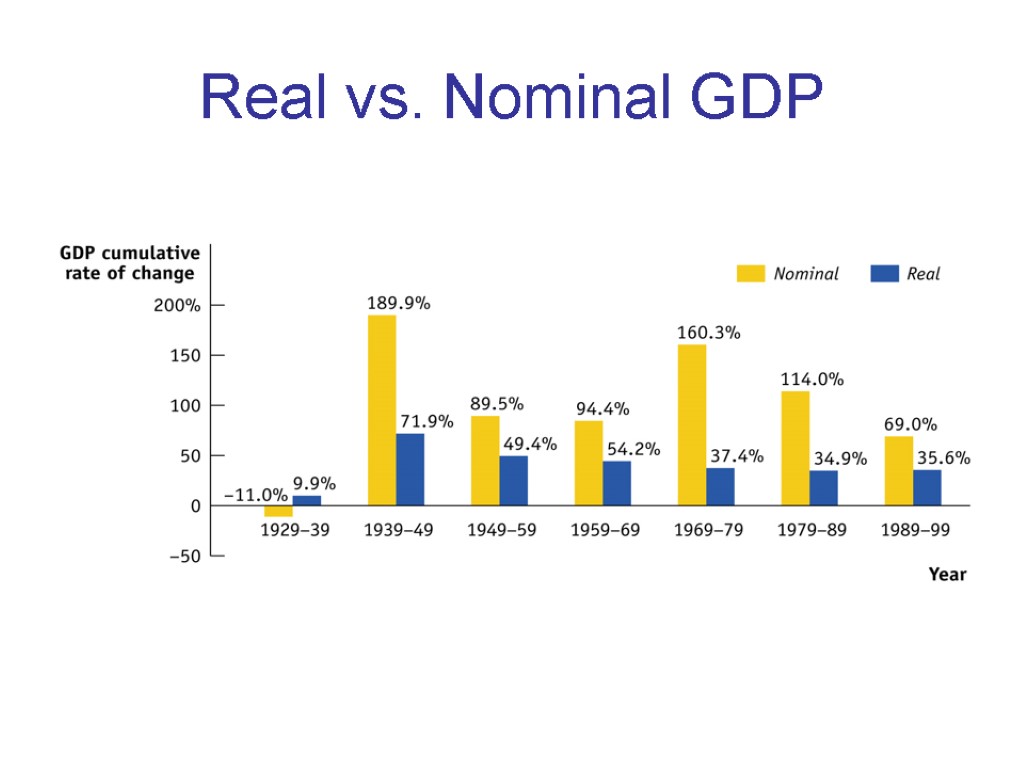
 Real vs. Nominal GDP Real GDP is the total value of the final goods and services produced in the economy during a given year, calculated using the prices of a selected base year. Nominal GDP is the value of all final goods and services produced in the economy during a given year, calculated using the prices current in the year in which the output is produced.
 Real vs. Nominal GDP
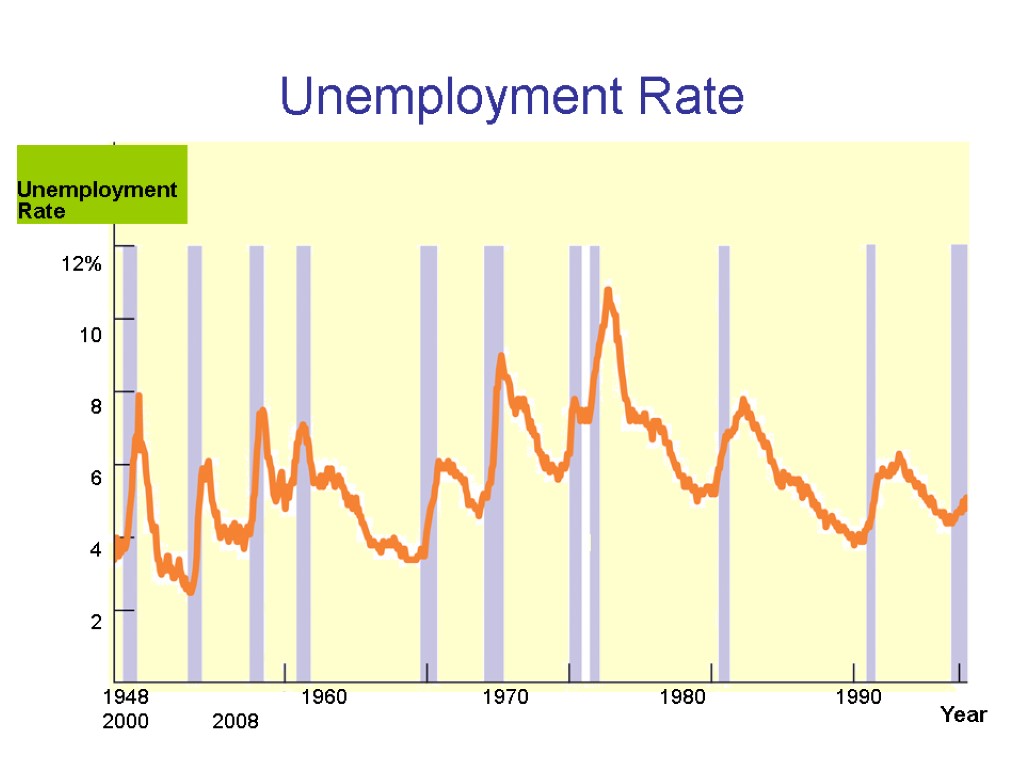
 Unemployment Rate The U.S. Unemployment Rate, 1948-2008 1948 1960 1970 1980 1990 2000 2008 Year 12% 10 8 6 4 2 Unemployment Rate
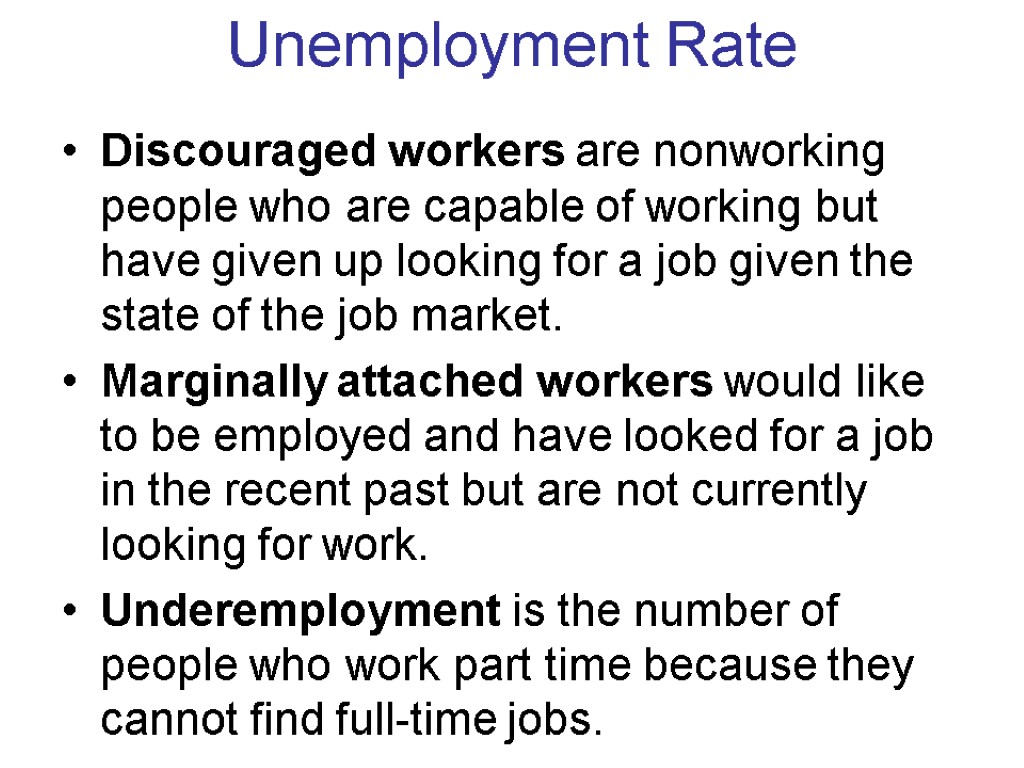
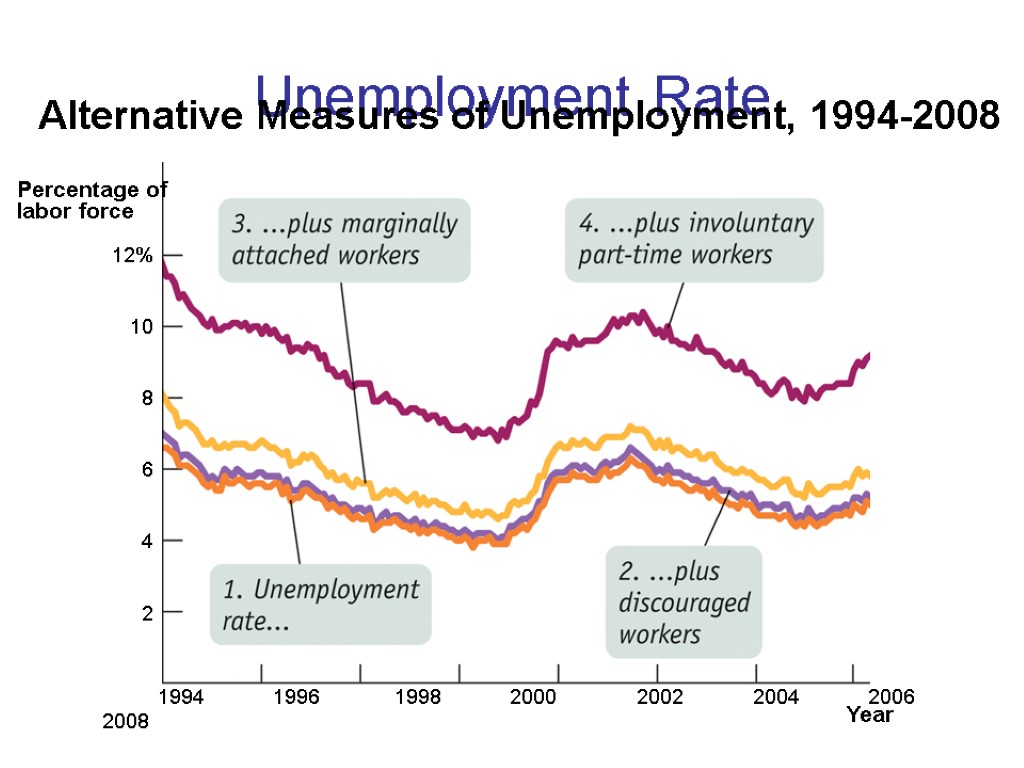
 Unemployment Rate Discouraged workers are nonworking people who are capable of working but have given up looking for a job given the state of the job market. Marginally attached workers would like to be employed and have looked for a job in the recent past but are not currently looking for work. Underemployment is the number of people who work part time because they cannot find full-time jobs.
 Unemployment Rate Alternative Measures of Unemployment, 1994-2008 1994 1996 1998 2000 2002 2004 2006 2008 Year 12% 10 8 6 4 2 Percentage of labor force
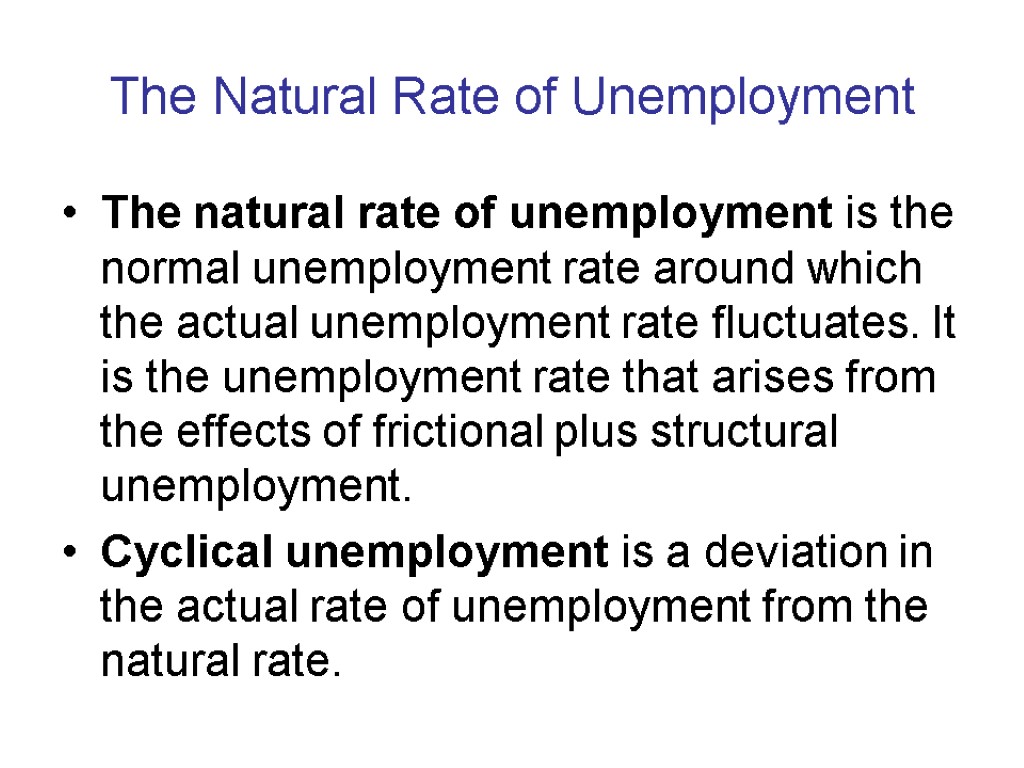
 The Natural Rate of Unemployment The natural rate of unemployment is the normal unemployment rate around which the actual unemployment rate fluctuates. It is the unemployment rate that arises from the effects of frictional plus structural unemployment. Cyclical unemployment is a deviation in the actual rate of unemployment from the natural rate.
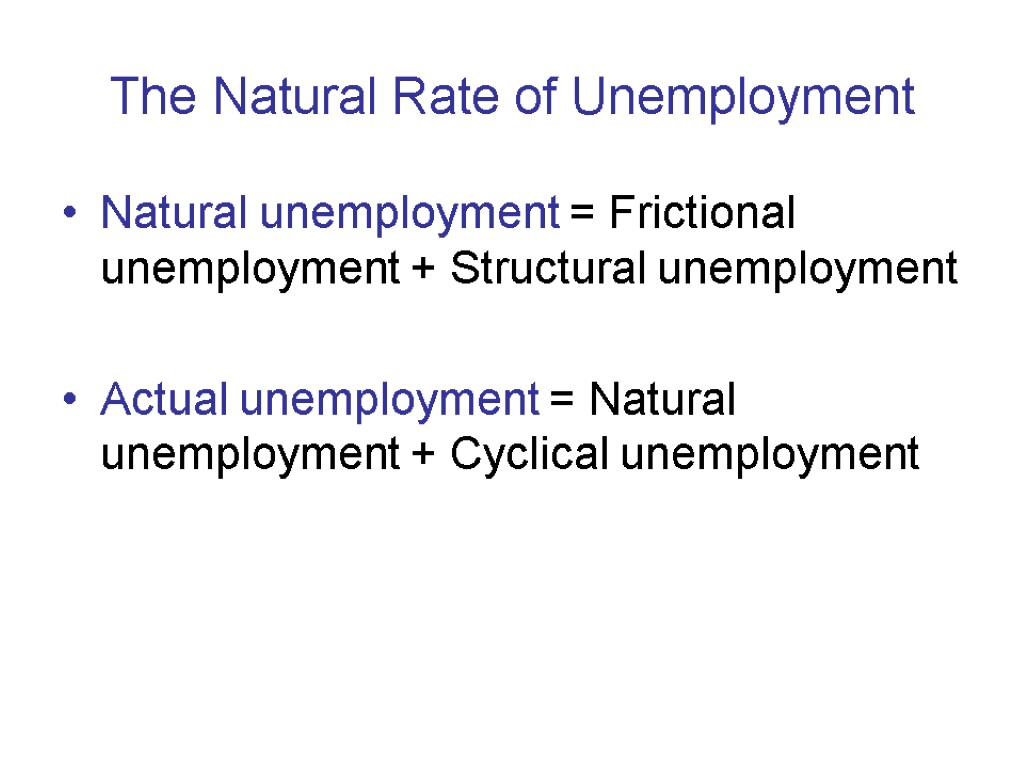
 The Natural Rate of Unemployment Natural unemployment = Frictional unemployment + Structural unemployment Actual unemployment = Natural unemployment + Cyclical unemployment
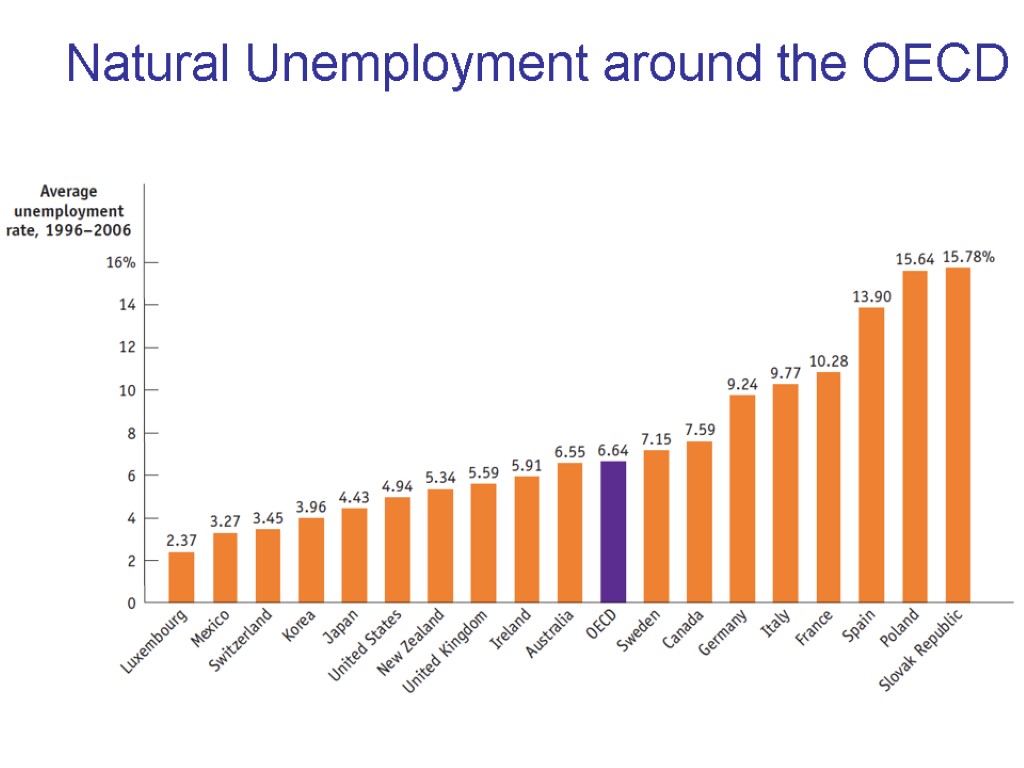
 Natural Unemployment around the OECD
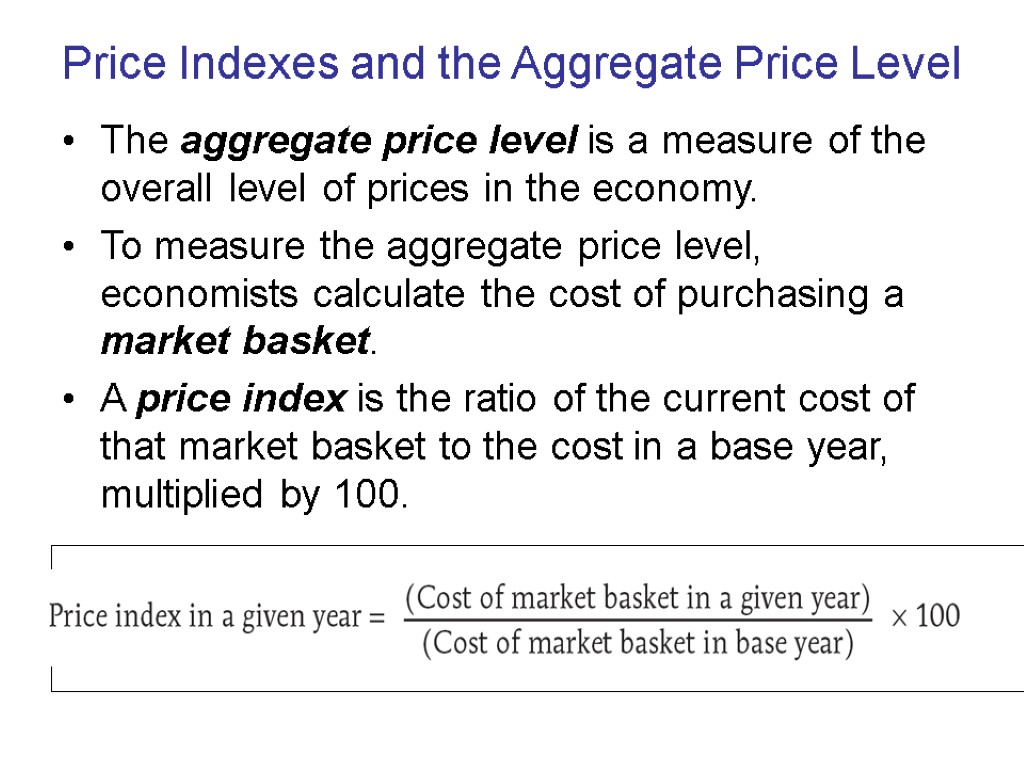
 Price Indexes and the Aggregate Price Level The aggregate price level is a measure of the overall level of prices in the economy. To measure the aggregate price level, economists calculate the cost of purchasing a market basket. A price index is the ratio of the current cost of that market basket to the cost in a base year, multiplied by 100.
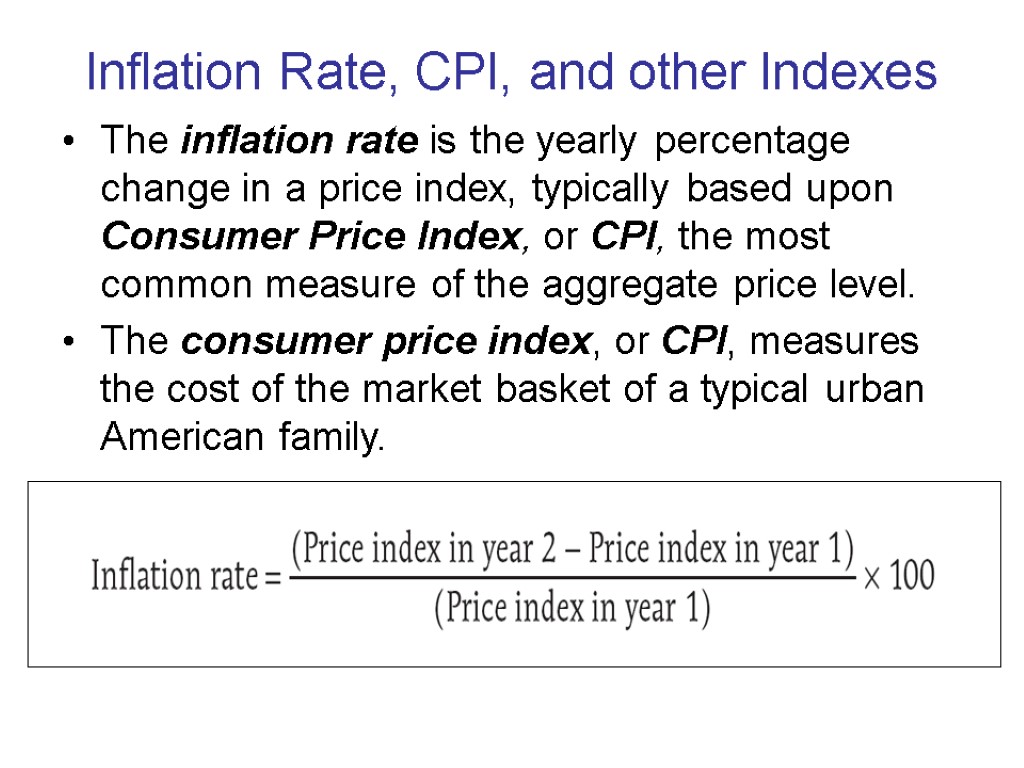
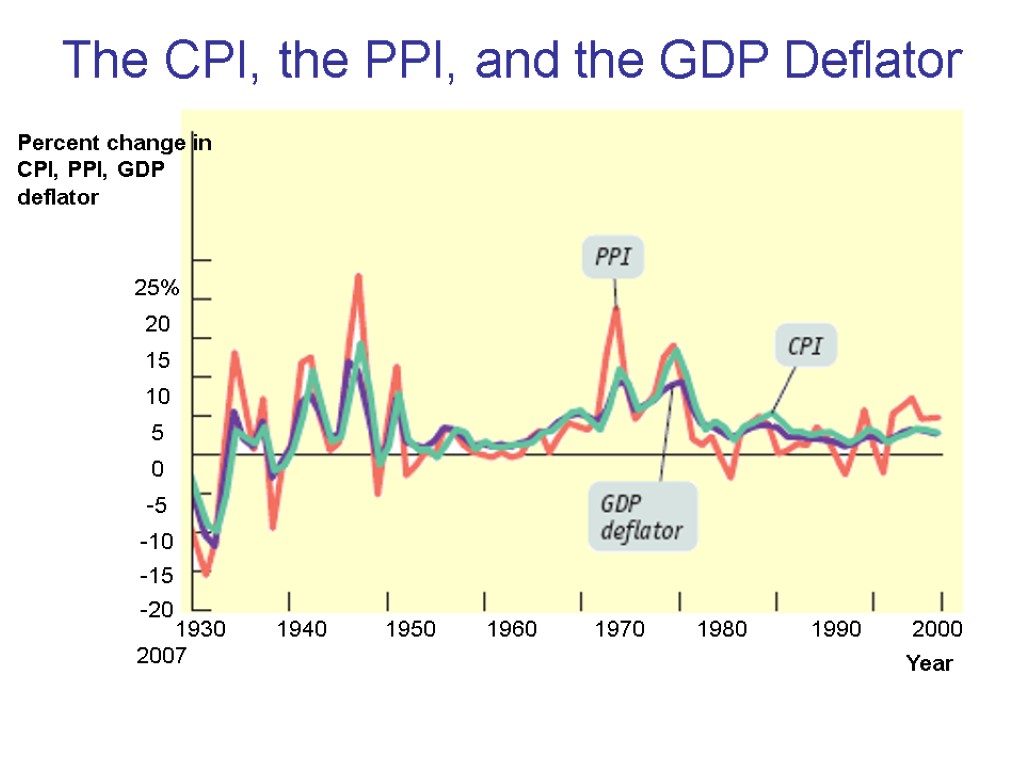
 Inflation Rate, CPI, and other Indexes The inflation rate is the yearly percentage change in a price index, typically based upon Consumer Price Index, or CPI, the most common measure of the aggregate price level. The consumer price index, or CPI, measures the cost of the market basket of a typical urban American family.
 Other Price Measures A similar index to CPI for goods purchased by firms is the producer price index. Economists also use the GDP deflator, which measures the price level by calculating the ratio of nominal to real GDP. The GDP deflator for a given year is 100 times the ratio of nominal GDP to real GDP in that year.
 The CPI, the PPI, and the GDP Deflator Percent change in CPI, PPI, GDP deflator 25% 20 15 10 5 0 -5 -10 -15 -20 1930 1940 1950 1960 1970 1980 1990 2000 2007 Year
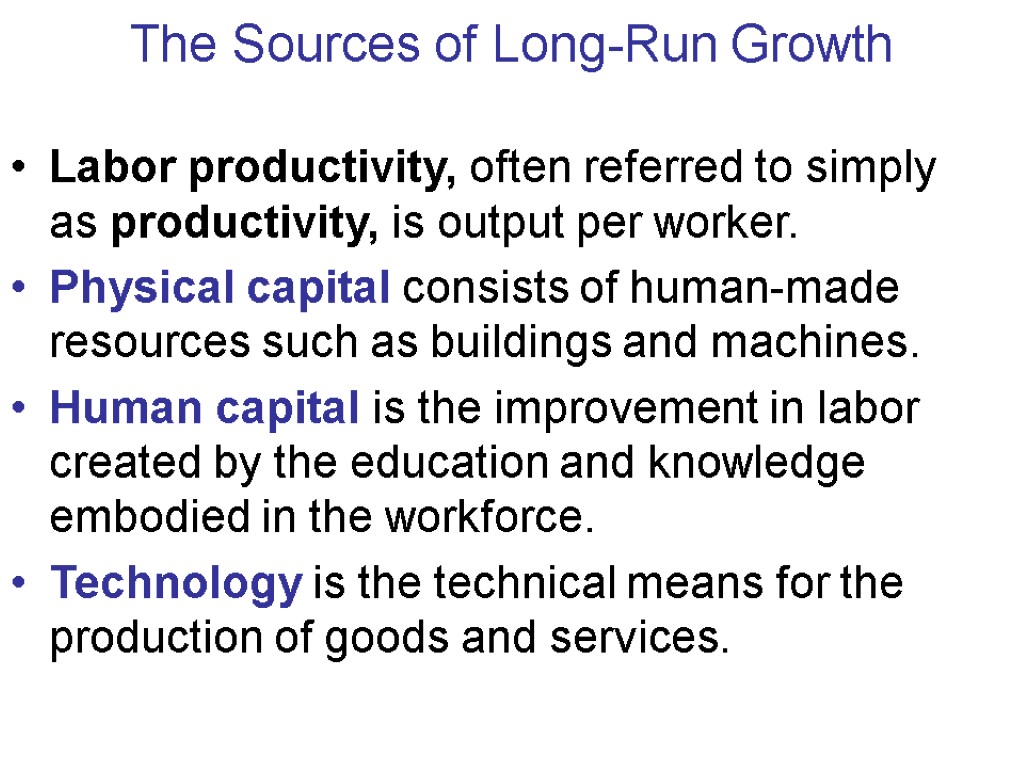
 The Sources of Long-Run Growth Labor productivity, often referred to simply as productivity, is output per worker. Physical capital consists of human-made resources such as buildings and machines. Human capital is the improvement in labor created by the education and knowledge embodied in the workforce. Technology is the technical means for the production of goods and services.
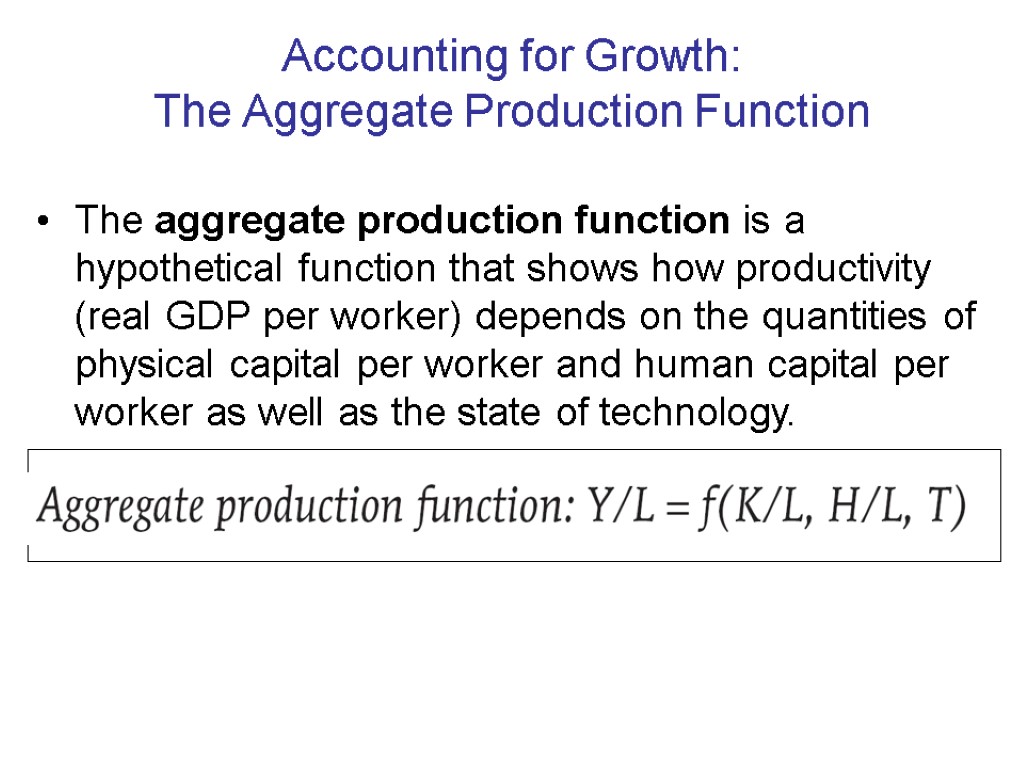
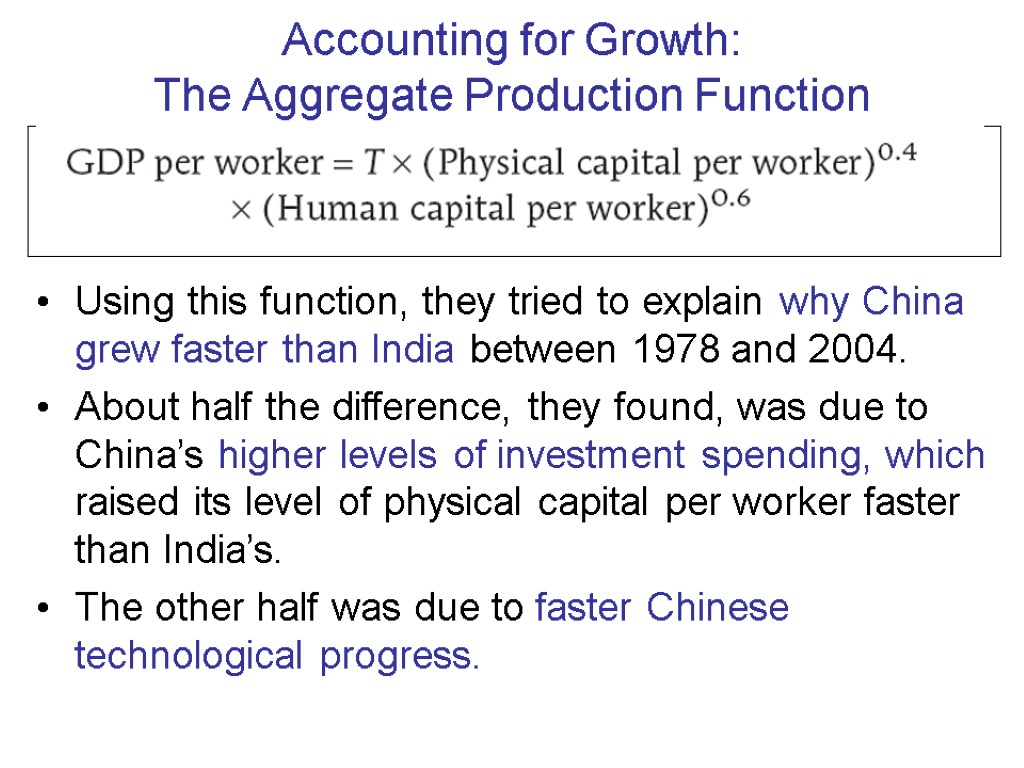
 Accounting for Growth: The Aggregate Production Function The aggregate production function is a hypothetical function that shows how productivity (real GDP per worker) depends on the quantities of physical capital per worker and human capital per worker as well as the state of technology.
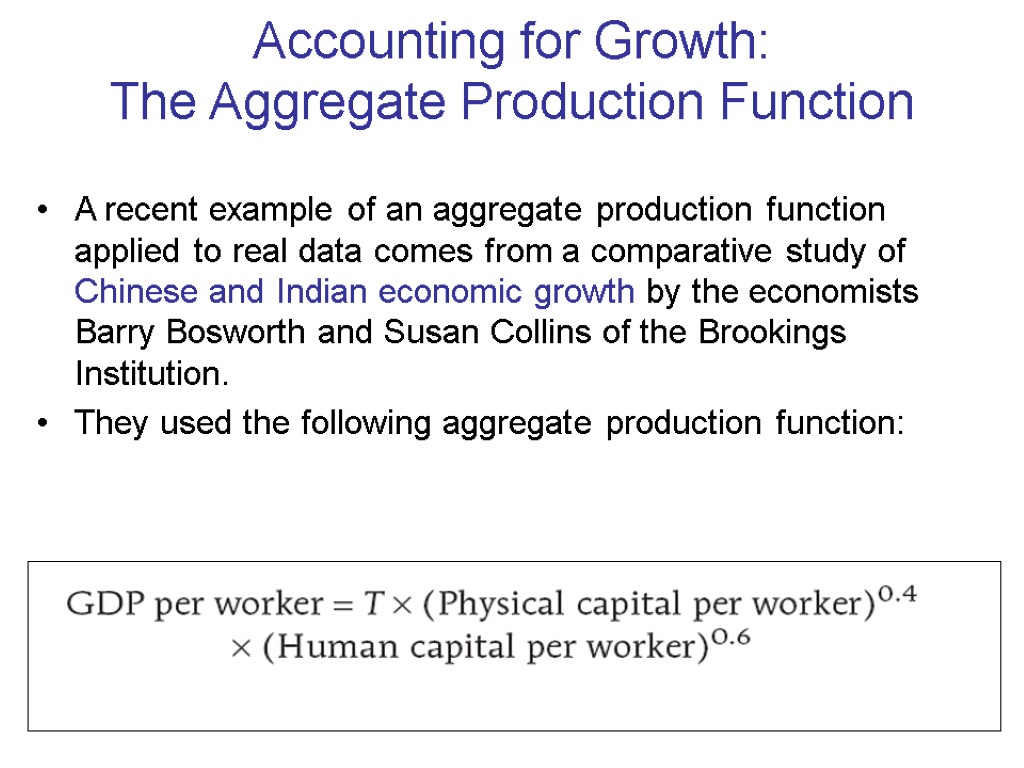
 Accounting for Growth: The Aggregate Production Function A recent example of an aggregate production function applied to real data comes from a comparative study of Chinese and Indian economic growth by the economists Barry Bosworth and Susan Collins of the Brookings Institution. They used the following aggregate production function:
 Accounting for Growth: The Aggregate Production Function Using this function, they tried to explain why China grew faster than India between 1978 and 2004. About half the difference, they found, was due to China’s higher levels of investment spending, which raised its level of physical capital per worker faster than India’s. The other half was due to faster Chinese technological progress.
 Why Growth Rates Differ A number of factors influence differences among countries in their growth rates. These are government policies and institutions that alter: savings and investment spending. foreign investment. education. Infrastructure. research and development. political stability. the protection of property rights.
 The Role of Government in Promoting Economic Growth Political stability and protection of property rights are crucial ingredients in long-run economic growth. Even when governments aren’t corrupt, excessive government intervention can be a brake on economic growth. If large parts of the economy are supported by government subsidies, protected from imports, or otherwise insulated from competition, productivity tends to suffer because of a lack of incentives.
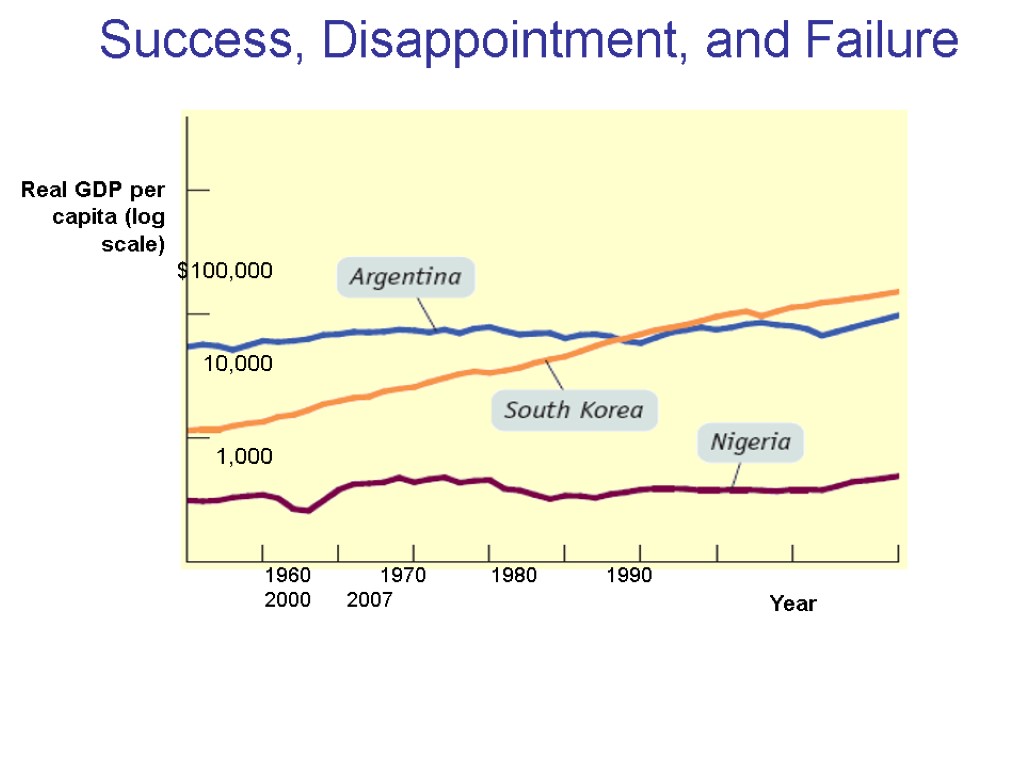
 Success, Disappointment, and Failure Real GDP per capita (log scale) 1960 1970 1980 1990 2000 2007 Year $100,000 10,000 1,000
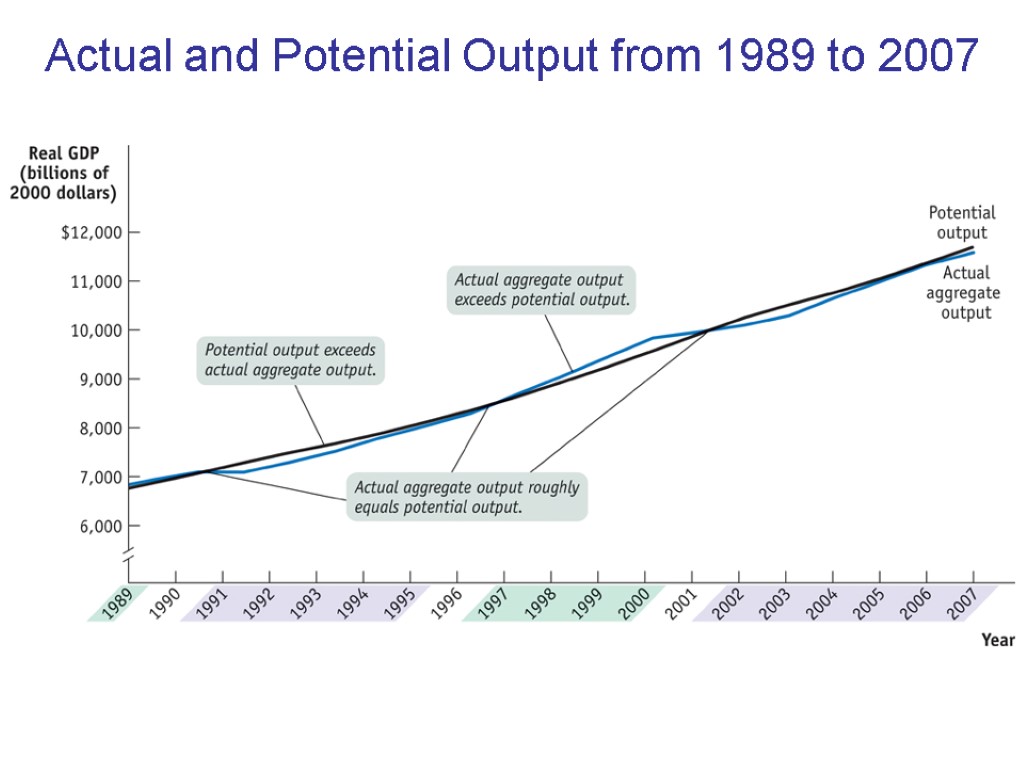
 Actual and Potential Output from 1989 to 2007
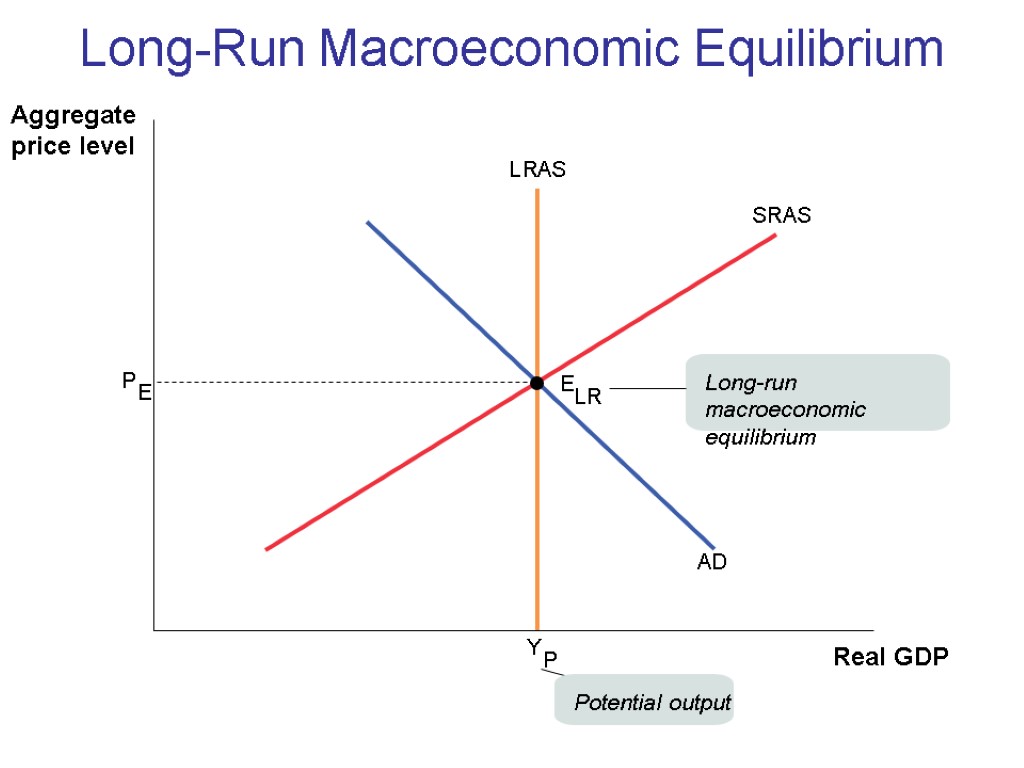
 Y P P E S R AS L R AS AD E LR Real GDP Aggregate price level Long-run macroeconomic equilibrium Potential output Long-Run Macroeconomic Equilibrium
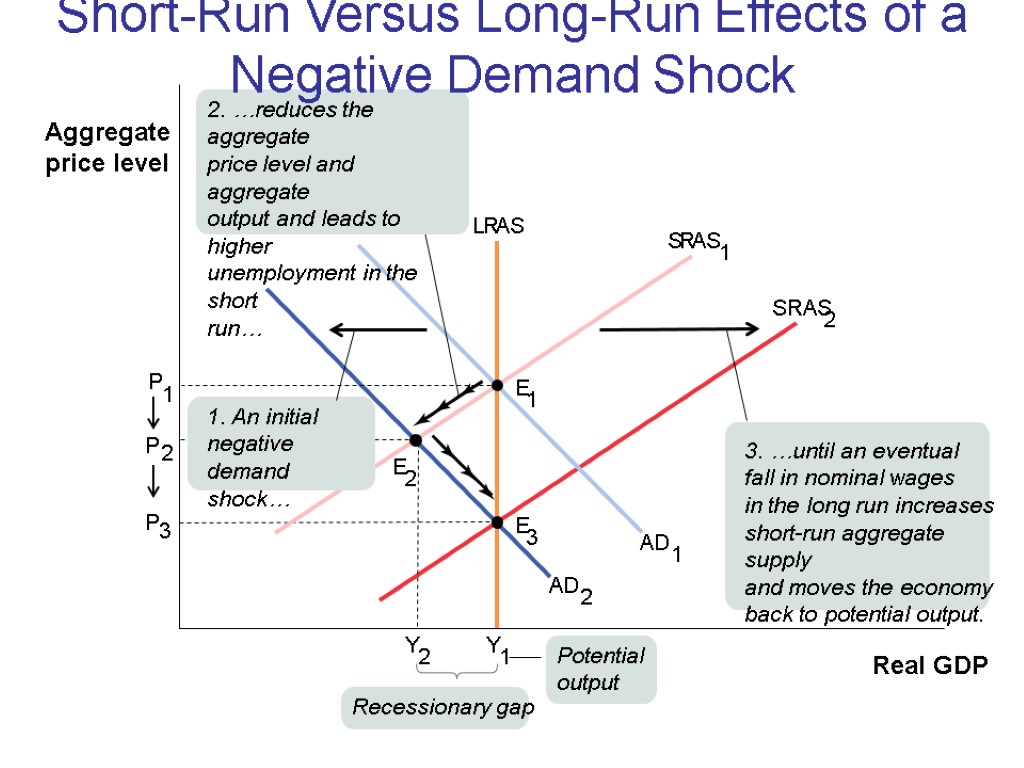
 Y 1 P E 1 2 S R AS 1 L R AS AD 1 Real GDP Aggregate price level Potential output E 3 P 3 SRAS 2 3. …until an eventual fall in nominal wages in the long run increases short-run aggregate supply and moves the economy back to potential output. 2 2. …reduces the aggregate price level and aggregate output and leads to higher unemployment in the short run… AD 2 Recessionary gap Y 2 E 1. An initial negative demand shock… 1 P Short-Run Versus Long-Run Effects of a Negative Demand Shock
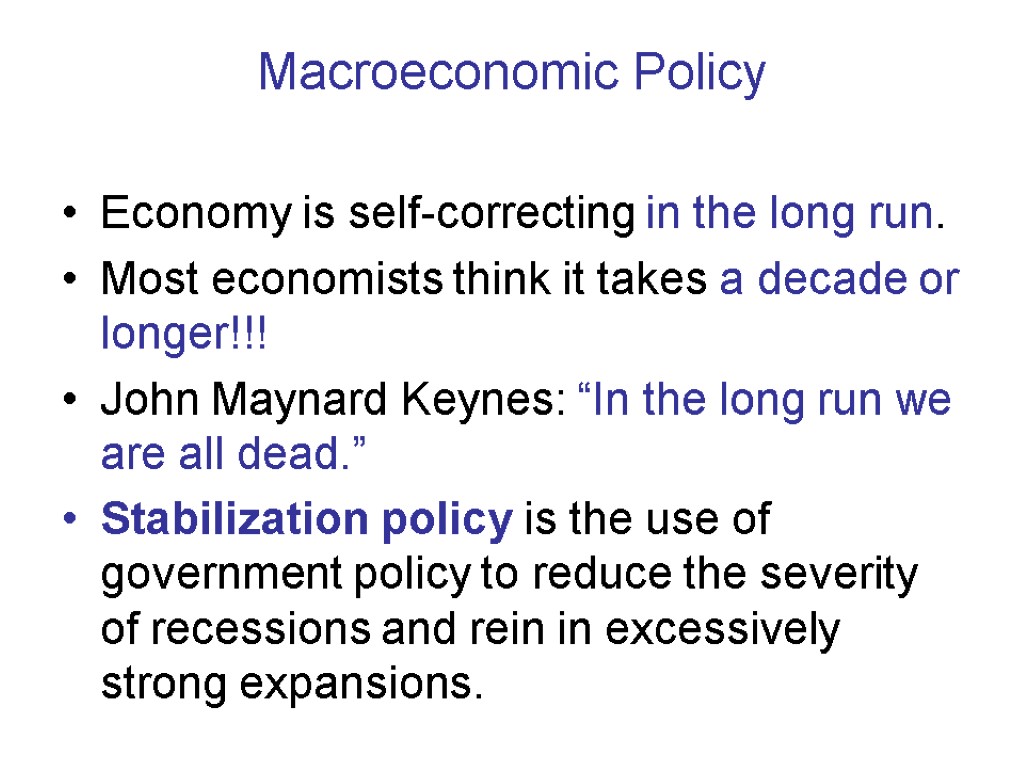
 Macroeconomic Policy Economy is self-correcting in the long run. Most economists think it takes a decade or longer!!! John Maynard Keynes: “In the long run we are all dead.” Stabilization policy is the use of government policy to reduce the severity of recessions and rein in excessively strong expansions.
 Keynes and the Long Run The British economist Sir John Maynard Keynes (1883–1946), probably more than any other single economist, created the modern field of macroeconomics. In 1923 Keynes published A Tract on Monetary Reform, a small book on the economic problems of Europe after World War I. In it he decried the tendency of many of his colleagues to focus on how things work out in the long run: “This long run is a misleading guide to current affairs. In the long run we are all dead. Economists set themselves too easy, too useless a task if in tempestuous seasons they can only tell us that when the storm is long past the sea is flat again.”
 Macroeconomic Policy The high cost — in terms of unemployment (u) — of a recessionary gap and the future adverse consequences of an inflationary gap (π) Active stabilization policy, using fiscal or monetary policy to offset shocks.
 Fiscal Policy and the Multiplier Fiscal policy has a multiplier effect on the economy. Expansionary fiscal policy leads to an increase in real GDP larger than the initial rise in aggregate spending caused by the policy. Conversely, contractionary fiscal policy leads to a fall in real GDP larger than the initial reduction in aggregate spending caused by the policy. Changes in government purchases have a more powerful effect on the economy than equal-sized changes in taxes or transfers.
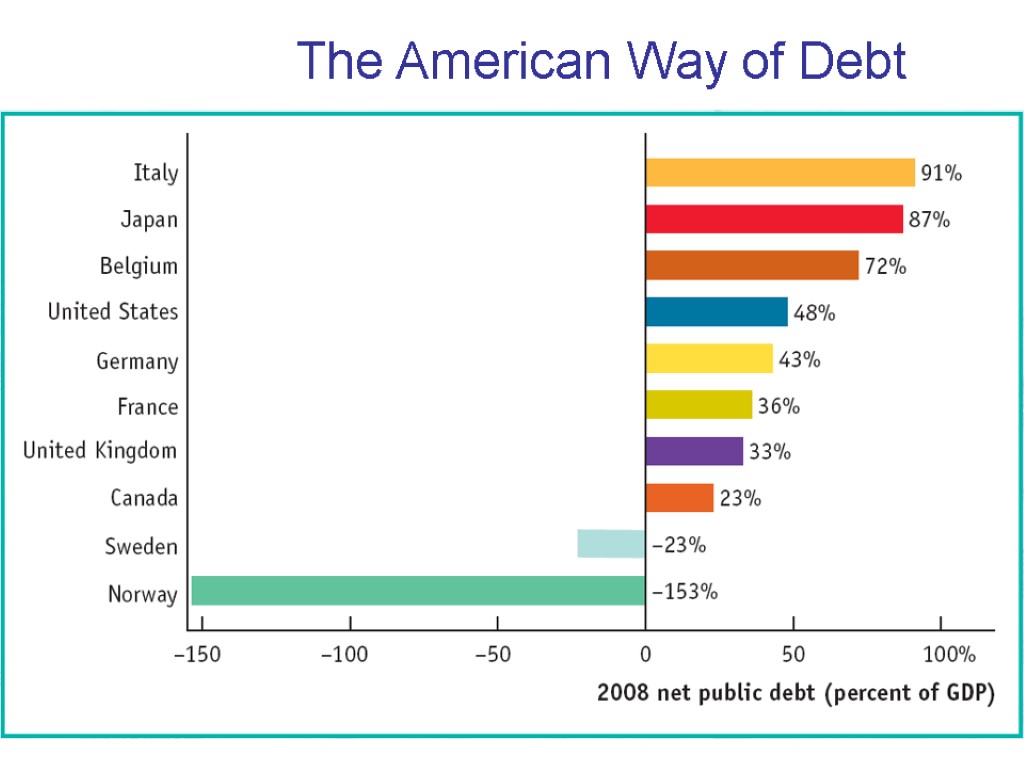
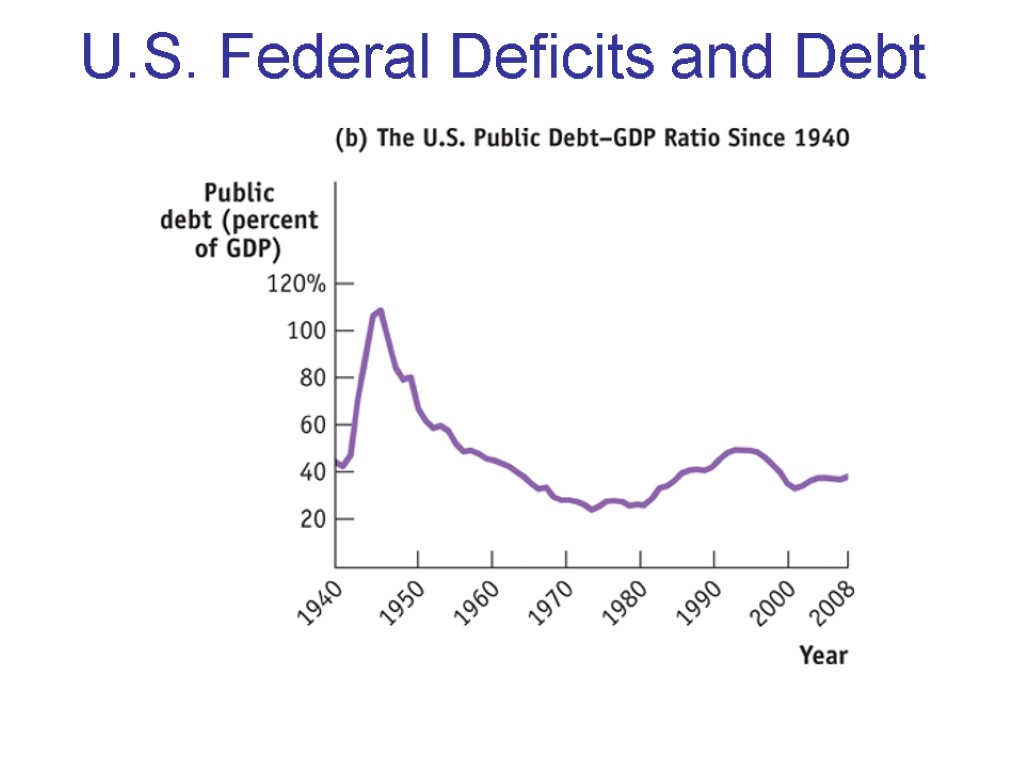
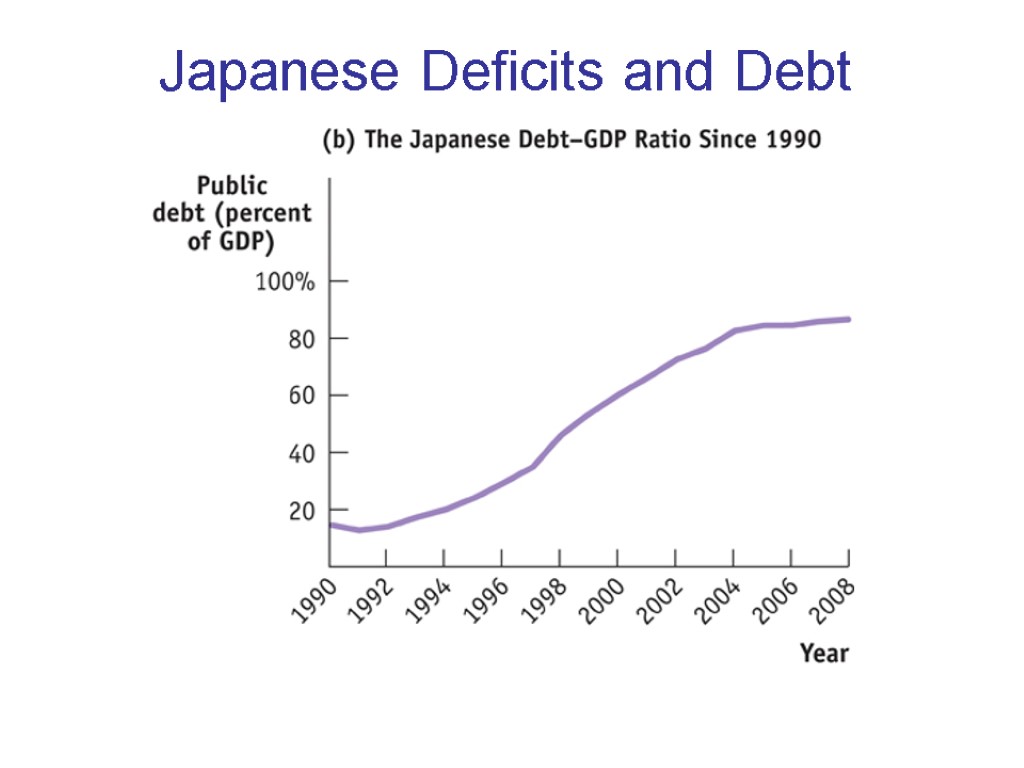
 Long-Run Implications of Fiscal Policy Persistent budget deficits have long-run consequences because they lead to an increase in public debt. Public debt is the debt owed be the Government (all levels) to all bondholders, holders of other debt securities and creditors. Internal public debt - debt to bondholders and banks within a country. External public debt – is owed to foreign residents – foreign Governments, institutions and individuals
 Problems Posed by Rising Government Debt Public debt may crowd out investment spending, which reduces long-run economic growth. And in extreme cases, rising debt may lead to government default, resulting in economic and financial turmoil. Can’t a government that has trouble borrowing just print money to pay its bills? Yes, it can, but this leads to another problem: inflation.
 The American Way of Debt
 U.S. Federal Deficits and Debt
 Japanese Deficits and Debt
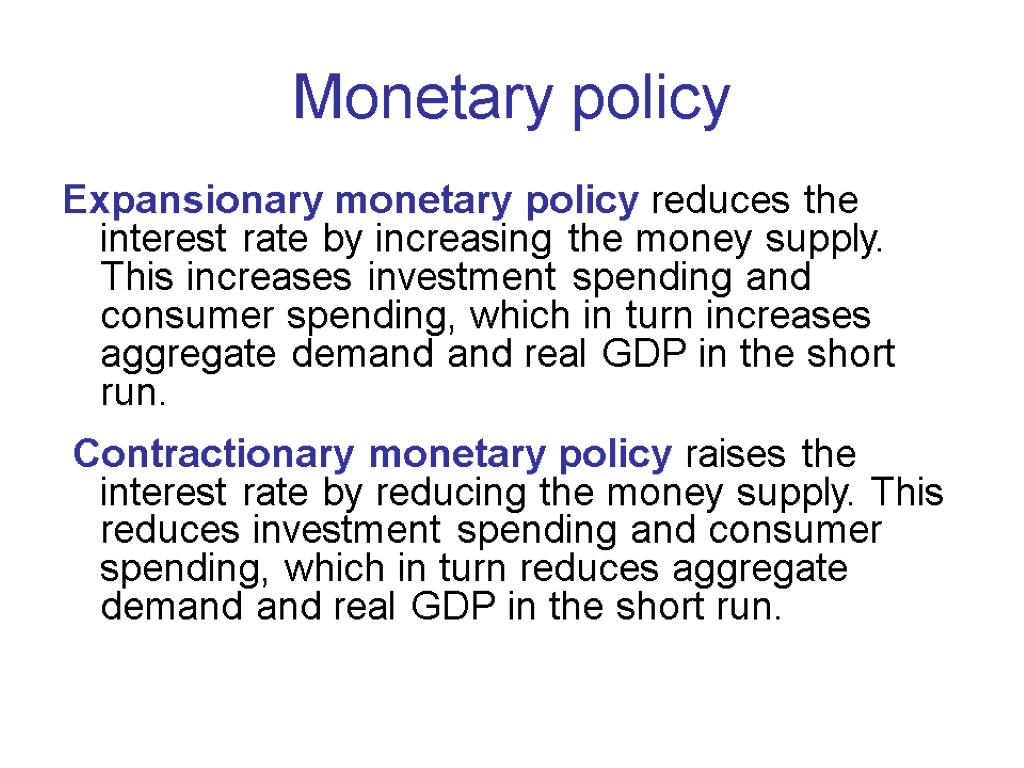
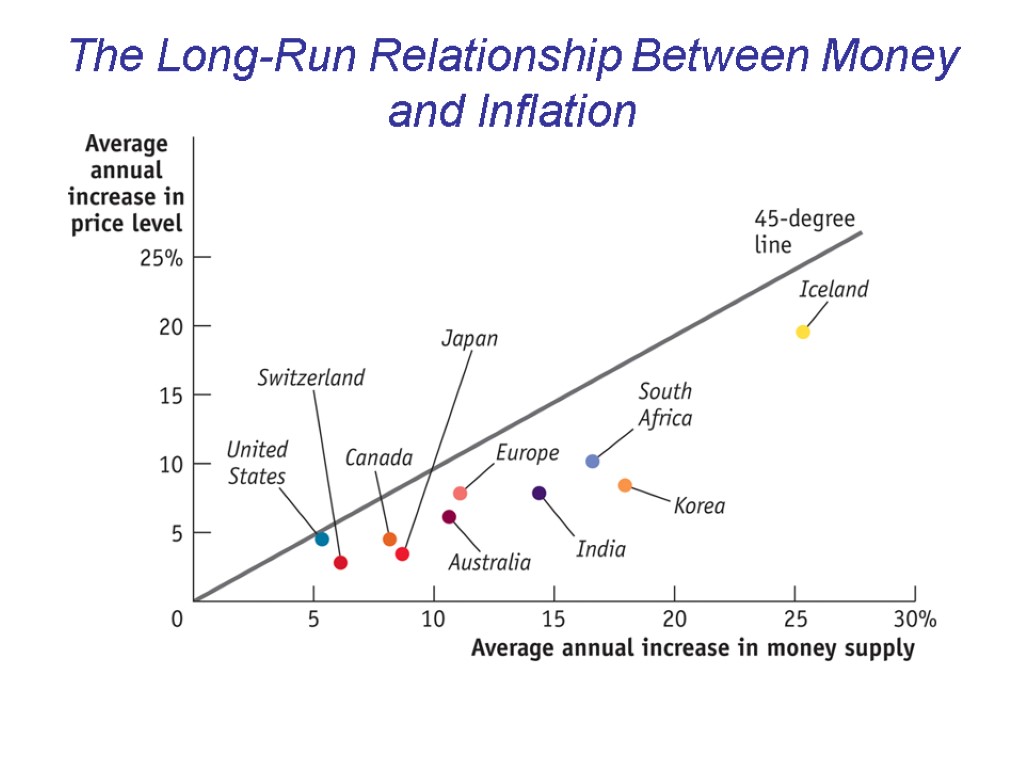
 Monetary policy Expansionary monetary policy reduces the interest rate by increasing the money supply. This increases investment spending and consumer spending, which in turn increases aggregate demand and real GDP in the short run. Contractionary monetary policy raises the interest rate by reducing the money supply. This reduces investment spending and consumer spending, which in turn reduces aggregate demand and real GDP in the short run.
 The Long-Run Relationship Between Money and Inflation
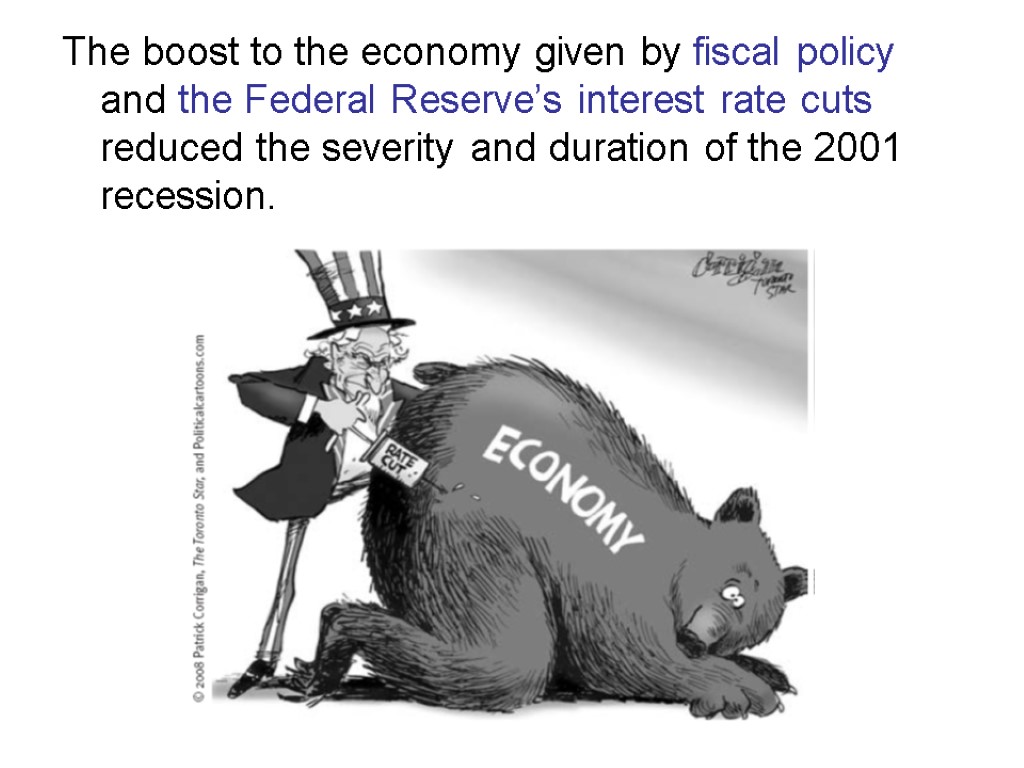
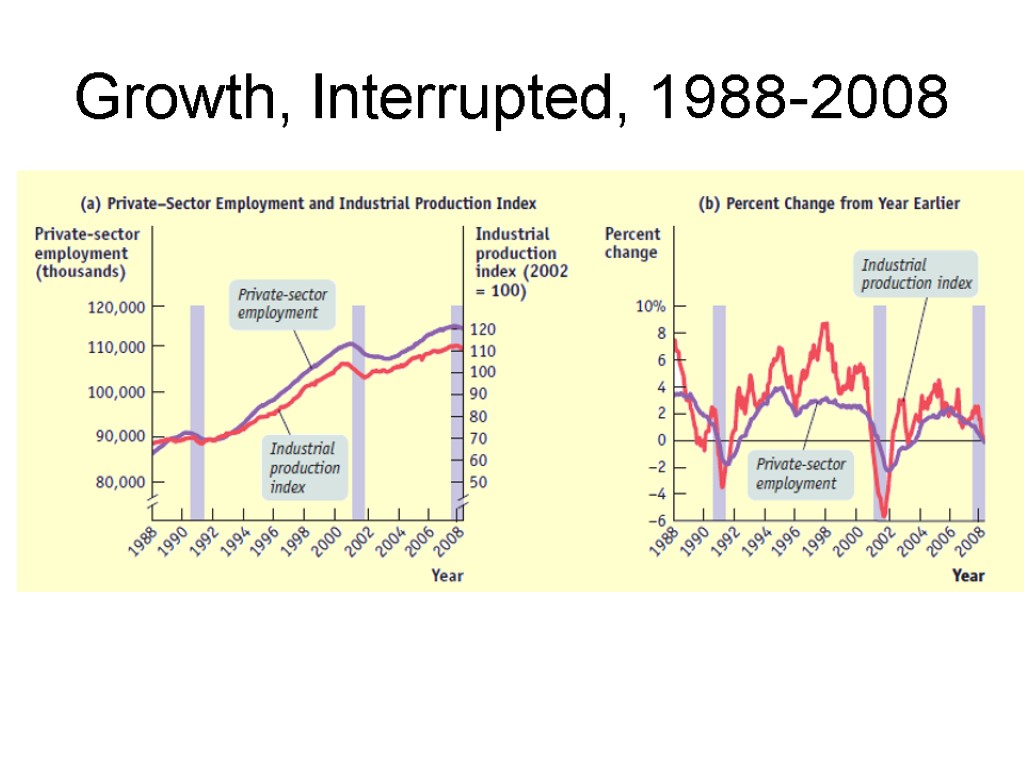
 The boost to the economy given by fiscal policy and the Federal Reserve’s interest rate cuts reduced the severity and duration of the 2001 recession.
 Growth, Interrupted, 1988-2008
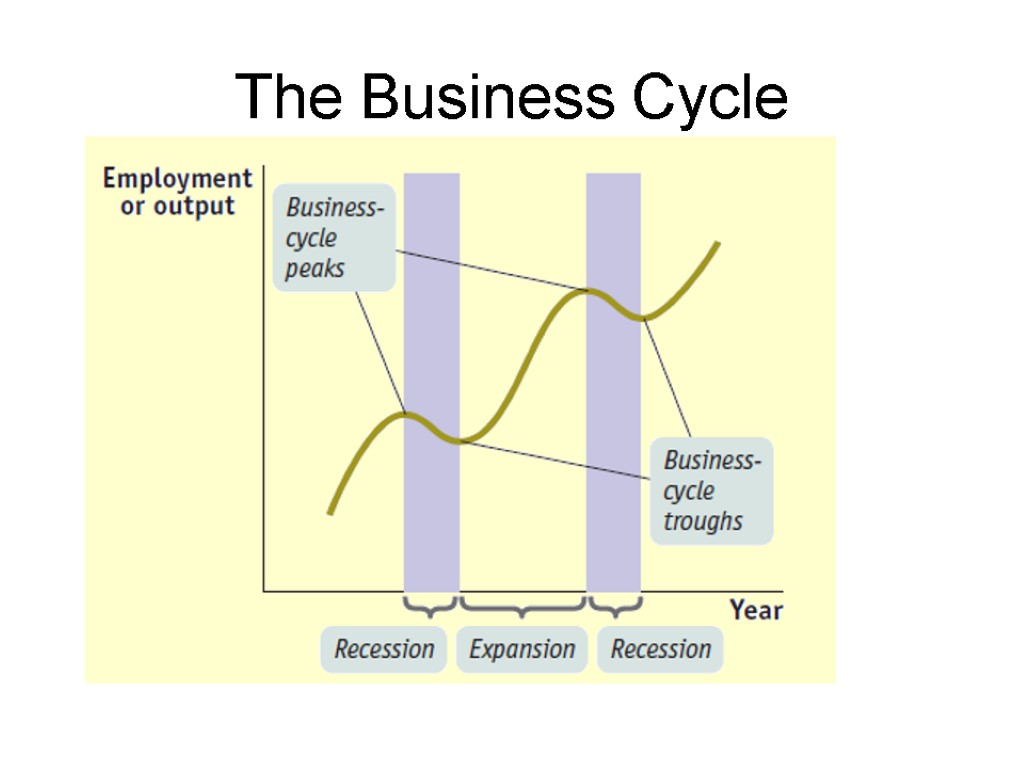
 The Business Cycle
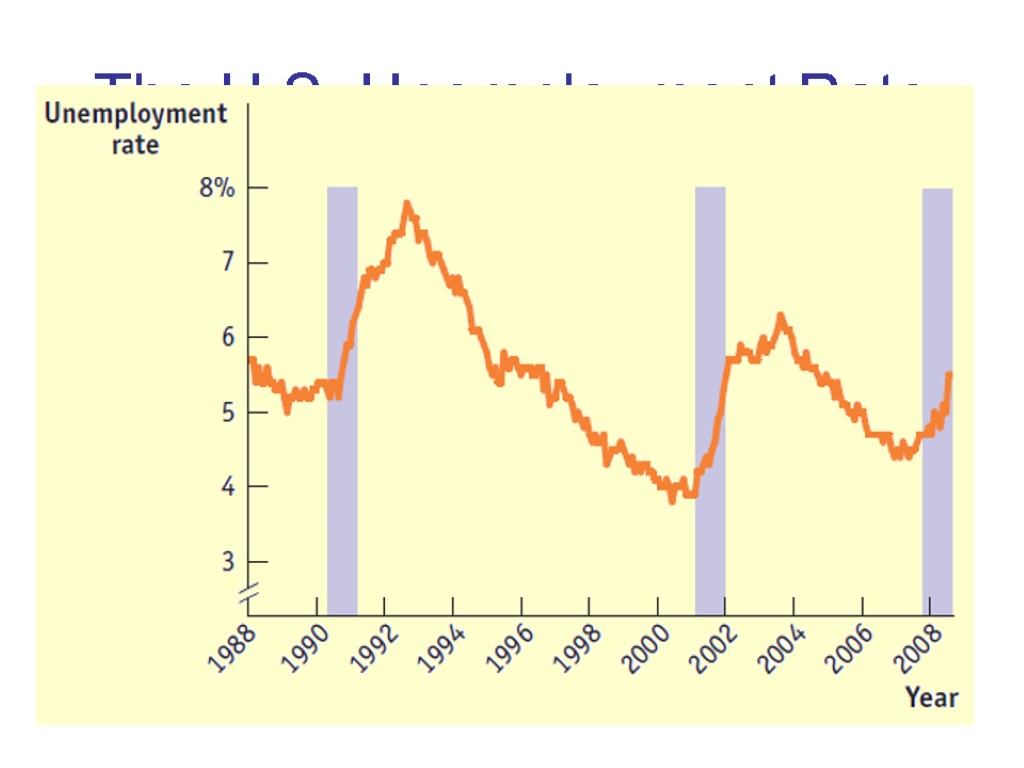
 The U.S. Unemployment Rate
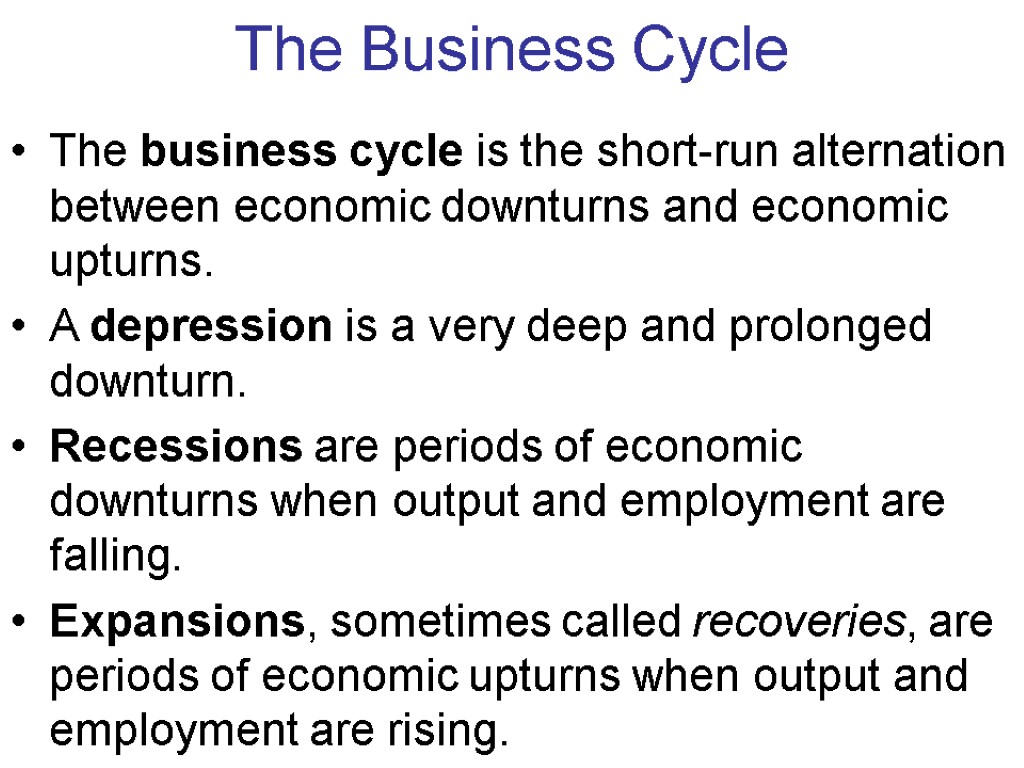
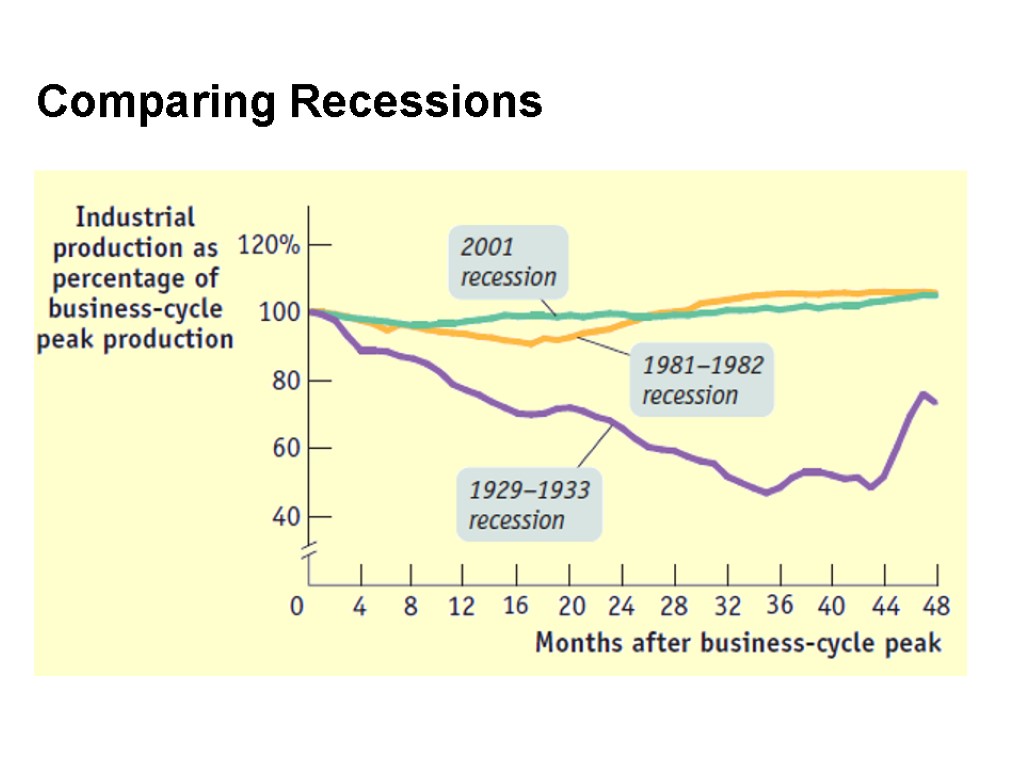
 The Business Cycle The business cycle is the short-run alternation between economic downturns and economic upturns. A depression is a very deep and prolonged downturn. Recessions are periods of economic downturns when output and employment are falling. Expansions, sometimes called recoveries, are periods of economic upturns when output and employment are rising.
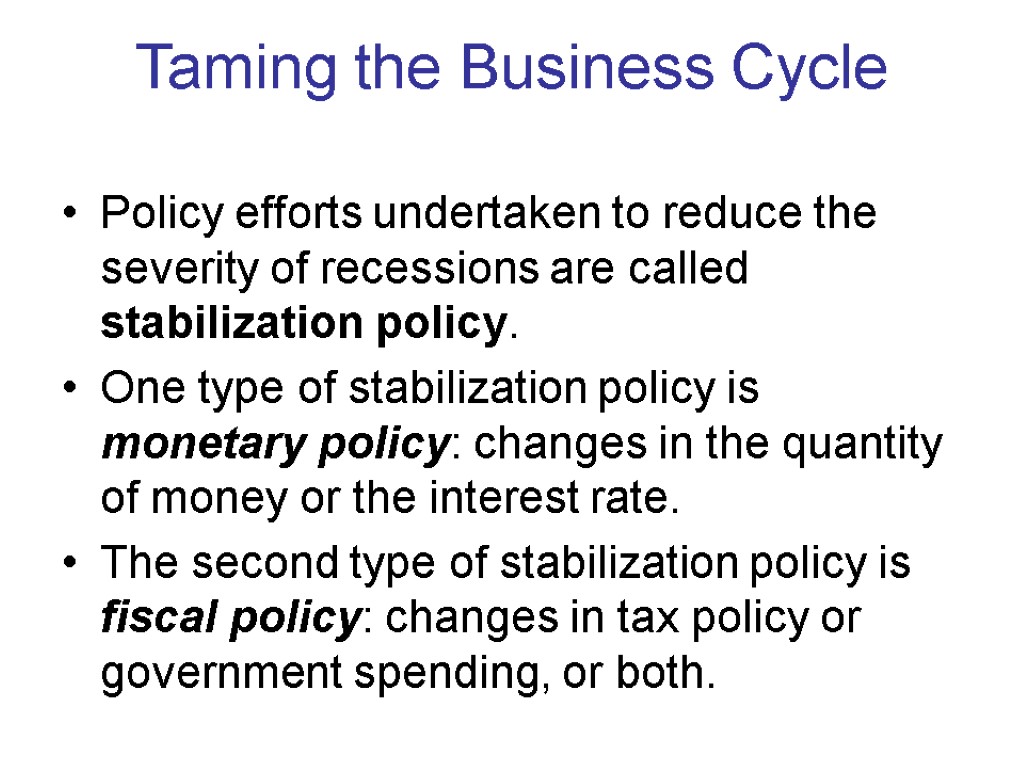
 Taming the Business Cycle Policy efforts undertaken to reduce the severity of recessions are called stabilization policy. One type of stabilization policy is monetary policy: changes in the quantity of money or the interest rate. The second type of stabilization policy is fiscal policy: changes in tax policy or government spending, or both.
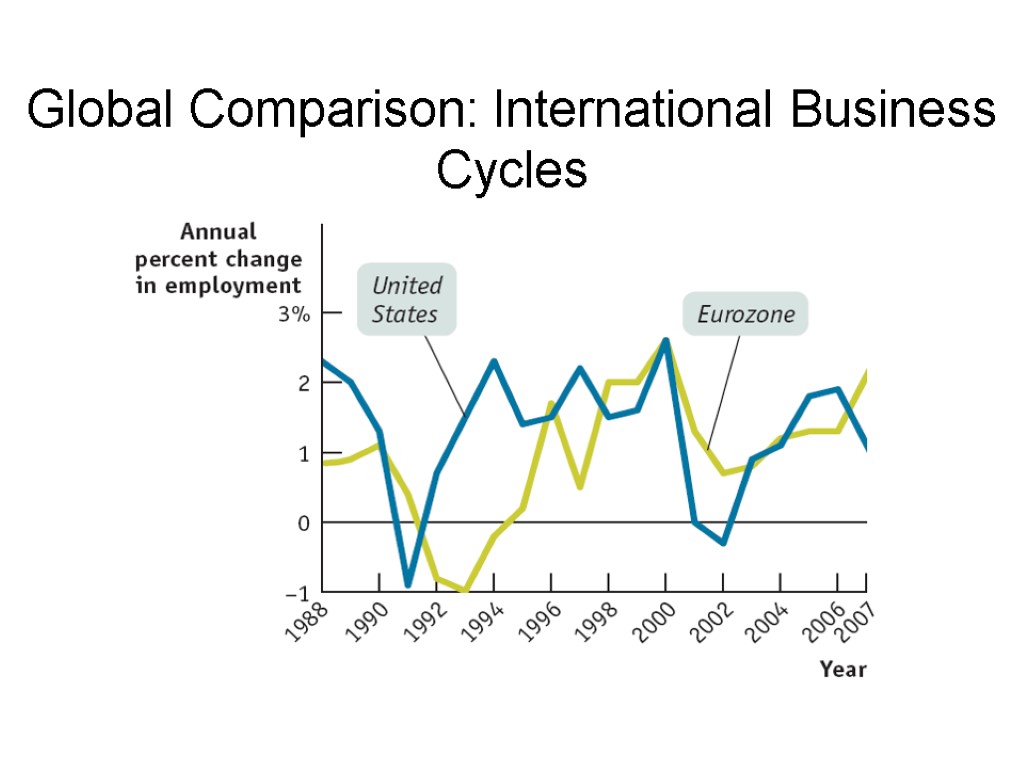
 Global Comparison: International Business Cycles
 Comparing Recessions
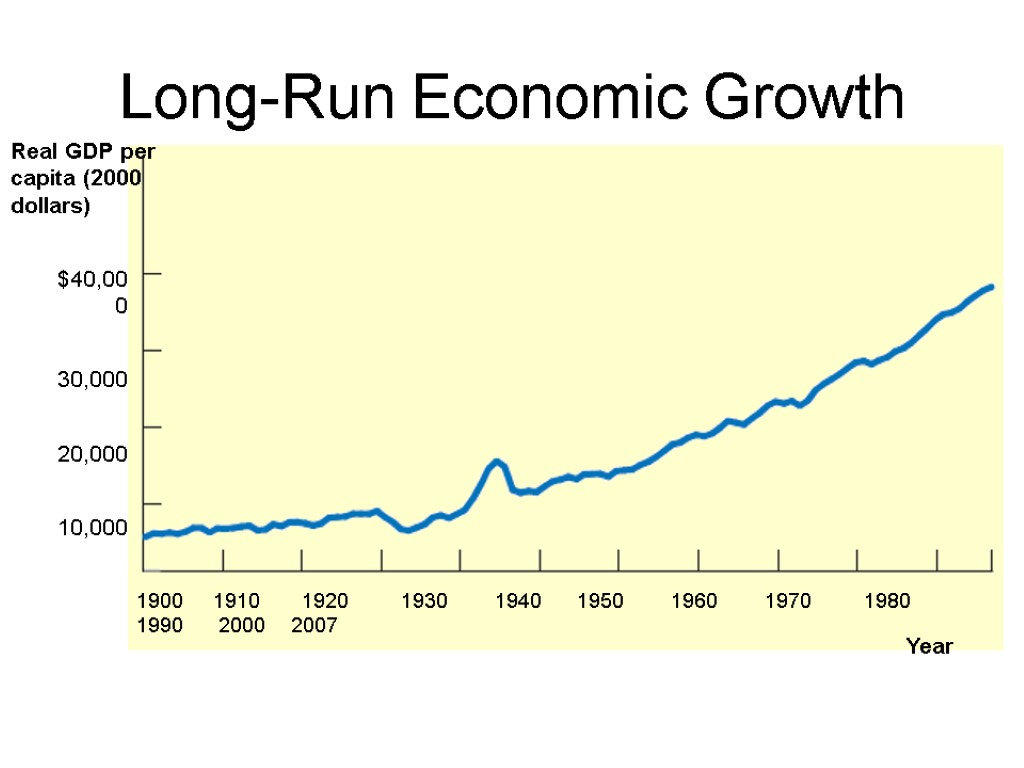
 Long-Run Economic Growth Long-run economic growth is the sustained upward trend in the economy’s output over time. A country can achieve a permanent increase in the standard of living of its citizens only through long-run growth. A central concern of macroeconomics is what determines long-run economic growth.
 Long-Run Economic Growth Real GDP per capita (2000 dollars) 1900 1910 1920 1930 1940 1950 1960 1970 1980 1990 2000 2007 Year $40,000 30,000 20,000 10,000
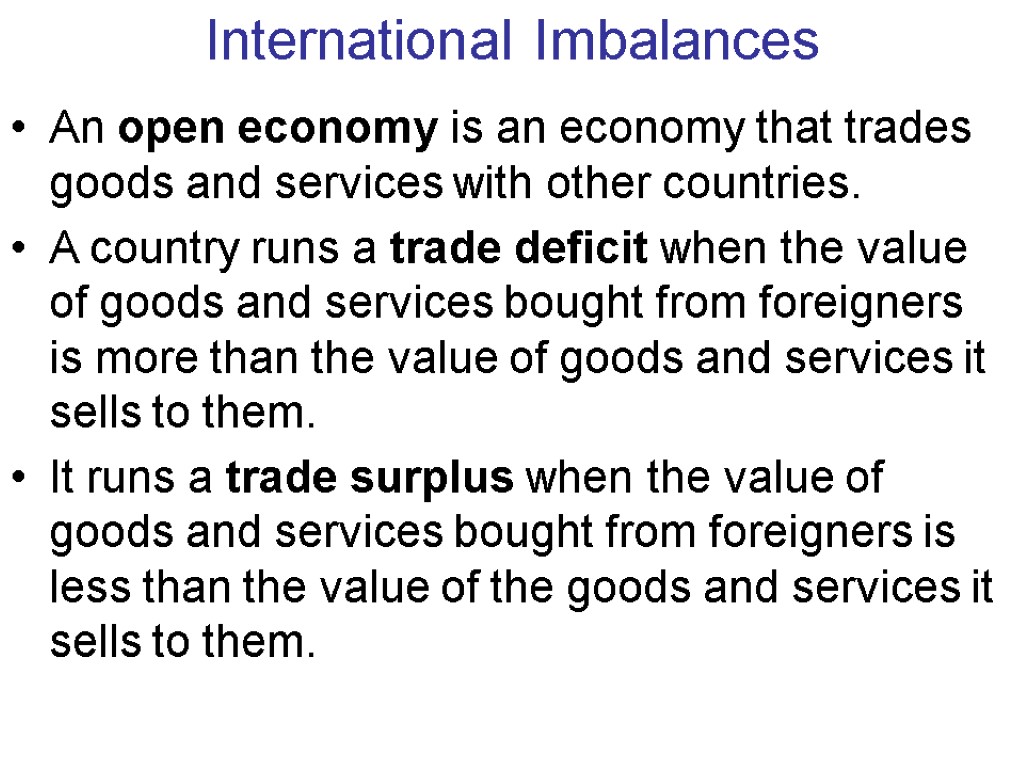
 International Imbalances An open economy is an economy that trades goods and services with other countries. A country runs a trade deficit when the value of goods and services bought from foreigners is more than the value of goods and services it sells to them. It runs a trade surplus when the value of goods and services bought from foreigners is less than the value of the goods and services it sells to them.
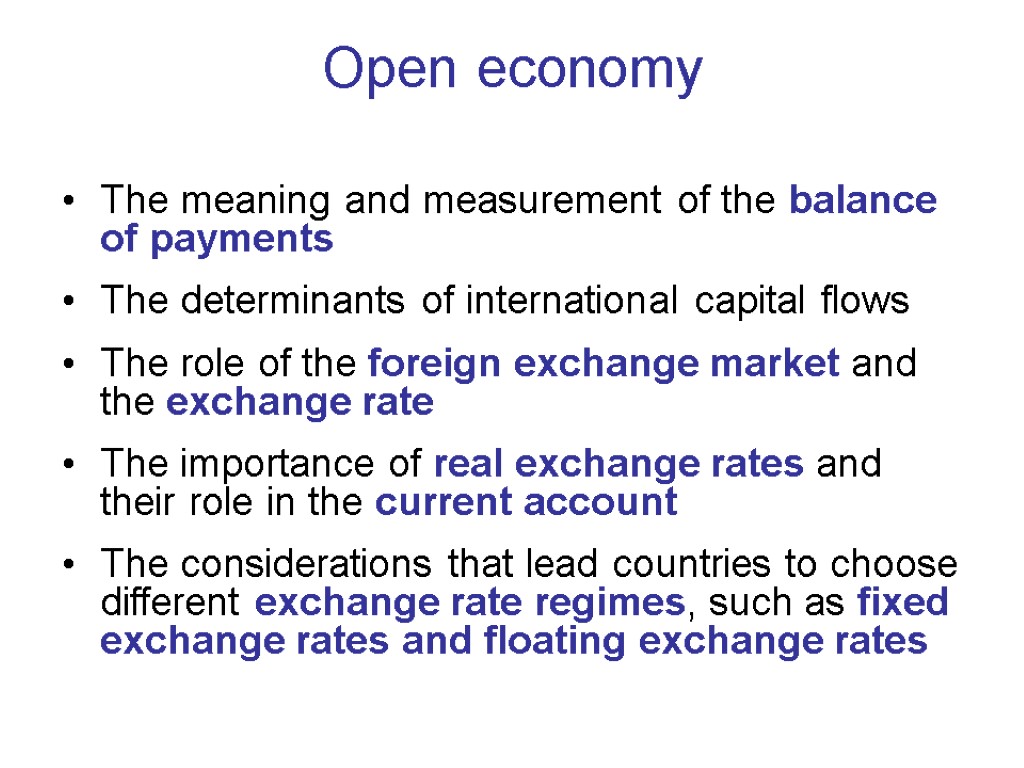
 Open economy The meaning and measurement of the balance of payments The determinants of international capital flows The role of the foreign exchange market and the exchange rate The importance of real exchange rates and their role in the current account The considerations that lead countries to choose different exchange rate regimes, such as fixed exchange rates and floating exchange rates
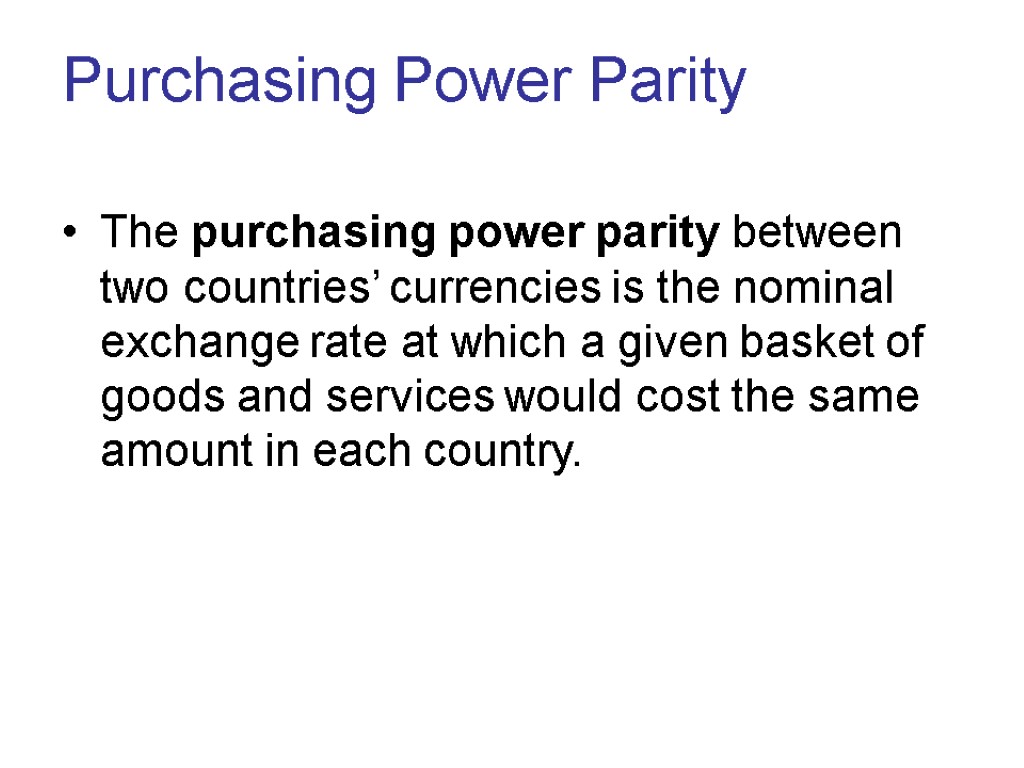
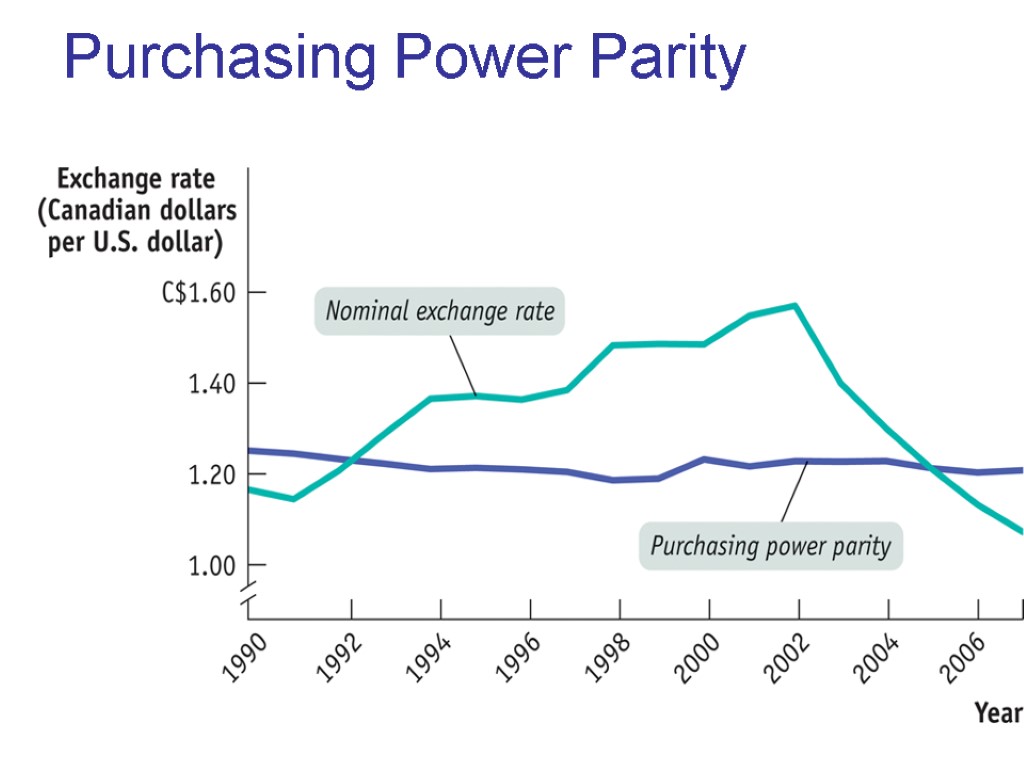
 Purchasing Power Parity The purchasing power parity between two countries’ currencies is the nominal exchange rate at which a given basket of goods and services would cost the same amount in each country.
 Purchasing Power Parity
 Exchange Rate Policy An exchange rate regime is a rule governing policy toward the exchange rate. A country has a fixed exchange rate when the government keeps the exchange rate against some other currency at or near a particular target. A country has a floating exchange rate when the government lets the exchange rate go wherever the market takes it.
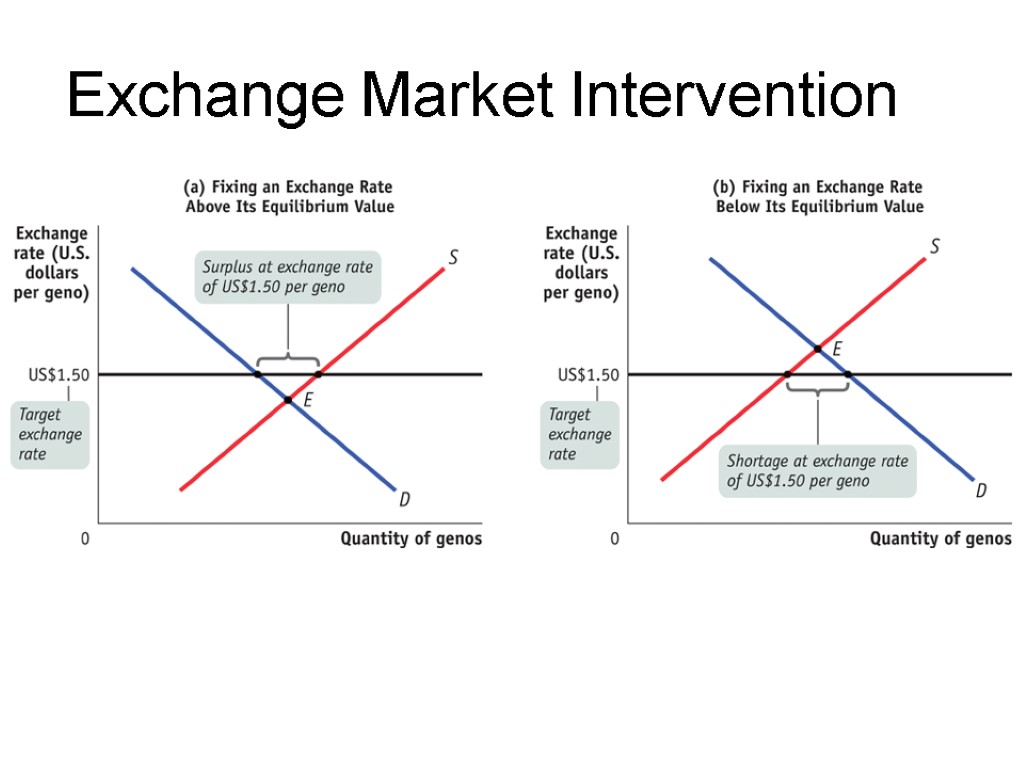
 Exchange Market Intervention Government purchases or sales of currency in the foreign exchange market are exchange market interventions. Foreign exchange reserves are stocks of foreign currency that governments maintain to buy their own currency on the foreign exchange market. Foreign exchange controls are licensing systems that limit the right of individuals to buy foreign currency.
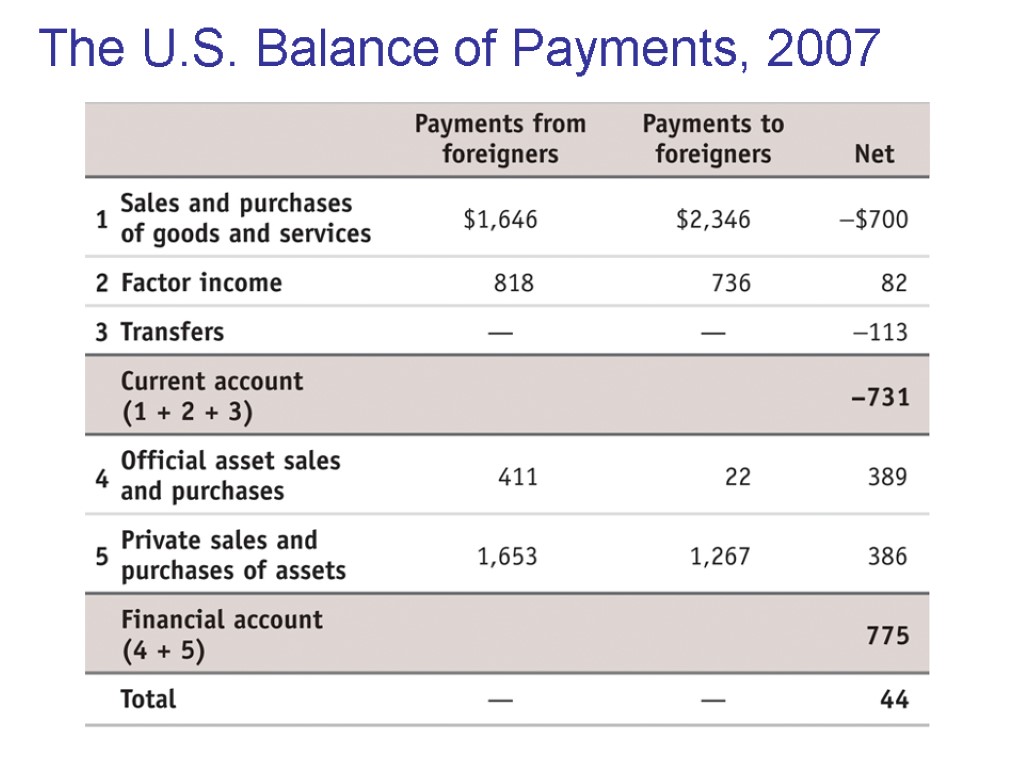
 The U.S. Balance of Payments, 2007
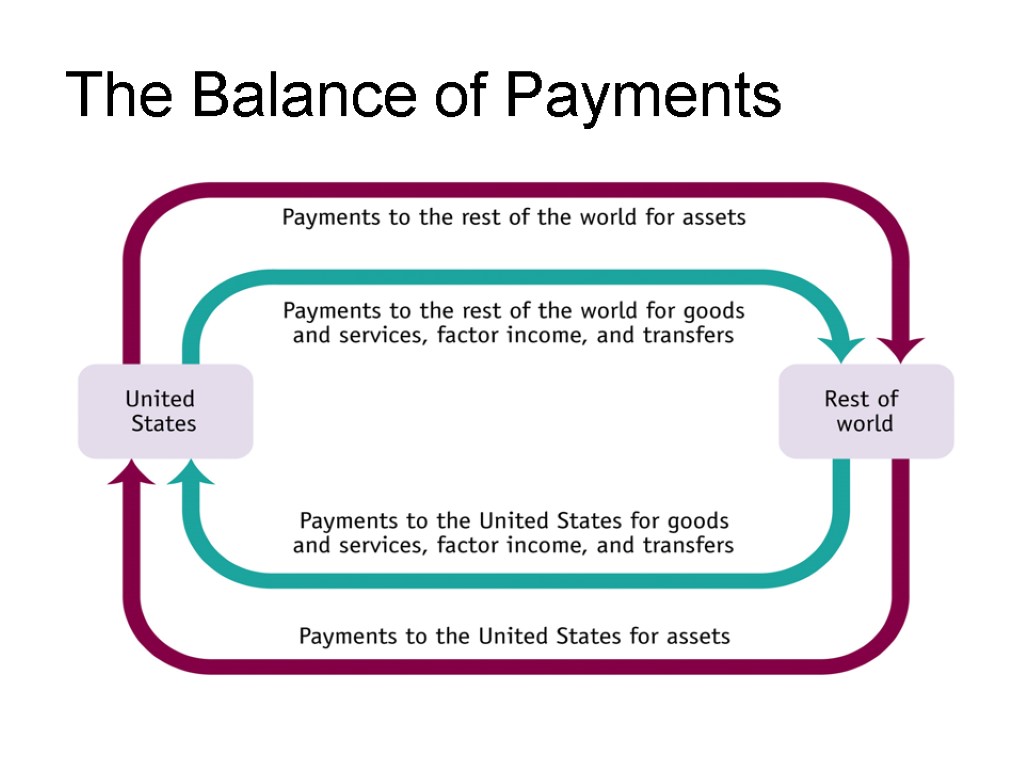
 The Balance of Payments
 The Role Of The Exchange Rate Currencies are traded in the foreign exchange market. The prices at which currencies trade are known as exchange rates. When a currency becomes more valuable in terms of other currencies, it appreciates. When a currency becomes less valuable in terms of other currencies, it depreciates.
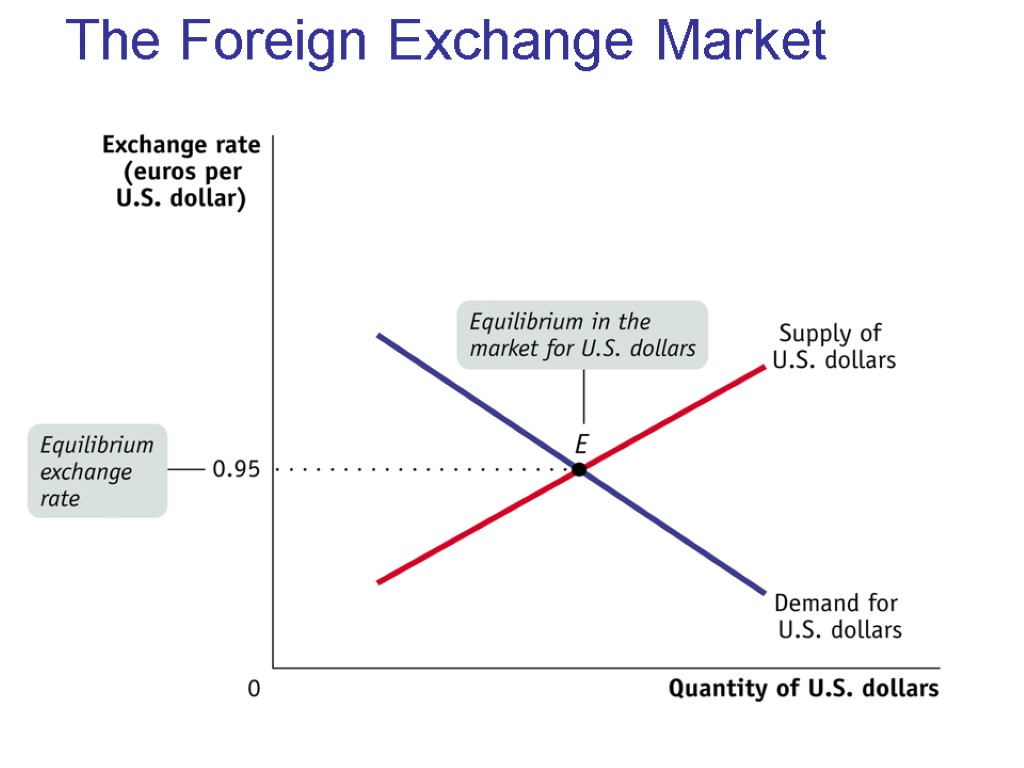
 The Foreign Exchange Market
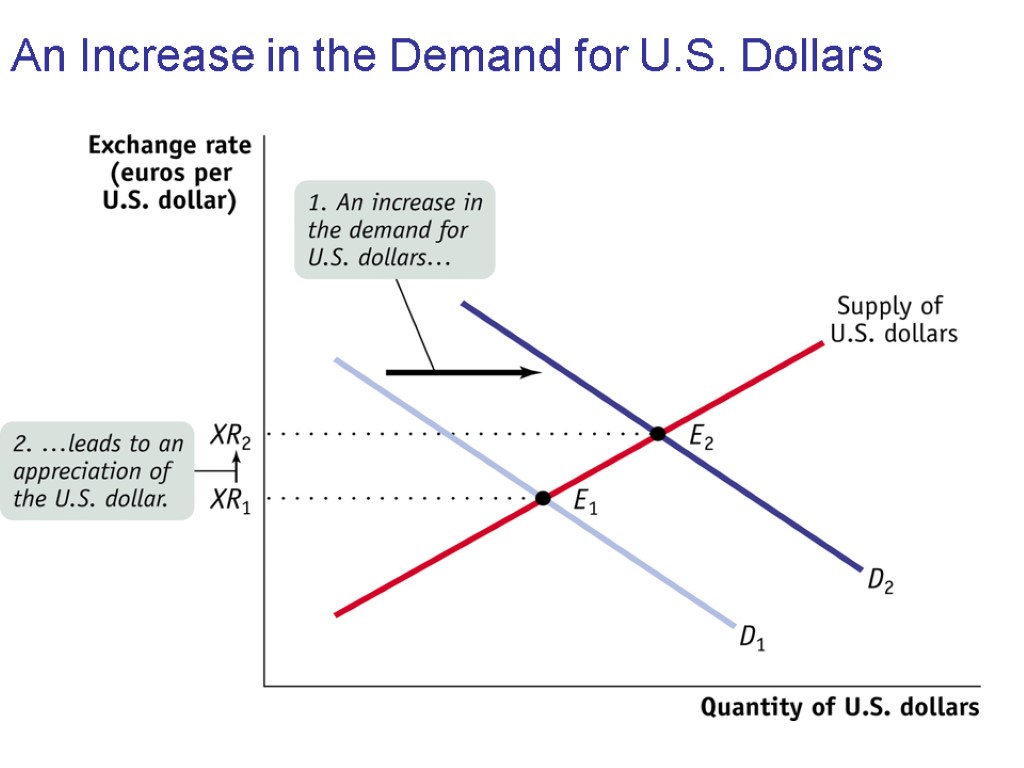
 An Increase in the Demand for U.S. Dollars
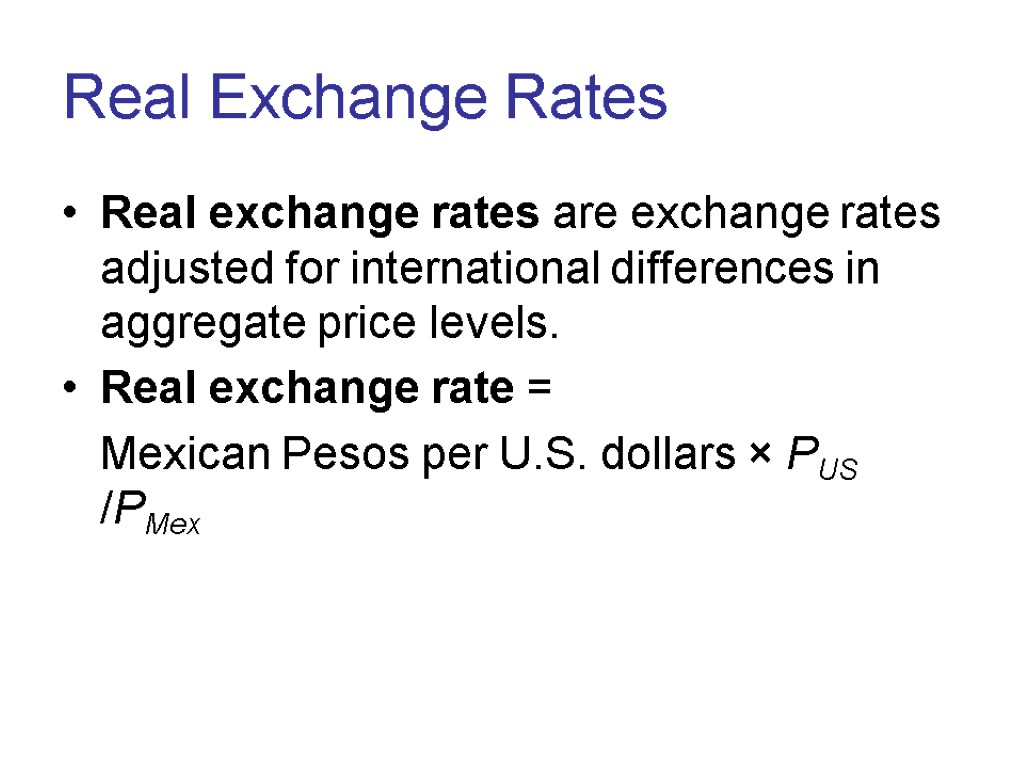
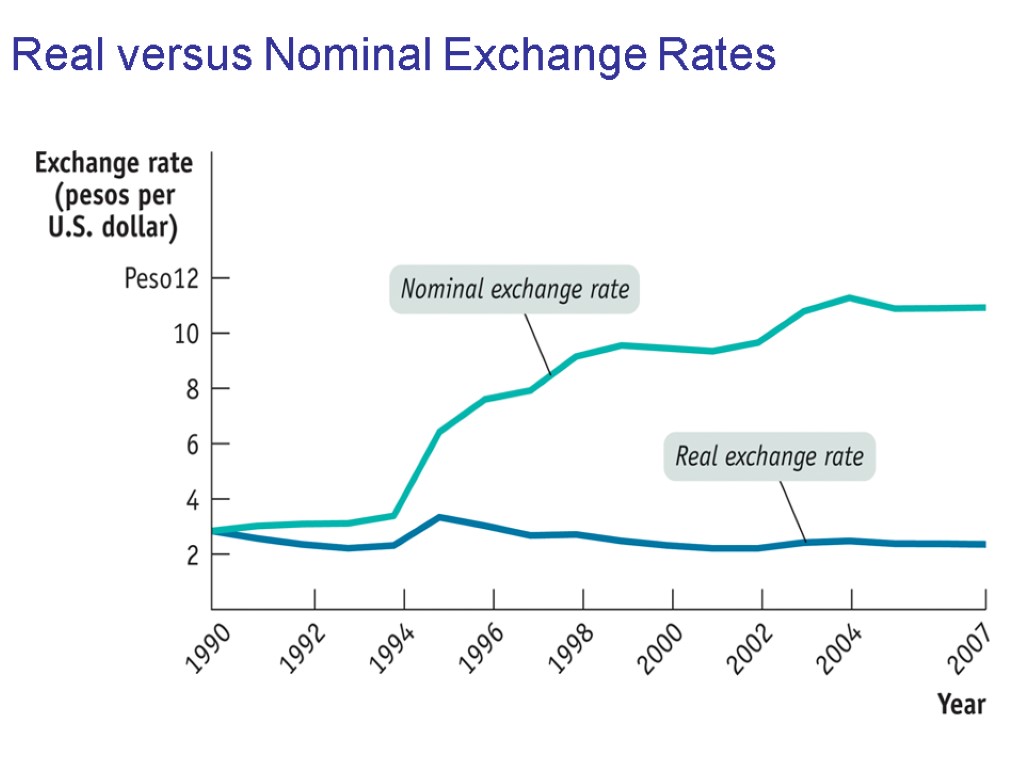
 Real Exchange Rates Real exchange rates are exchange rates adjusted for international differences in aggregate price levels. Real exchange rate = Mexican Pesos per U.S. dollars × PUS /PMex
 Real versus Nominal Exchange Rates
 Exchange Market Intervention
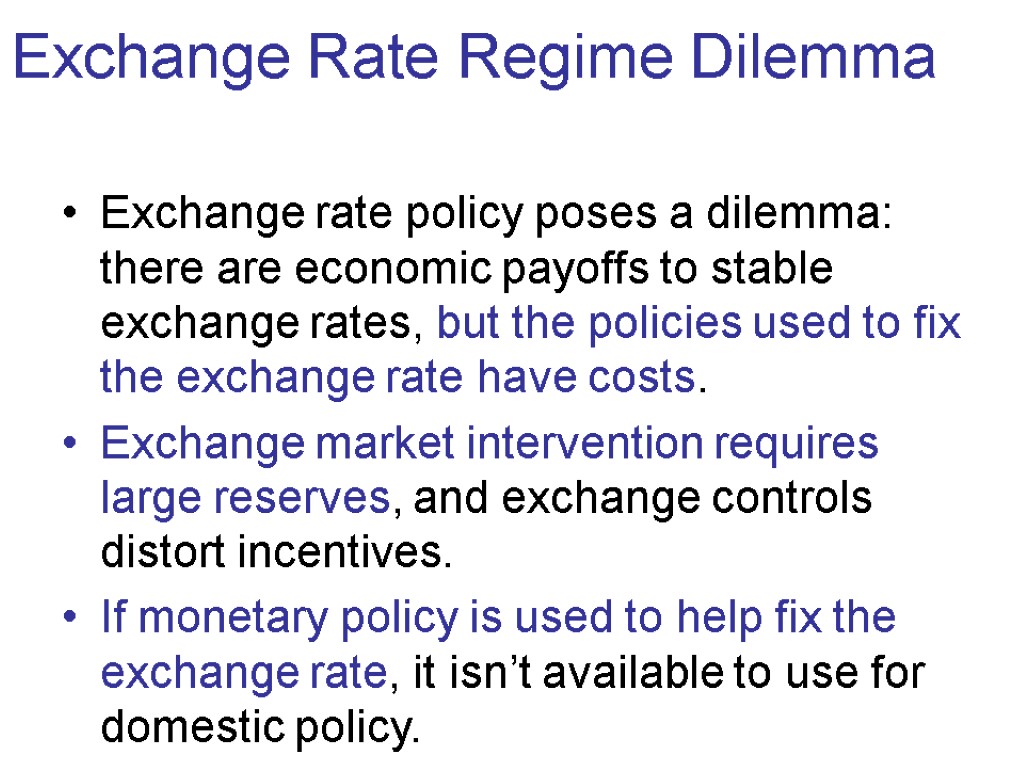
 Exchange Rate Regime Dilemma Exchange rate policy poses a dilemma: there are economic payoffs to stable exchange rates, but the policies used to fix the exchange rate have costs. Exchange market intervention requires large reserves, and exchange controls distort incentives. If monetary policy is used to help fix the exchange rate, it isn’t available to use for domestic policy.
 International Business Cycles The fact that one country’s imports are another country’s exports creates a link between the business cycle in different countries. Floating exchange rates, however, may reduce the strength of that link.

