Тема 4
 1. ІЧ-спектроскопія: основні положення 2. Характеристичні частоти 3. Аналіз промислових полімерів
 Роздільча здатність приладу
 Схема Фур`є спектрометра з інтерферометром Міхельсона
 Схема Фур`є спектрометра
 Фотоелектричний детектор
 Спектральні діапазони ІЧ-області
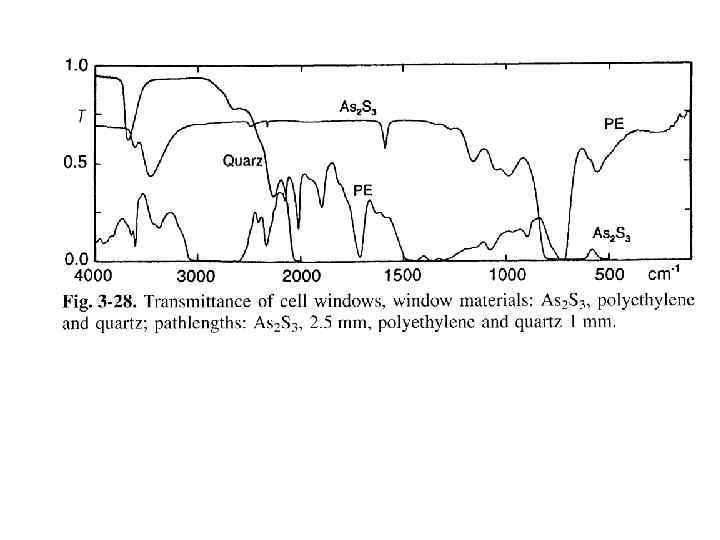
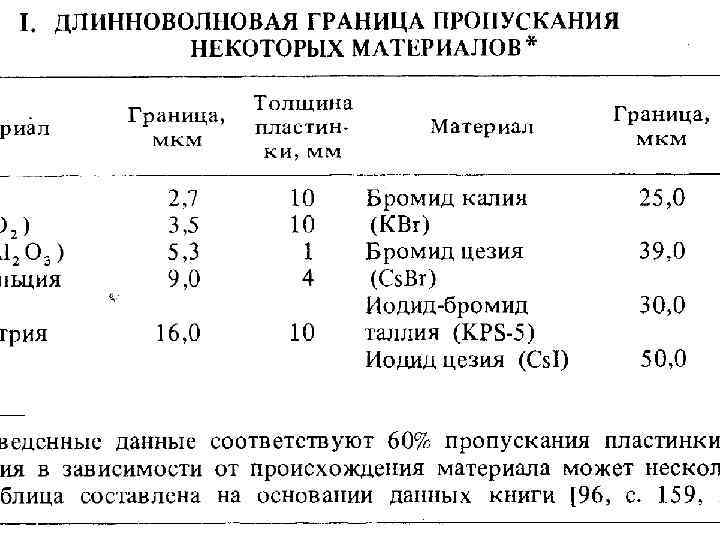
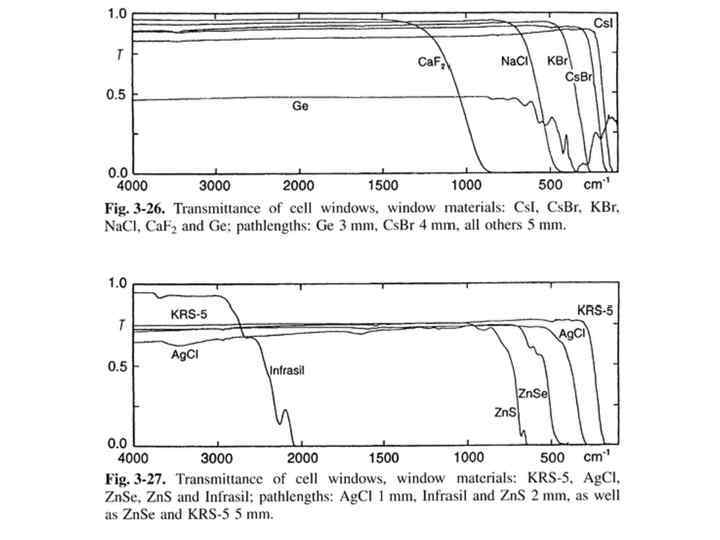
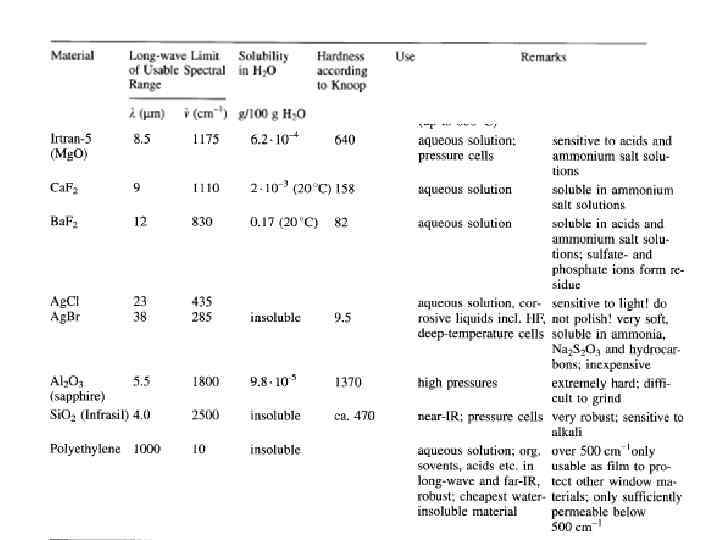
 Матеріали для виготовлення віконець
 Спектри розчинників для зняття ІЧ спектрів
 Спектри розчинників для зняття ІЧ спектрів
 Спектри розчинників
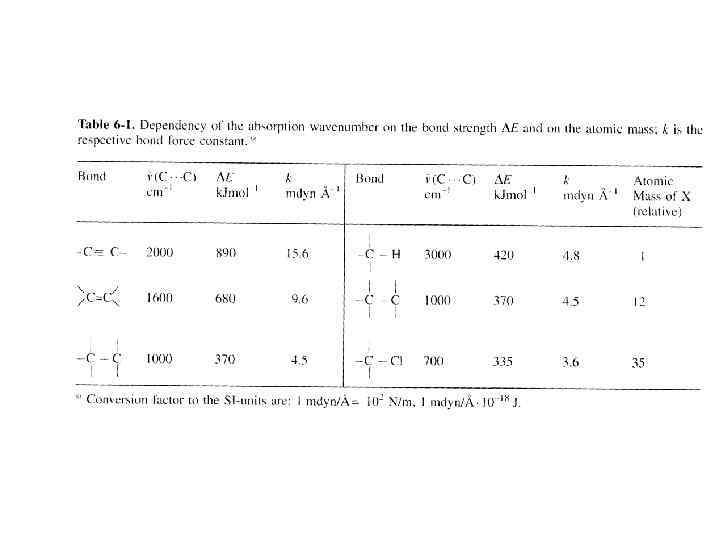
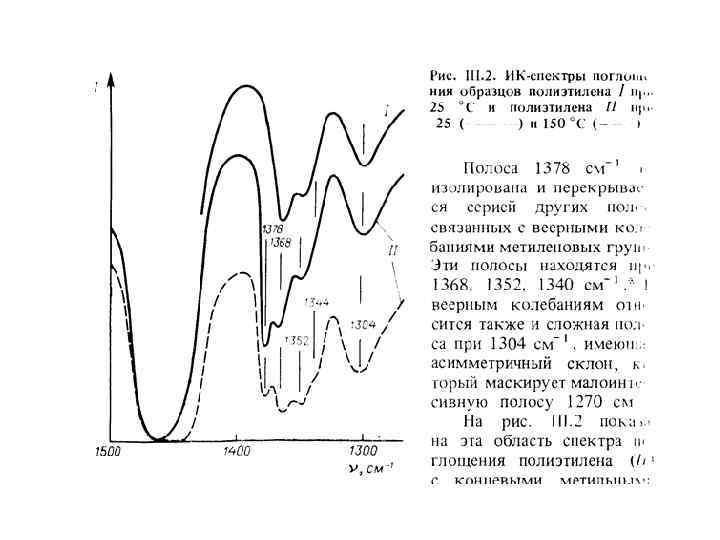
 Характеристичні частоти
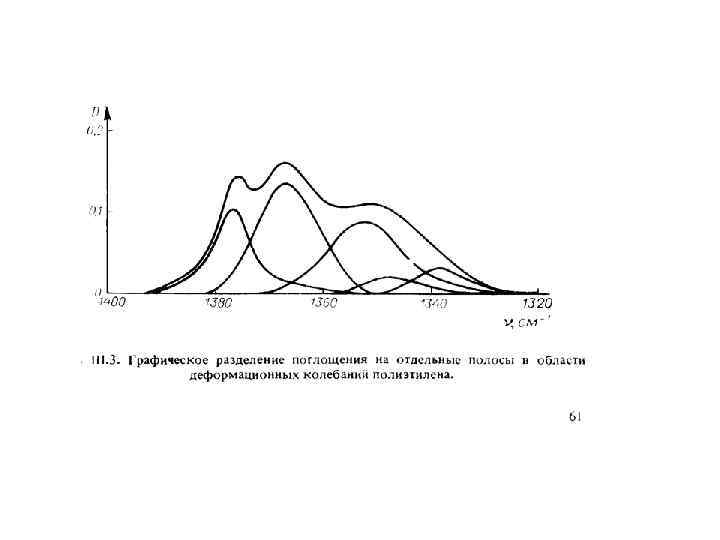
 Кількісний аналіз
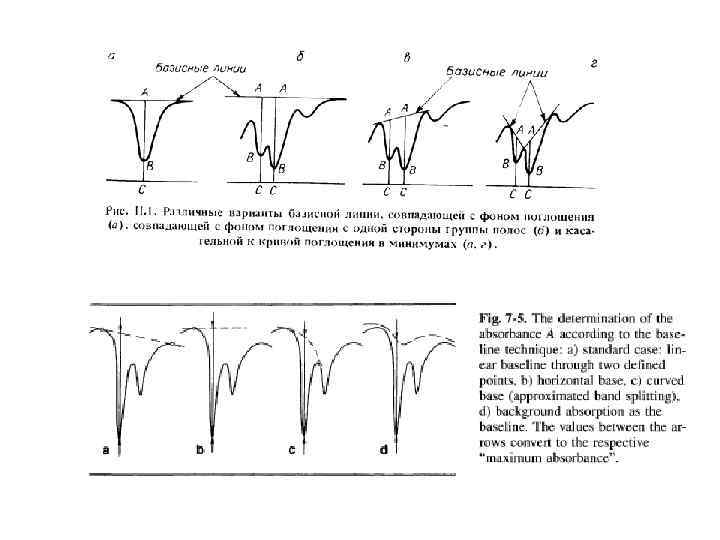
 Розрахунок поглинання А
 Побудова калібрувальної кривої
 Аналіз промислових полімерів
 Ідентифікація полімерів 1. Basic Identification: As previously noted, FTIR polymer identification of an unknown is done by matching the material’s infrared peaks, either transmittance or absorbance, to the peaks of similar infrared scans of known materials. The better the match, the higher the certainty for a correct identification of the unknown polymer. • • An FTIR spectral analysis can easily identify classes of polymers such as Nylons, Polyesters, Polypropylenes, Polycarbonates, Acetals, or Polyethylenes. However, an FTIR spectral scan alone should not be expected to identify the type of Nylon or Polyester, identify a Polypropylene or Acetal as a homopolymer or copolymer, or determine whether the Polyethylene is a high density or low density material. Further identification may be aided by DSC. Further identification may be aided by an Ash Test. http: //www. ptli. com/testlopedia/tests/FTIR-E 168 and. E 1252. asp Plastics Technology Laboratories
 Ідентифікація полімерів • Scans of Different Kinds of Polymers Totally different polymers have very different looking spectral scans. It is very obvious the infrared scan of Polyethylene (blue) does not look like the scan of Polycarbonate (red).
 Дослідження поверхні • • Internal Polymer Contamination: FTIR spectral subtractions are used to look for internal contamination in polymers. A computer program is used to subtract the peaks associated with the base polymer from the spectral scan and then an analysis of the remaining spectral scan is performed. The amount of contamination that can be detected depends on the spectral scans of the base polymer and the contaminant. Contamination involving materials with very different infrared spectra can usually be detected at a level of about 1 -2%. Contamination involving materials with similar infrared spectra may not show up at even the 10% level. Surface Contamination: Obvious surface contamination of polymers can be analyzed by normal reflective FTIR because the infrared beam only enters a few microns into the sample surface. Another method to look for a possible surface contamination involves a solvent wash of the sample’s surface. A solvent wash involves using a solvent that is nondestructive to the sample. A solvent wash of the sample’s surface is collected and evaporated to dryness on the FTIR reflective sample area. Once the solvent is evaporated off an FTIR analysis is performed on the solvent wash residue.
 could not be identified: they presented a") But thin plastic bags (< 200/ m) could not be identified: they presented a spectrum composed of interferences (see Fig. 2 a) due to the reflections of the IR beam between the two surfaces of the sample, together with a mixing of absorbance and reflectance structures. Also because of absorbance and reflectance mixing, the blown PS could not be identified either (see Fig. 2 b ).
But thin plastic bags (< 200/ m) could not be identified: they presented a spectrum composed of interferences (see Fig. 2 a) due to the reflections of the IR beam between the two surfaces of the sample, together with a mixing of absorbance and reflectance structures. Also because of absorbance and reflectance mixing, the blown PS could not be identified either (see Fig. 2 b ).
 нарушенного полного внутреннего отражения") ІЧ-Фур`є спектроскопія: приставки • Метод порушеного повного внутрішнього відбиття (ППВВ) нарушенного полного внутреннего отражения (НПВО) Отримують спектри непрозорих, забарвлених, наповнених сажею зразків; гум, гранул, волокон, темних та в`язких рідин • Метод дифузного відбиття: дослідження поверхні полімерних матеріалів Ю. А. Пентин, Л. В. Вилков “Физические методы исследования в химии” стр. 297 -300
ІЧ-Фур`є спектроскопія: приставки • Метод порушеного повного внутрішнього відбиття (ППВВ) нарушенного полного внутреннего отражения (НПВО) Отримують спектри непрозорих, забарвлених, наповнених сажею зразків; гум, гранул, волокон, темних та в`язких рідин • Метод дифузного відбиття: дослідження поверхні полімерних матеріалів Ю. А. Пентин, Л. В. Вилков “Физические методы исследования в химии” стр. 297 -300
 ІЧ-Фур`є спектроскопія: приставки n 1 n 21 – відносний показник заломлення При збільшенні кута настає момент, коли =900. Такий кут має назву критичний і sin =1, sin кр. = n 21. При всіх кр. заломлений промінь відсутній, R=I/I 0 =1 (Rкоефіцієнт відбиття, Iінтенсивність відбитого світла, I 0 - інтенсивність падаючого на границю розділу) і спостерігається повне внутрішнє відбиття (ПВВ).
 ІЧ-Фур`є спектроскопія: приставки Глибина проникнення світла при ПВВ в оптично менш щільне середовище dп має порядок довжини хвилі і залежить від кута падіння та відносного показника заломлення: де 1 - довжина хвилі випромінювання в оптично більш щільному середовищі Типові об’єкти дослідження методом ППВВ мають показники заломлення в межах 1, 35 -1, 55.
 ІЧ-Фур`є спектроскопія: приставки
 ІЧ-Фур`є спектроскопія: приставки
 Поляризаційна ІЧ- спектроскопія R- діхроїчне відношення f – ступінь орієнтації полімера Ю. А. Пентин, Л. В. Вилков “Физические методы исследования в химии” стр. 285 -286
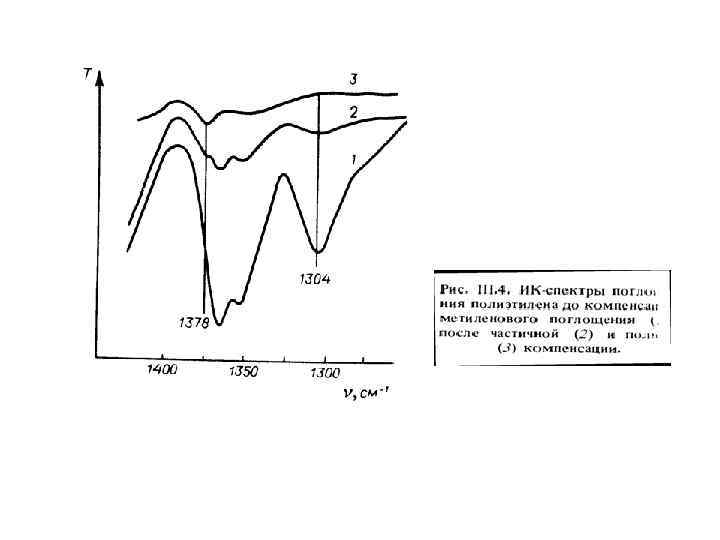
 Визначення ступеня розгалуженості поліолефінів
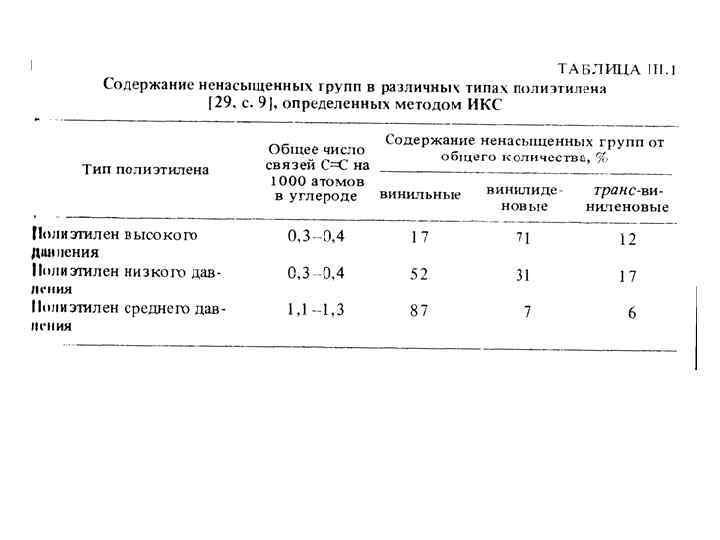
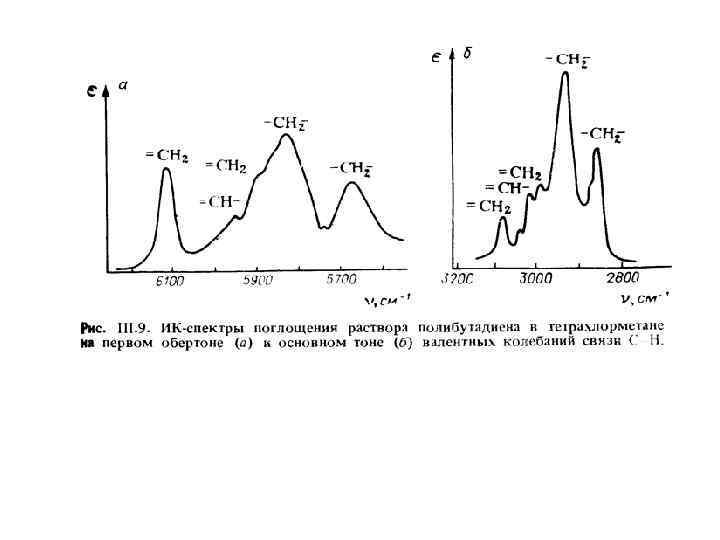
 Визначення ступеня ненасиченості поліолефінів
 Визначення ступеня ненасиченості поліолефінів
") Бічні відгалуження – алкільні групи! (бутильна 895 cm-1)
Бічні відгалуження – алкільні групи! (бутильна 895 cm-1)
 967 cm-1 910 cm-1 740 cm-1
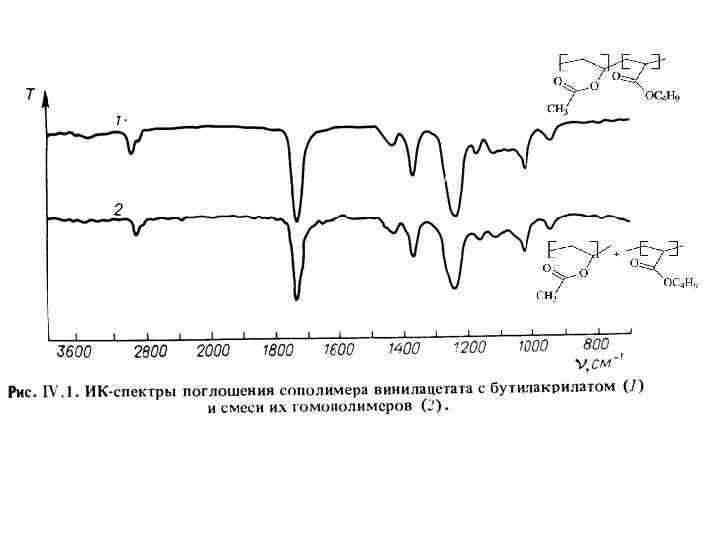
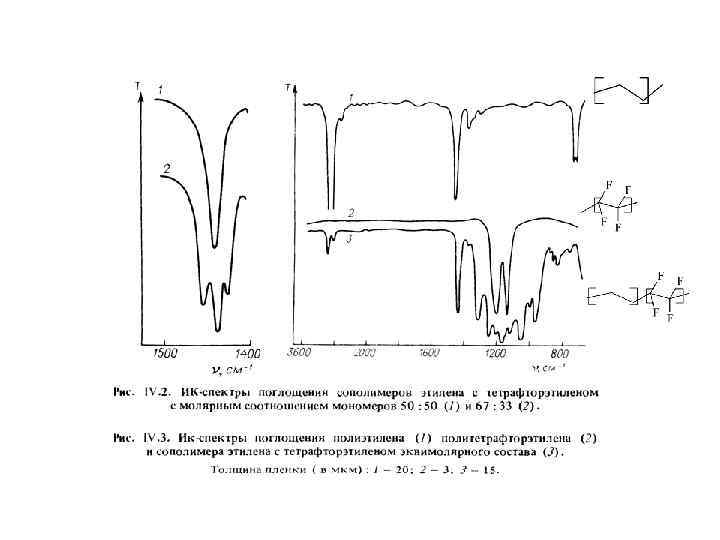
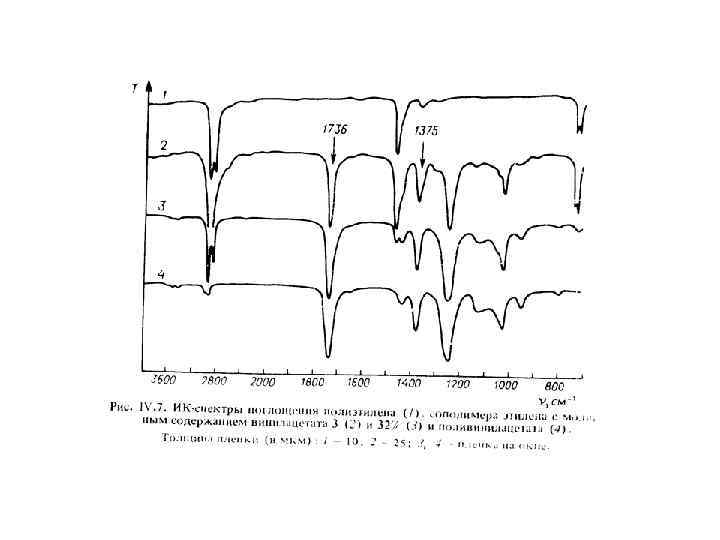
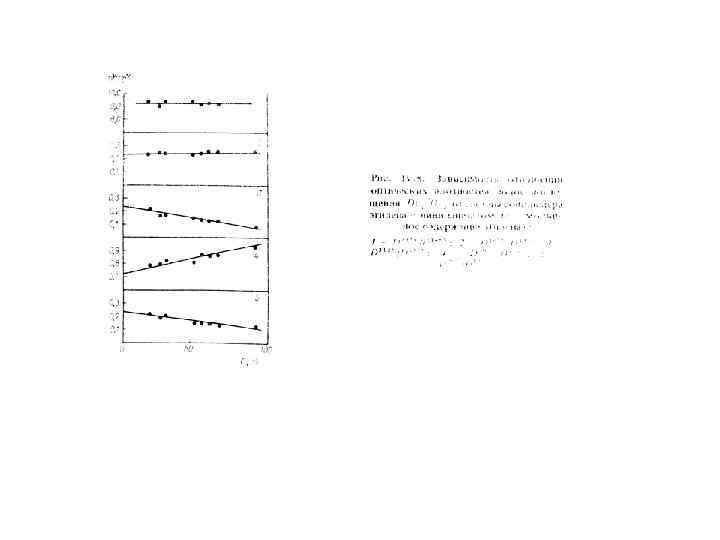
 Аналіз кополімерів