6a854f89b06518b3e5689a8be6a2f45d.ppt
- Количество слайдов: 85
TAU Performance Toolkit (WOMPAT Open. MP Lab Sessions) Sameer Shende, Allen D. Malony, Robert Bell University of Oregon {sameer, malony, bertie}@cs. uoregon. edu
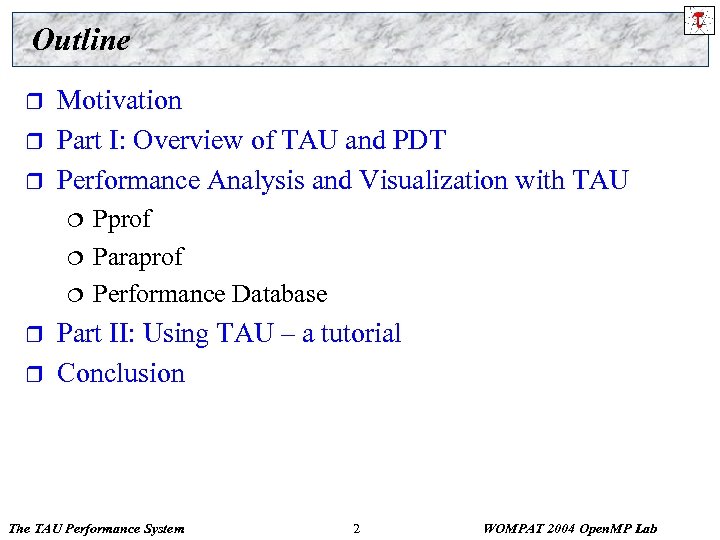
Outline r r r Motivation Part I: Overview of TAU and PDT Performance Analysis and Visualization with TAU ¦ ¦ ¦ r r Pprof Paraprof Performance Database Part II: Using TAU – a tutorial Conclusion The TAU Performance System 2 WOMPAT 2004 Open. MP Lab
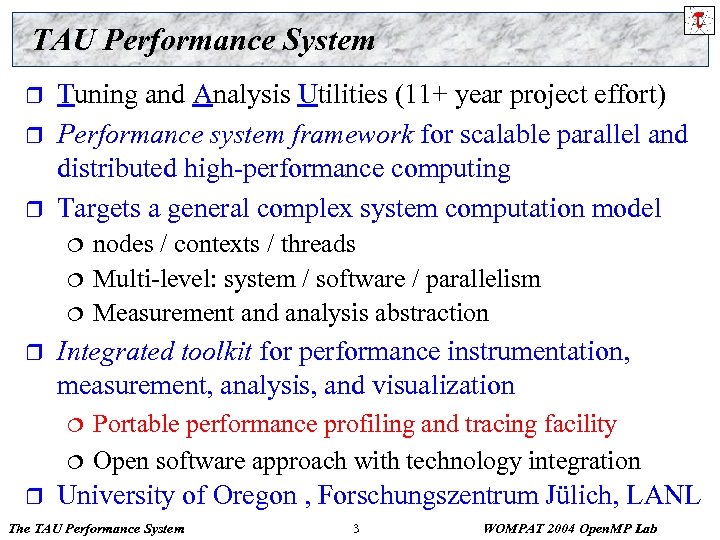
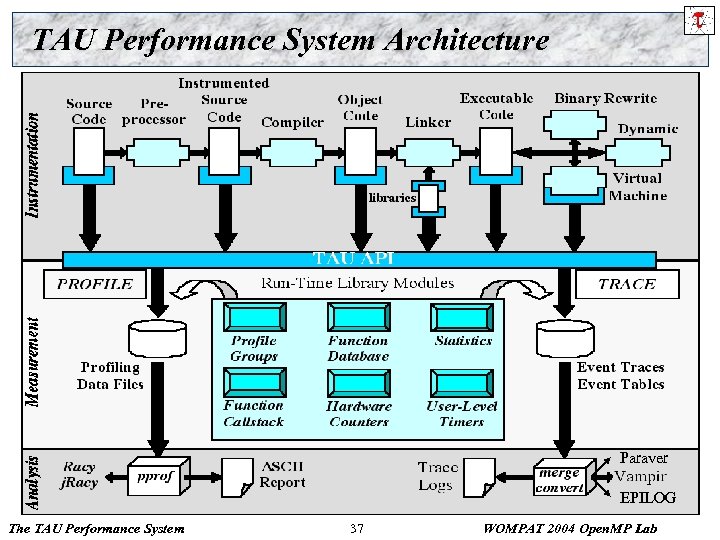
TAU Performance System r r r Tuning and Analysis Utilities (11+ year project effort) Performance system framework for scalable parallel and distributed high-performance computing Targets a general complex system computation model ¦ ¦ ¦ r Integrated toolkit for performance instrumentation, measurement, analysis, and visualization ¦ ¦ r nodes / contexts / threads Multi-level: system / software / parallelism Measurement and analysis abstraction Portable performance profiling and tracing facility Open software approach with technology integration University of Oregon , Forschungszentrum Jülich, LANL The TAU Performance System 3 WOMPAT 2004 Open. MP Lab
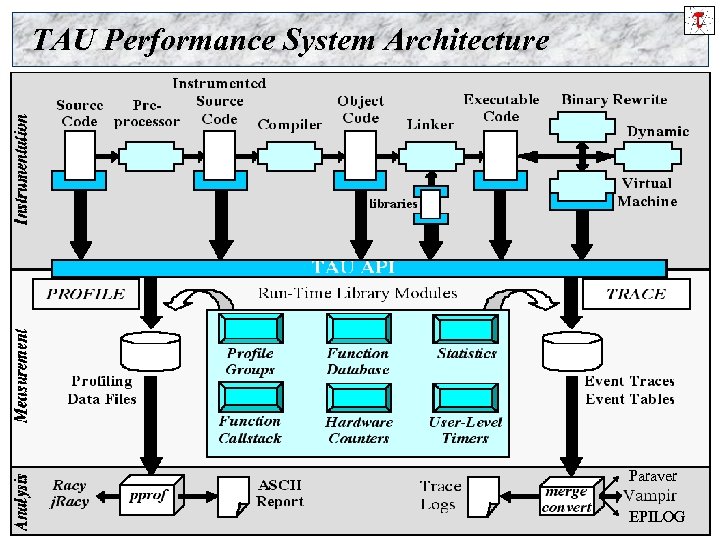
TAU Performance System Architecture Paraver The TAU Performance System 4 EPILOG WOMPAT 2004 Open. MP Lab
Strategies for Empirical Performance Evaluation r Empirical performance evaluation as a series of performance experiments ¦ ¦ Experiment trials describing instrumentation and measurement requirements Where/When/How axes of empirical performance space Ø where are performance measurements made in program l routines, loops, statements… Ø when is performance instrumentation done l compile-time, while pre-processing, runtime… Ø how are performance measurement/instrumentation chosen l profiling with hw counters, tracing, callpath profiling… The TAU Performance System 5 WOMPAT 2004 Open. MP Lab
TAU Instrumentation Approach r Support for standard program events ¦ ¦ ¦ r Support for user-defined events ¦ ¦ ¦ r r r Routines Classes and templates Statement-level blocks Begin/End events (“user-defined timers”) Atomic events (e. g. , size of memory allocated/freed) Selection of event statistics Support definition of “semantic” entities for mapping Support for event groups Instrumentation optimization The TAU Performance System 6 WOMPAT 2004 Open. MP Lab
TAU Instrumentation r Flexible instrumentation mechanisms at multiple levels ¦ Source code Ø manual Ø automatic C, C++, F 77/90/95 (Program Database Toolkit (PDT)) l Open. MP (directive rewriting (Opari), POMP spec) l ¦ Object code Ø pre-instrumented libraries (e. g. , MPI using PMPI) Ø statically-linked and dynamically-linked ¦ Executable code Ø dynamic instrumentation (pre-execution) (Dyn. Inst. API) Ø virtual machine instrumentation (e. g. , Java using JVMPI) The TAU Performance System 7 WOMPAT 2004 Open. MP Lab
Multi-Level Instrumentation r Targets common measurement interface ¦ r Multiple instrumentation interfaces ¦ r Utilizes instrumentation knowledge between levels Selective instrumentation ¦ r Simultaneously active Information sharing between interfaces ¦ r TAU API Available at each level Cross-level selection Targets a common performance model Presents a unified view of execution ¦ Consistent performance events The TAU Performance System 8 WOMPAT 2004 Open. MP Lab
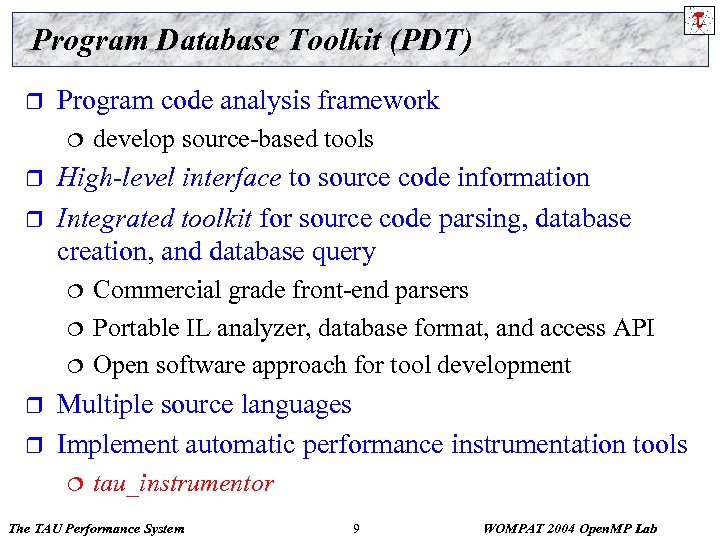
Program Database Toolkit (PDT) r Program code analysis framework ¦ r r High-level interface to source code information Integrated toolkit for source code parsing, database creation, and database query ¦ ¦ ¦ r r develop source-based tools Commercial grade front-end parsers Portable IL analyzer, database format, and access API Open software approach for tool development Multiple source languages Implement automatic performance instrumentation tools ¦ tau_instrumentor The TAU Performance System 9 WOMPAT 2004 Open. MP Lab
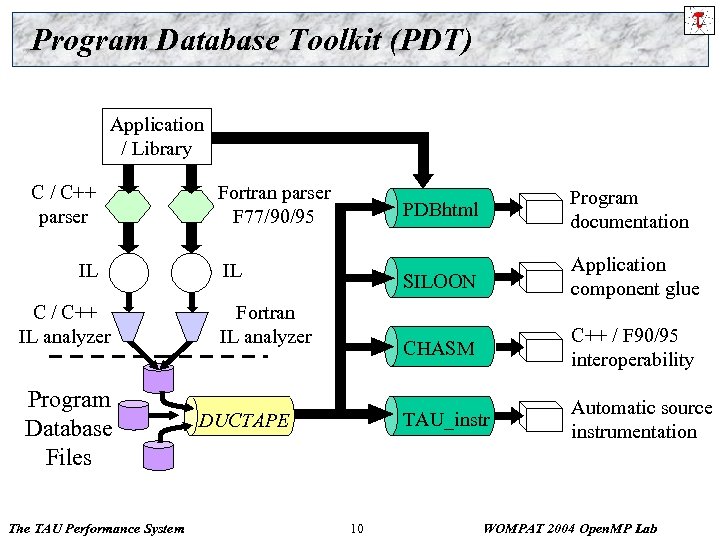
Program Database Toolkit (PDT) Application / Library C / C++ parser IL C / C++ IL analyzer Program Database Files The TAU Performance System Fortran parser F 77/90/95 PDBhtml SILOON DUCTAPE 10 C++ / F 90/95 interoperability TAU_instr Fortran IL analyzer Application component glue CHASM IL Program documentation Automatic source instrumentation WOMPAT 2004 Open. MP Lab
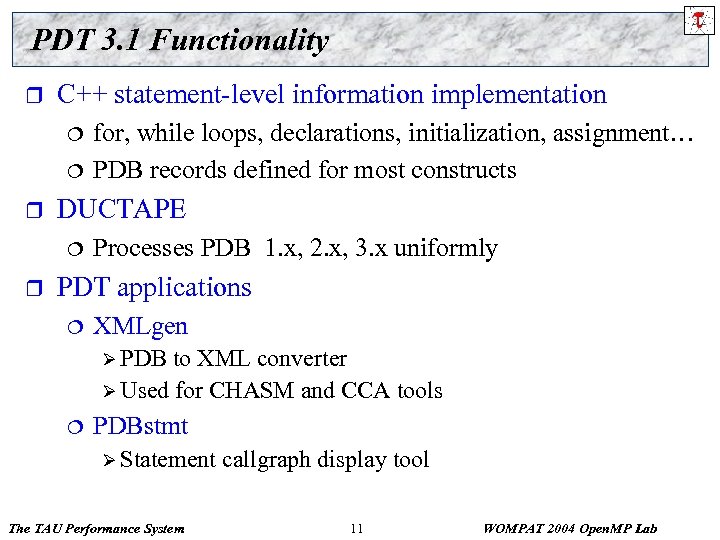
PDT 3. 1 Functionality r C++ statement-level information implementation ¦ ¦ r DUCTAPE ¦ r for, while loops, declarations, initialization, assignment… PDB records defined for most constructs Processes PDB 1. x, 2. x, 3. x uniformly PDT applications ¦ XMLgen Ø PDB to XML converter Ø Used for CHASM and CCA tools ¦ PDBstmt Ø Statement The TAU Performance System callgraph display tool 11 WOMPAT 2004 Open. MP Lab
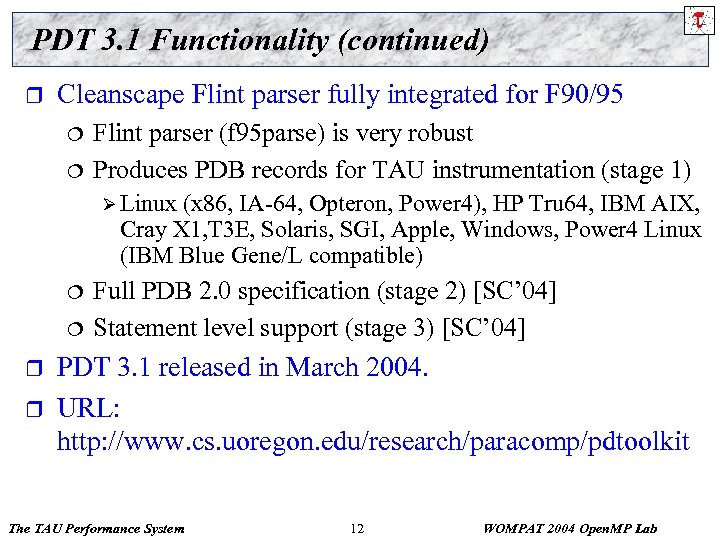
PDT 3. 1 Functionality (continued) r Cleanscape Flint parser fully integrated for F 90/95 ¦ ¦ Flint parser (f 95 parse) is very robust Produces PDB records for TAU instrumentation (stage 1) Ø Linux (x 86, IA-64, Opteron, Power 4), HP Tru 64, IBM AIX, Cray X 1, T 3 E, Solaris, SGI, Apple, Windows, Power 4 Linux (IBM Blue Gene/L compatible) ¦ ¦ r r Full PDB 2. 0 specification (stage 2) [SC’ 04] Statement level support (stage 3) [SC’ 04] PDT 3. 1 released in March 2004. URL: http: //www. cs. uoregon. edu/research/paracomp/pdtoolkit The TAU Performance System 12 WOMPAT 2004 Open. MP Lab
TAU Performance Measurement r r r TAU supports profiling and tracing measurement Robust timing and hardware performance support using PAPI Support for online performance monitoring ¦ ¦ r Extension of TAU measurement for multiple counters ¦ ¦ r r Profile and trace performance data export to file system Selective exporting Creation of user-defined TAU counters Access to system-level metrics Support for callpath measurement Integration with system-level performance data ¦ Linux MAGNET/MUSE (Wu Feng, LANL) The TAU Performance System 13 WOMPAT 2004 Open. MP Lab
TAU Measurement r Performance information ¦ ¦ Performance events High-resolution timer library (real-time / virtual clocks) General software counter library (user-defined events) Hardware performance counters Ø PAPI (Performance API) (UTK, Ptools Consortium) Ø consistent, portable API r Organization ¦ ¦ ¦ Node, context, thread levels Profile groups for collective events (runtime selective) Performance data mapping between software levels The TAU Performance System 14 WOMPAT 2004 Open. MP Lab
TAU Measurement Options r Parallel profiling ¦ ¦ ¦ r Function-level, block-level, statement-level Supports user-defined events TAU parallel profile data stored during execution Hardware counts values Support for multiple counters Support for callgraph and callpath profiling Tracing ¦ ¦ ¦ All profile-level events Inter-process communication events Trace merging and format conversion The TAU Performance System 15 WOMPAT 2004 Open. MP Lab
Grouping Performance Data in TAU r Profile Groups ¦ ¦ A group of related routines forms a profile group Statically defined Ø TAU_DEFAULT, TAU_IO, … ¦ TAU_USER[1 -5], TAU_MESSAGE, Dynamically defined Ø group name based on string, such as “adlib” or “particles” Ø runtime lookup in a map to get unique group identifier Ø uses tau_instrumentor to instrument ¦ ¦ Ability to change group names at runtime Group-based instrumentation and measurement control The TAU Performance System 16 WOMPAT 2004 Open. MP Lab
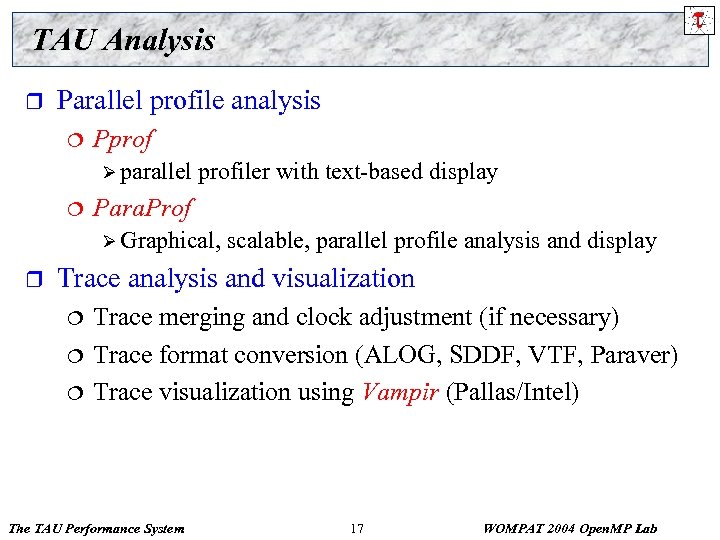
TAU Analysis r Parallel profile analysis ¦ Pprof Ø parallel ¦ profiler with text-based display Para. Prof Ø Graphical, r scalable, parallel profile analysis and display Trace analysis and visualization ¦ ¦ ¦ Trace merging and clock adjustment (if necessary) Trace format conversion (ALOG, SDDF, VTF, Paraver) Trace visualization using Vampir (Pallas/Intel) The TAU Performance System 17 WOMPAT 2004 Open. MP Lab
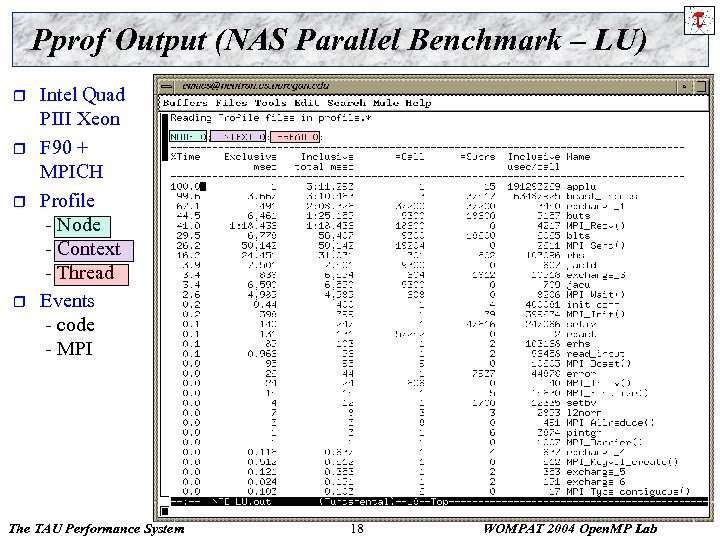
Pprof Output (NAS Parallel Benchmark – LU) r r Intel Quad PIII Xeon F 90 + MPICH Profile - Node - Context - Thread Events - code - MPI The TAU Performance System 18 WOMPAT 2004 Open. MP Lab
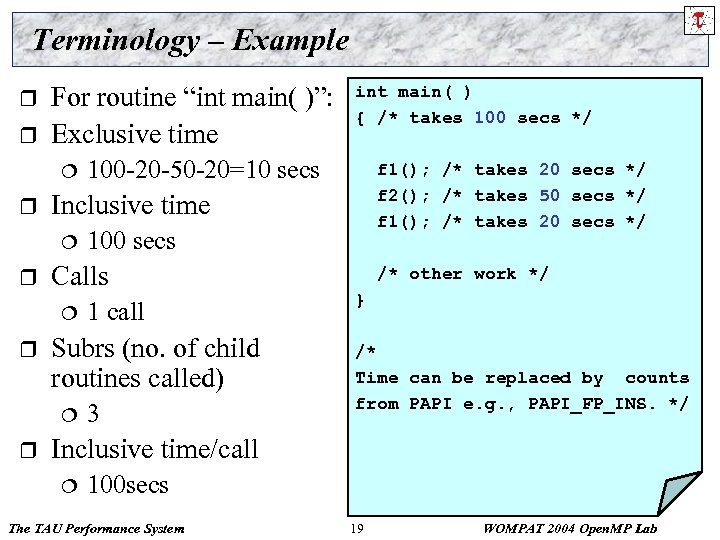
Terminology – Example r r For routine “int main( )”: Exclusive time ¦ r Inclusive time ¦ r 1 call Subrs (no. of child routines called) ¦ r 100 secs Calls ¦ r 100 -20 -50 -20=10 secs 3 int main( ) { /* takes 100 secs */ f 1(); /* takes 20 secs */ f 2(); /* takes 50 secs */ f 1(); /* takes 20 secs */ /* other work */ } /* Time can be replaced by counts from PAPI e. g. , PAPI_FP_INS. */ Inclusive time/call ¦ 100 secs The TAU Performance System 19 WOMPAT 2004 Open. MP Lab
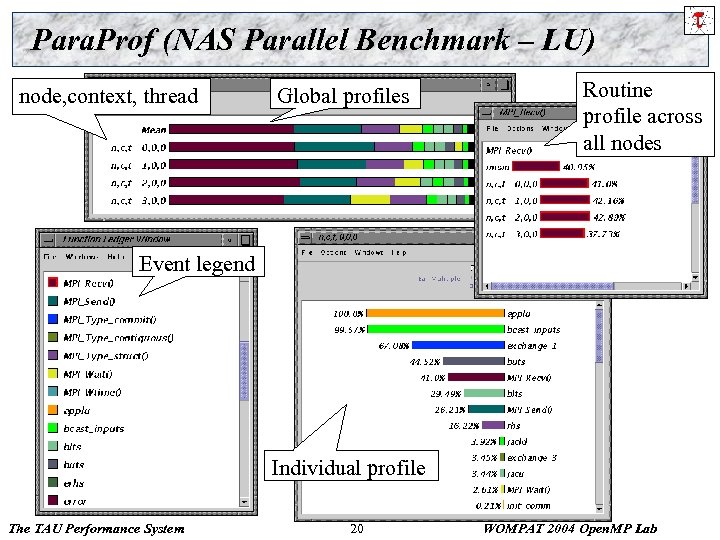
Para. Prof (NAS Parallel Benchmark – LU) node, context, thread Global profiles Routine profile across all nodes Event legend Individual profile The TAU Performance System 20 WOMPAT 2004 Open. MP Lab
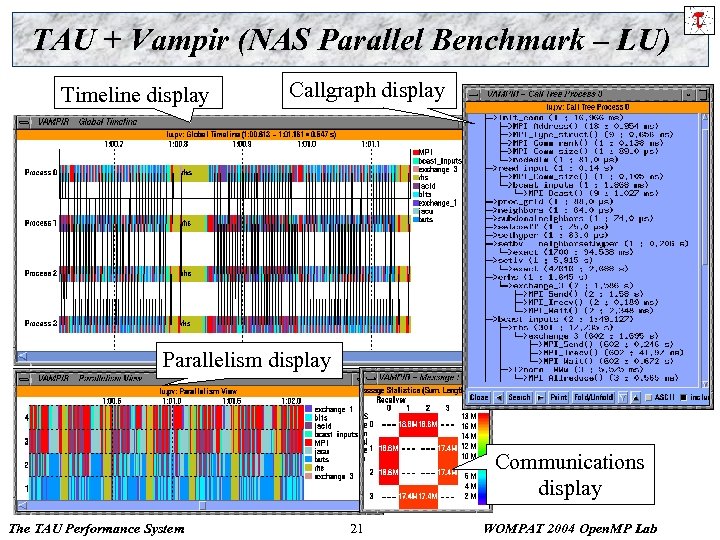
TAU + Vampir (NAS Parallel Benchmark – LU) Timeline display Callgraph display Parallelism display Communications display The TAU Performance System 21 WOMPAT 2004 Open. MP Lab
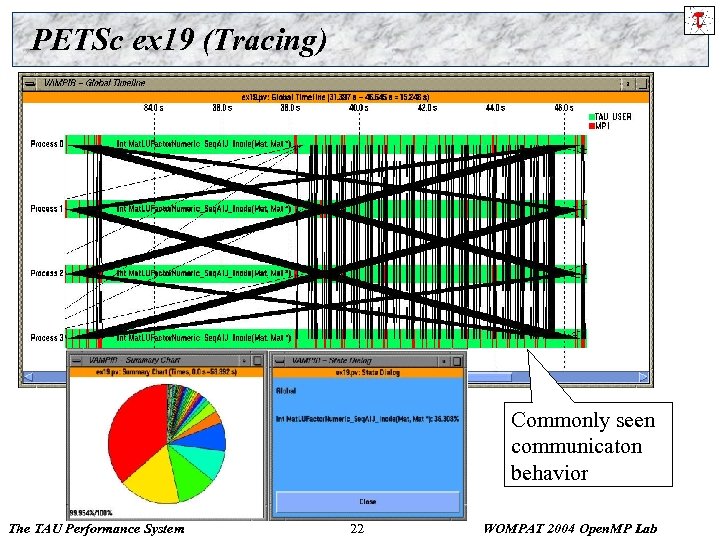
PETSc ex 19 (Tracing) Commonly seen communicaton behavior The TAU Performance System 22 WOMPAT 2004 Open. MP Lab
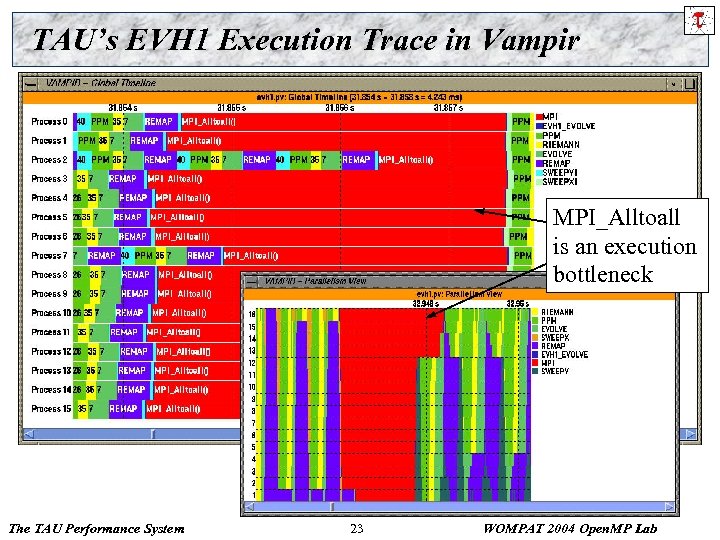
TAU’s EVH 1 Execution Trace in Vampir MPI_Alltoall is an execution bottleneck The TAU Performance System 23 WOMPAT 2004 Open. MP Lab
Performance Analysis and Visualization r r Analysis of parallel profile and trace measurement Parallel profile analysis ¦ ¦ r r Performance database framework (Perf. DBF) Parallel trace analysis ¦ ¦ r Para. Profile generation from trace data Translation to VTF 3. 0 and EPILOG Integration with VNG (Technical University of Dresden) Online parallel analysis and visualization The TAU Performance System 24 WOMPAT 2004 Open. MP Lab
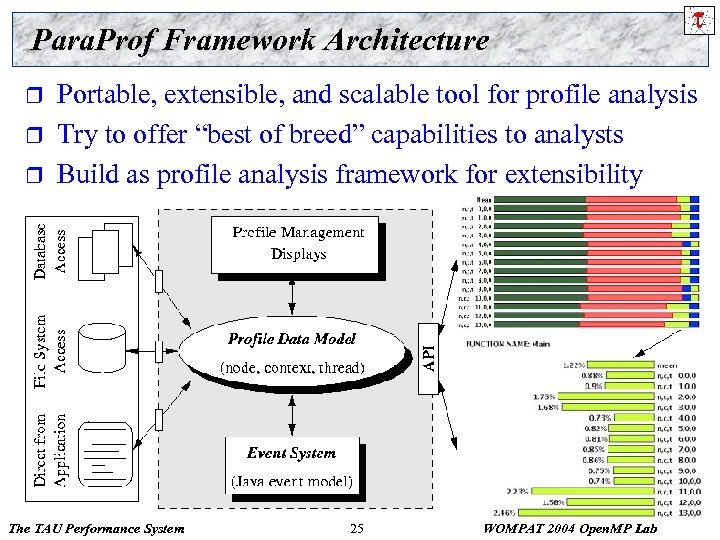
Para. Prof Framework Architecture r r r Portable, extensible, and scalable tool for profile analysis Try to offer “best of breed” capabilities to analysts Build as profile analysis framework for extensibility The TAU Performance System 25 WOMPAT 2004 Open. MP Lab
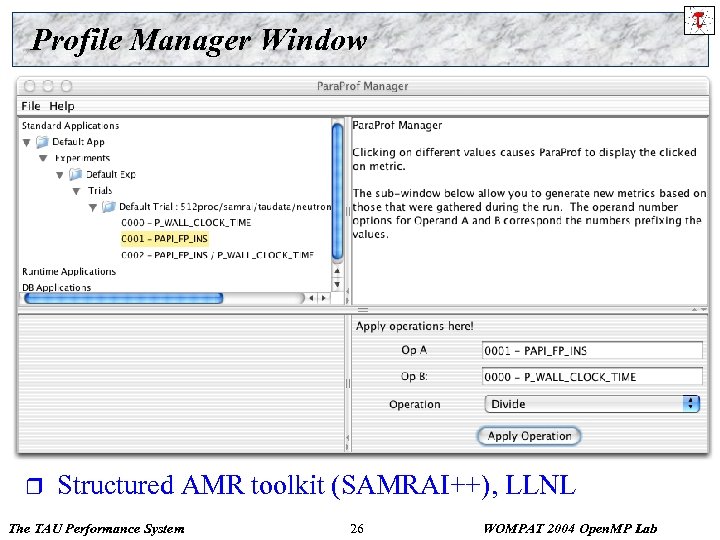
Profile Manager Window r Structured AMR toolkit (SAMRAI++), LLNL The TAU Performance System 26 WOMPAT 2004 Open. MP Lab
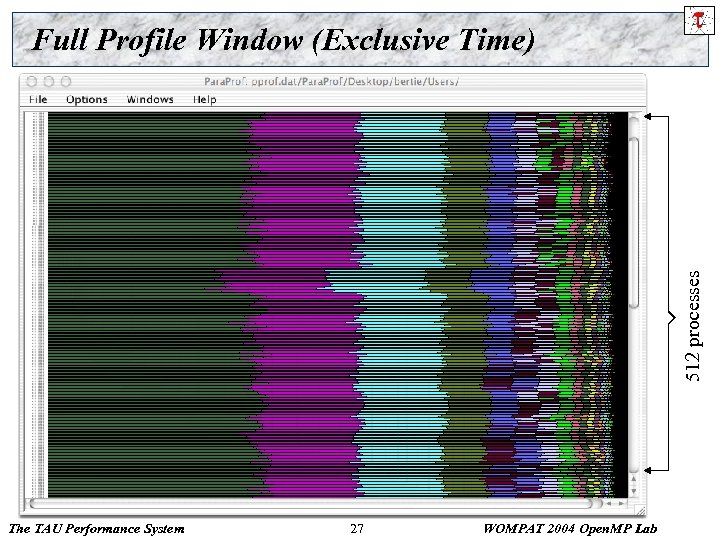
512 processes Full Profile Window (Exclusive Time) The TAU Performance System 27 WOMPAT 2004 Open. MP Lab
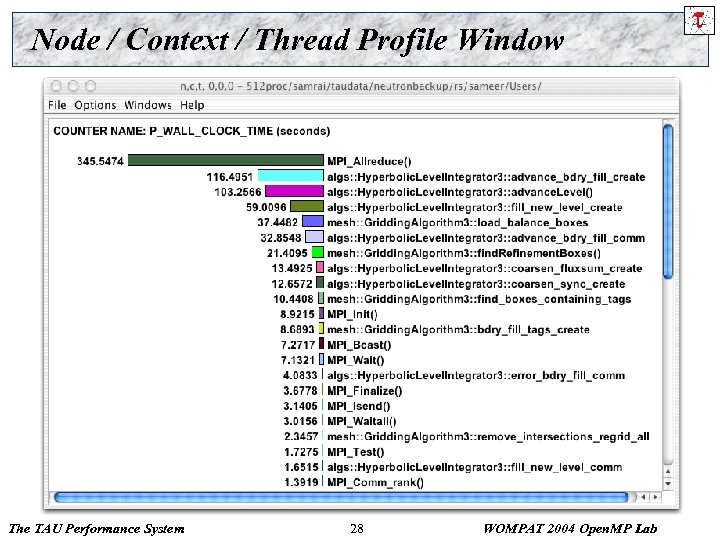
Node / Context / Thread Profile Window The TAU Performance System 28 WOMPAT 2004 Open. MP Lab
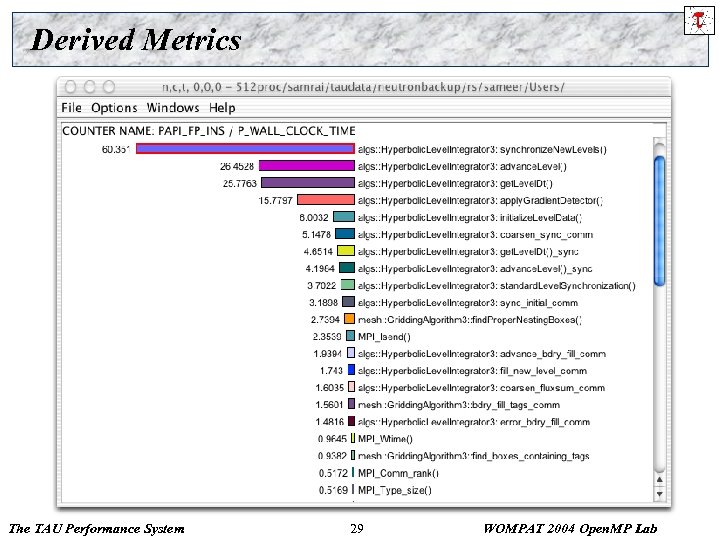
Derived Metrics The TAU Performance System 29 WOMPAT 2004 Open. MP Lab
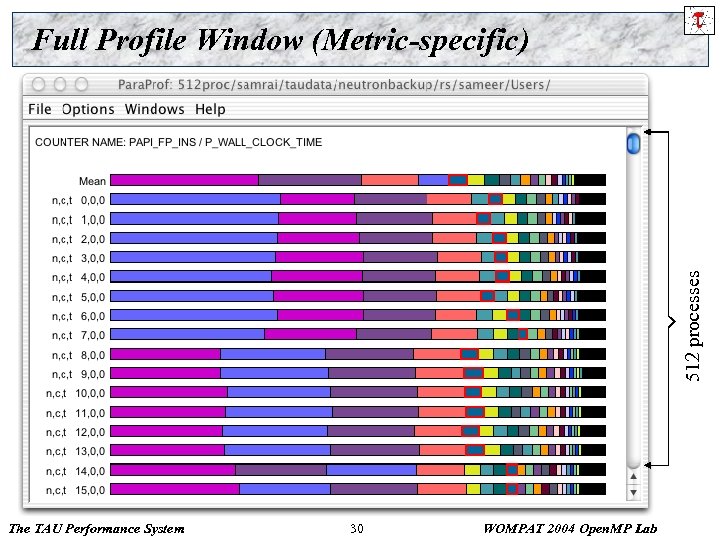
512 processes Full Profile Window (Metric-specific) The TAU Performance System 30 WOMPAT 2004 Open. MP Lab
Para. Prof Enhancements r r r Readers completely separated from the GUI Access to performance profile database Profile translators ¦ r Callgraph display ¦ r r r prof/gprof style with hyperlinks Integration of 3 D performance plotting library Scalable profile analysis ¦ r mpi. P, papiprof, dynaprof Statistical histograms, cluster analysis, … Generalized programmable analysis engine Cross-experiment analysis The TAU Performance System 31 WOMPAT 2004 Open. MP Lab
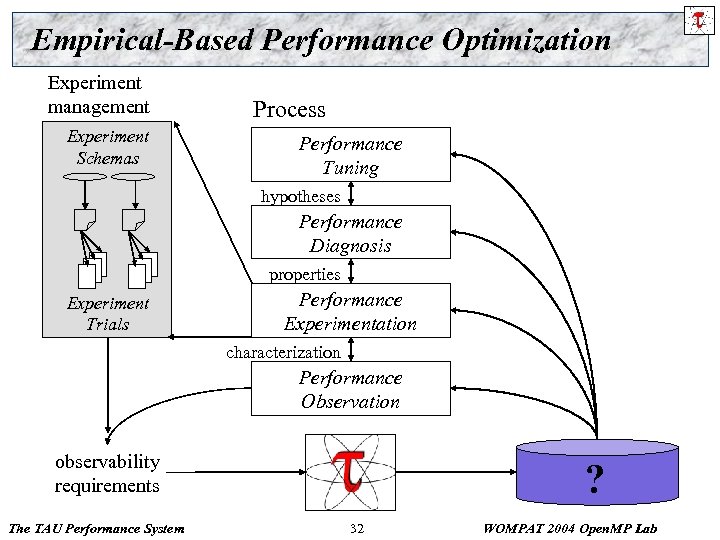
Empirical-Based Performance Optimization Experiment management Experiment Schemas Process Performance Tuning hypotheses Performance Diagnosis properties Experiment Trials Performance Experimentation characterization Performance Observation observability requirements The TAU Performance System ? 32 WOMPAT 2004 Open. MP Lab
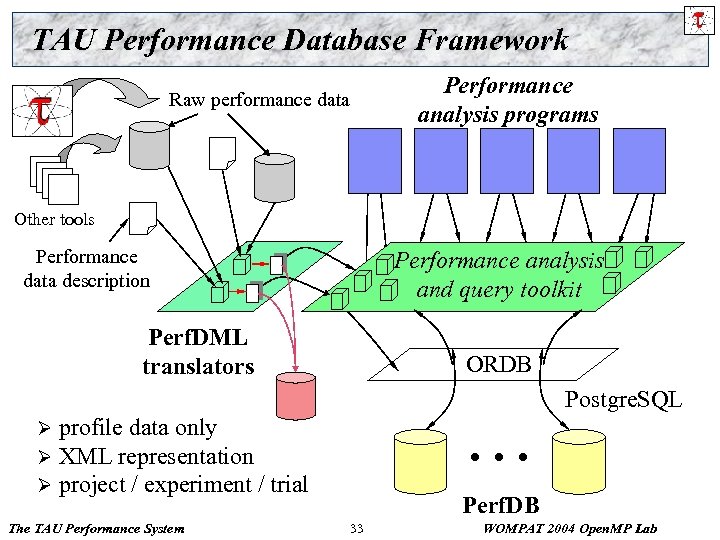
TAU Performance Database Framework Raw performance data Performance analysis programs Other tools Performance data description Performance analysis and query toolkit Perf. DML translators ORDB Postgre. SQL Ø Ø Ø profile data only XML representation project / experiment / trial The TAU Performance System . . . Perf. DB 33 WOMPAT 2004 Open. MP Lab
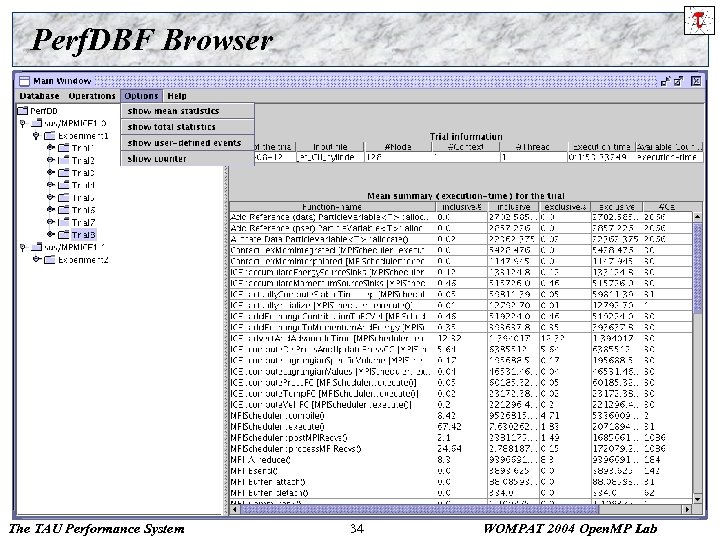
Perf. DBF Browser The TAU Performance System 34 WOMPAT 2004 Open. MP Lab
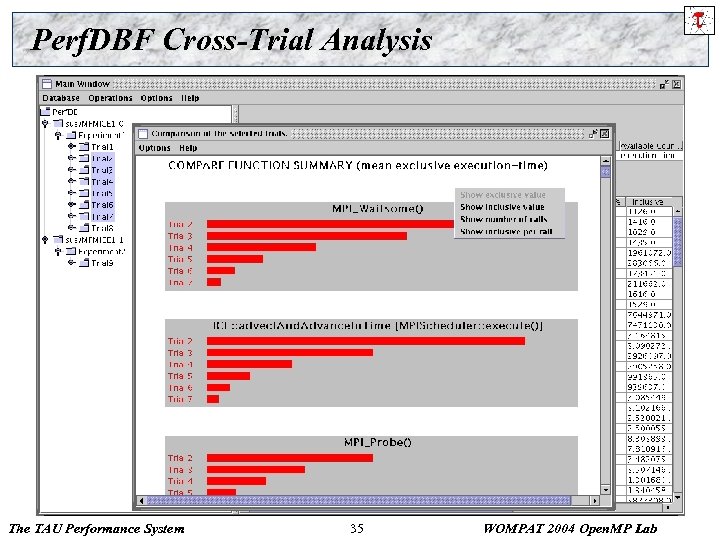
Perf. DBF Cross-Trial Analysis The TAU Performance System 35 WOMPAT 2004 Open. MP Lab
Using TAU – A tutorial r r Configuration Instrumentation ¦ ¦ ¦ Manual PDT- Source rewriting for C, C++, F 77/90/95 MPI – Wrapper interposition library Open. MP – Directive rewriting Binary Instrumentation Ø Dyninst. API – Runtime/Rewriting binary Ø Java – Runtime instrumentation Ø Python – Runtime instrumentation r r Measurement Performance Analysis The TAU Performance System 36 WOMPAT 2004 Open. MP Lab
TAU Performance System Architecture Paraver EPILOG The TAU Performance System 37 WOMPAT 2004 Open. MP Lab
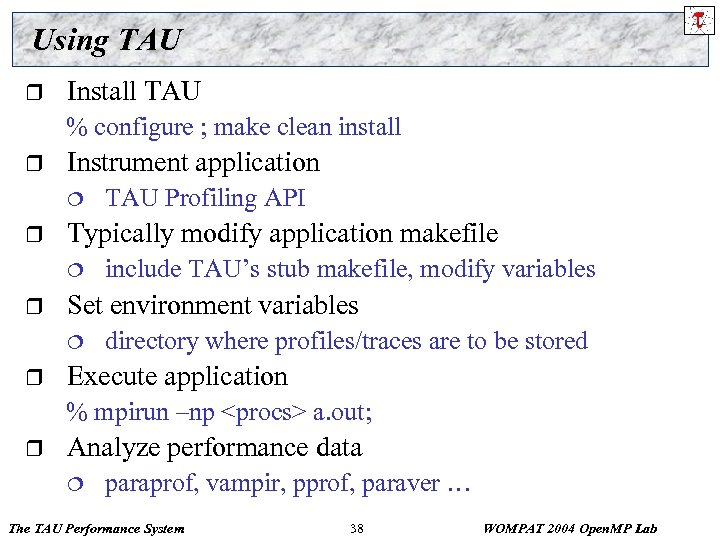
Using TAU r Install TAU % configure ; make clean install r Instrument application ¦ r Typically modify application makefile ¦ r include TAU’s stub makefile, modify variables Set environment variables ¦ r TAU Profiling API directory where profiles/traces are to be stored Execute application % mpirun –np <procs> a. out; r Analyze performance data ¦ paraprof, vampir, pprof, paraver … The TAU Performance System 38 WOMPAT 2004 Open. MP Lab
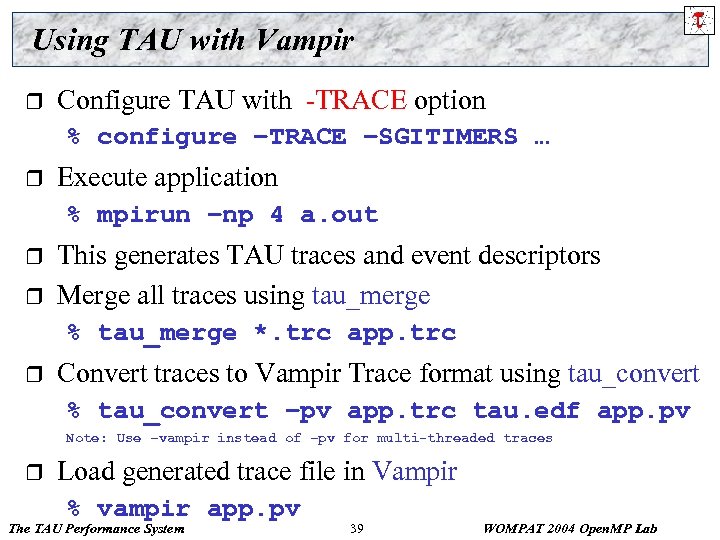
Using TAU with Vampir r Configure TAU with -TRACE option % configure –TRACE –SGITIMERS … r Execute application % mpirun –np 4 a. out r r This generates TAU traces and event descriptors Merge all traces using tau_merge % tau_merge *. trc app. trc r Convert traces to Vampir Trace format using tau_convert % tau_convert –pv app. trc tau. edf app. pv Note: Use –vampir instead of –pv for multi-threaded traces r Load generated trace file in Vampir % vampir app. pv The TAU Performance System 39 WOMPAT 2004 Open. MP Lab
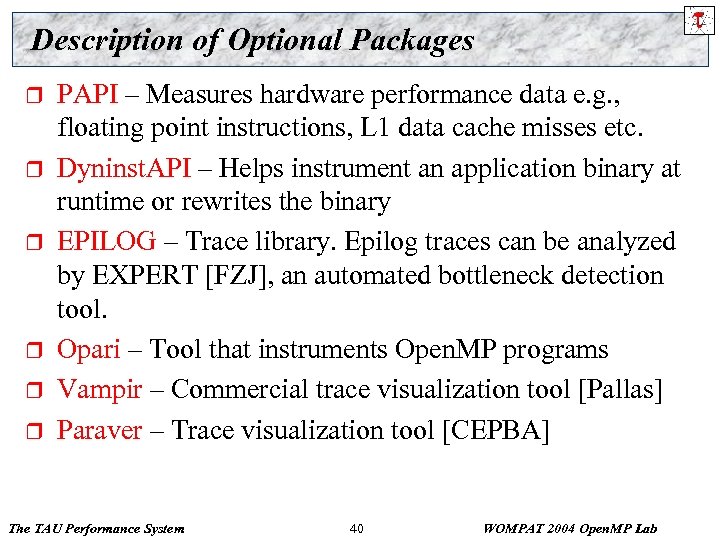
Description of Optional Packages r r r PAPI – Measures hardware performance data e. g. , floating point instructions, L 1 data cache misses etc. Dyninst. API – Helps instrument an application binary at runtime or rewrites the binary EPILOG – Trace library. Epilog traces can be analyzed by EXPERT [FZJ], an automated bottleneck detection tool. Opari – Tool that instruments Open. MP programs Vampir – Commercial trace visualization tool [Pallas] Paraver – Trace visualization tool [CEPBA] The TAU Performance System 40 WOMPAT 2004 Open. MP Lab
![TAU Measurement System Configuration r configure [OPTIONS] ¦ ¦ ¦ {-c++=<CC>, -cc=<cc>} Specify C++ TAU Measurement System Configuration r configure [OPTIONS] ¦ ¦ ¦ {-c++=<CC>, -cc=<cc>} Specify C++](https://present5.com/presentation/6a854f89b06518b3e5689a8be6a2f45d/image-41.jpg)
TAU Measurement System Configuration r configure [OPTIONS] ¦ ¦ ¦ {-c++=<CC>, -cc=<cc>} Specify C++ and C compilers {-pthread, -sproc} Use pthread or SGI sproc threads -openmp Use Open. MP threads -jdk=<dir> Specify Java instrumentation (JDK) -opari=<dir> Specify location of Opari Open. MP tool -papi=<dir> Specify location of PAPI -pdt=<dir> Specify location of PDT -dyninst=<dir> Specify location of Dyn. Inst Package -mpi[inc/lib]=<dir> Specify MPI library instrumentation -python[inc/lib]=<dir> Specify Python instrumentation -epilog=<dir> Specify location of EPILOG The TAU Performance System 41 WOMPAT 2004 Open. MP Lab
![TAU Measurement System Configuration r configure [OPTIONS] ¦ ¦ ¦ -TRACE Generate binary TAU TAU Measurement System Configuration r configure [OPTIONS] ¦ ¦ ¦ -TRACE Generate binary TAU](https://present5.com/presentation/6a854f89b06518b3e5689a8be6a2f45d/image-42.jpg)
TAU Measurement System Configuration r configure [OPTIONS] ¦ ¦ ¦ -TRACE Generate binary TAU traces -PROFILE (default) Generate profiles (summary) -PROFILECALLPATH Generate call path profiles -PROFILESTATS Generate std. dev. statistics -MULTIPLECOUNTERS Use hardware counters + time -COMPENSATE Compensate timer overhead -CPUTIME Use usertime+system time -PAPIWALLCLOCK Use PAPI’s wallclock time -PAPIVIRTUAL Use PAPI’s process virtual time -SGITIMERSUse fast IRIX timers -LINUXTIMERS Use fast x 86 Linux timers The TAU Performance System 42 WOMPAT 2004 Open. MP Lab
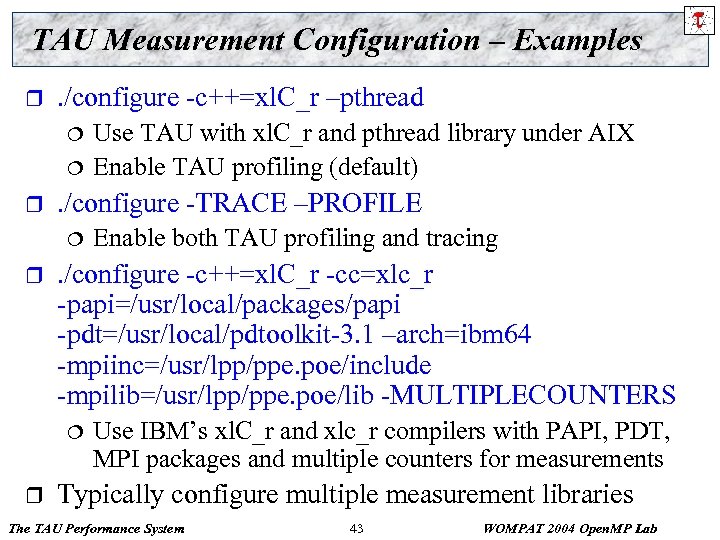
TAU Measurement Configuration – Examples r . /configure -c++=xl. C_r –pthread ¦ ¦ r . /configure -TRACE –PROFILE ¦ r Enable both TAU profiling and tracing . /configure -c++=xl. C_r -cc=xlc_r -papi=/usr/local/packages/papi -pdt=/usr/local/pdtoolkit-3. 1 –arch=ibm 64 -mpiinc=/usr/lpp/ppe. poe/include -mpilib=/usr/lpp/ppe. poe/lib -MULTIPLECOUNTERS ¦ r Use TAU with xl. C_r and pthread library under AIX Enable TAU profiling (default) Use IBM’s xl. C_r and xlc_r compilers with PAPI, PDT, MPI packages and multiple counters for measurements Typically configure multiple measurement libraries The TAU Performance System 43 WOMPAT 2004 Open. MP Lab
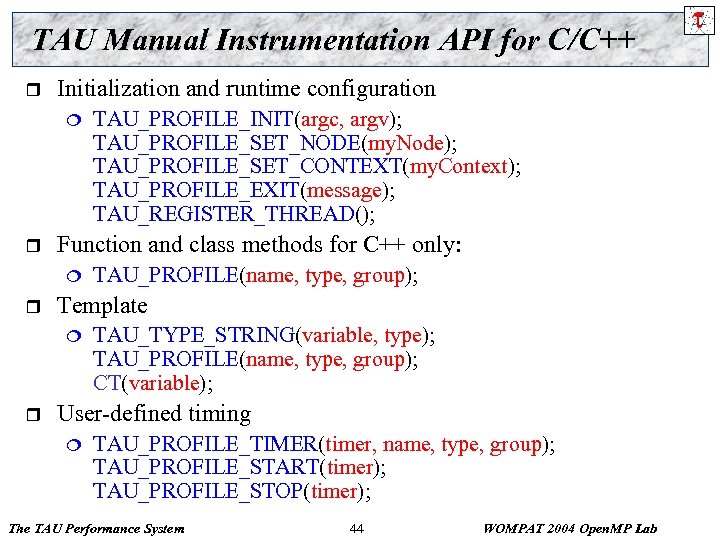
TAU Manual Instrumentation API for C/C++ r Initialization and runtime configuration ¦ r Function and class methods for C++ only: ¦ r TAU_PROFILE(name, type, group); Template ¦ r TAU_PROFILE_INIT(argc, argv); TAU_PROFILE_SET_NODE(my. Node); TAU_PROFILE_SET_CONTEXT(my. Context); TAU_PROFILE_EXIT(message); TAU_REGISTER_THREAD(); TAU_TYPE_STRING(variable, type); TAU_PROFILE(name, type, group); CT(variable); User-defined timing ¦ TAU_PROFILE_TIMER(timer, name, type, group); TAU_PROFILE_START(timer); TAU_PROFILE_STOP(timer); The TAU Performance System 44 WOMPAT 2004 Open. MP Lab
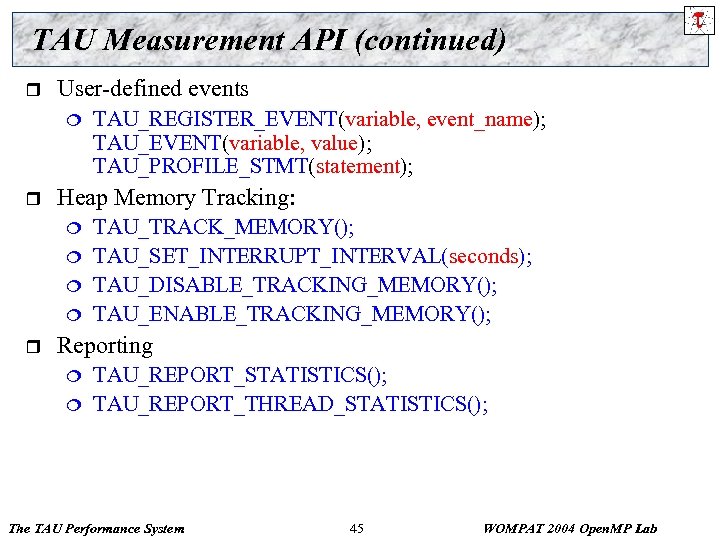
TAU Measurement API (continued) r User-defined events ¦ r Heap Memory Tracking: ¦ ¦ r TAU_REGISTER_EVENT(variable, event_name); TAU_EVENT(variable, value); TAU_PROFILE_STMT(statement); TAU_TRACK_MEMORY(); TAU_SET_INTERRUPT_INTERVAL(seconds); TAU_DISABLE_TRACKING_MEMORY(); TAU_ENABLE_TRACKING_MEMORY(); Reporting ¦ ¦ TAU_REPORT_STATISTICS(); TAU_REPORT_THREAD_STATISTICS(); The TAU Performance System 45 WOMPAT 2004 Open. MP Lab
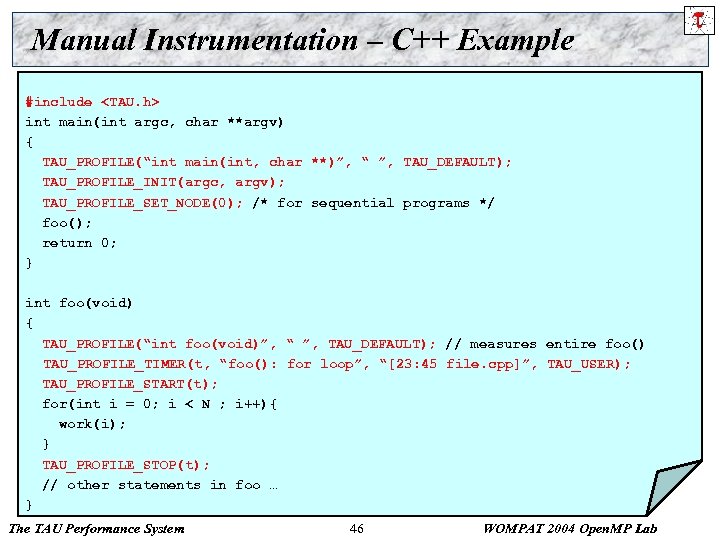
Manual Instrumentation – C++ Example #include <TAU. h> int main(int argc, char **argv) { TAU_PROFILE(“int main(int, char **)”, “ ”, TAU_DEFAULT); TAU_PROFILE_INIT(argc, argv); TAU_PROFILE_SET_NODE(0); /* for sequential programs */ foo(); return 0; } int foo(void) { TAU_PROFILE(“int foo(void)”, “ ”, TAU_DEFAULT); // measures entire foo() TAU_PROFILE_TIMER(t, “foo(): for loop”, “[23: 45 file. cpp]”, TAU_USER); TAU_PROFILE_START(t); for(int i = 0; i < N ; i++){ work(i); } TAU_PROFILE_STOP(t); // other statements in foo … } The TAU Performance System 46 WOMPAT 2004 Open. MP Lab
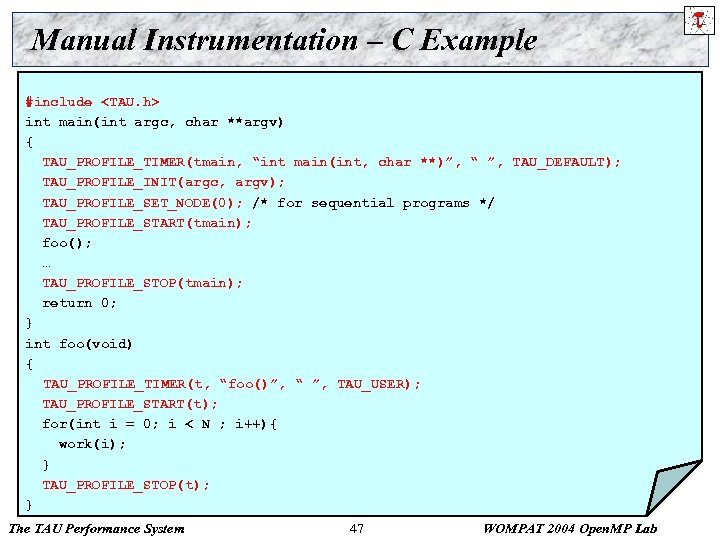
Manual Instrumentation – C Example #include <TAU. h> int main(int argc, char **argv) { TAU_PROFILE_TIMER(tmain, “int main(int, char **)”, “ ”, TAU_DEFAULT); TAU_PROFILE_INIT(argc, argv); TAU_PROFILE_SET_NODE(0); /* for sequential programs */ TAU_PROFILE_START(tmain); foo(); … TAU_PROFILE_STOP(tmain); return 0; } int foo(void) { TAU_PROFILE_TIMER(t, “foo()”, “ ”, TAU_USER); TAU_PROFILE_START(t); for(int i = 0; i < N ; i++){ work(i); } TAU_PROFILE_STOP(t); } The TAU Performance System 47 WOMPAT 2004 Open. MP Lab
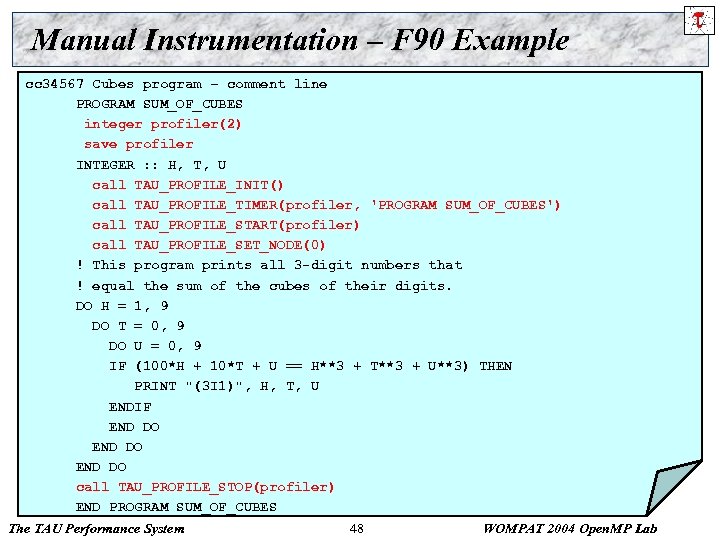
Manual Instrumentation – F 90 Example cc 34567 Cubes program – comment line PROGRAM SUM_OF_CUBES integer profiler(2) save profiler INTEGER : : H, T, U call TAU_PROFILE_INIT() call TAU_PROFILE_TIMER(profiler, 'PROGRAM SUM_OF_CUBES') call TAU_PROFILE_START(profiler) call TAU_PROFILE_SET_NODE(0) ! This program prints all 3 -digit numbers that ! equal the sum of the cubes of their digits. DO H = 1, 9 DO T = 0, 9 DO U = 0, 9 IF (100*H + 10*T + U == H**3 + T**3 + U**3) THEN PRINT "(3 I 1)", H, T, U ENDIF END DO call TAU_PROFILE_STOP(profiler) END PROGRAM SUM_OF_CUBES The TAU Performance System 48 WOMPAT 2004 Open. MP Lab
![Compiling % configure [options] % make clean install Creates <arch>/lib/Makefile. tau<options> stub Makefile and Compiling % configure [options] % make clean install Creates <arch>/lib/Makefile. tau<options> stub Makefile and](https://present5.com/presentation/6a854f89b06518b3e5689a8be6a2f45d/image-49.jpg)
Compiling % configure [options] % make clean install Creates <arch>/lib/Makefile. tau<options> stub Makefile and <arch>/lib. Tau<options>. a [. so] libraries which defines a single configuration of TAU The TAU Performance System 49 WOMPAT 2004 Open. MP Lab
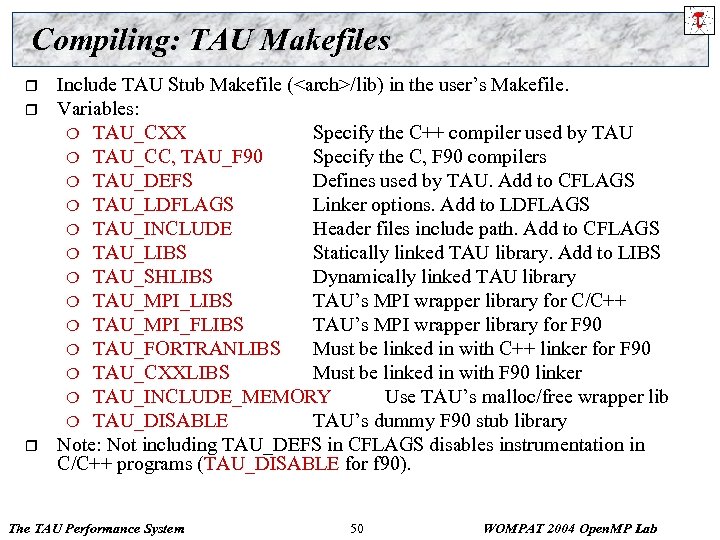
Compiling: TAU Makefiles r r r Include TAU Stub Makefile (<arch>/lib) in the user’s Makefile. Variables: ¦ TAU_CXX Specify the C++ compiler used by TAU ¦ TAU_CC, TAU_F 90 Specify the C, F 90 compilers ¦ TAU_DEFS Defines used by TAU. Add to CFLAGS ¦ TAU_LDFLAGS Linker options. Add to LDFLAGS ¦ TAU_INCLUDE Header files include path. Add to CFLAGS ¦ TAU_LIBS Statically linked TAU library. Add to LIBS ¦ TAU_SHLIBS Dynamically linked TAU library ¦ TAU_MPI_LIBS TAU’s MPI wrapper library for C/C++ ¦ TAU_MPI_FLIBS TAU’s MPI wrapper library for F 90 ¦ TAU_FORTRANLIBS Must be linked in with C++ linker for F 90 ¦ TAU_CXXLIBS Must be linked in with F 90 linker ¦ TAU_INCLUDE_MEMORY Use TAU’s malloc/free wrapper lib ¦ TAU_DISABLE TAU’s dummy F 90 stub library Note: Not including TAU_DEFS in CFLAGS disables instrumentation in C/C++ programs (TAU_DISABLE for f 90). The TAU Performance System 50 WOMPAT 2004 Open. MP Lab
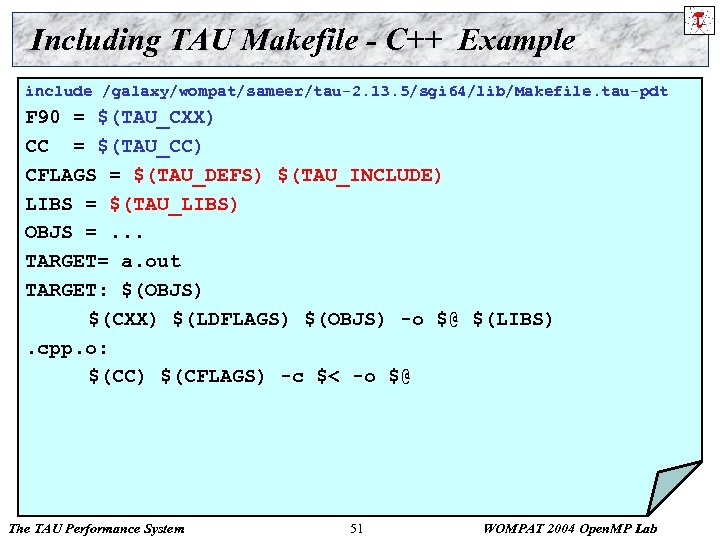
Including TAU Makefile - C++ Example include /galaxy/wompat/sameer/tau-2. 13. 5/sgi 64/lib/Makefile. tau-pdt F 90 = $(TAU_CXX) CC = $(TAU_CC) CFLAGS = $(TAU_DEFS) $(TAU_INCLUDE) LIBS = $(TAU_LIBS) OBJS =. . . TARGET= a. out TARGET: $(OBJS) $(CXX) $(LDFLAGS) $(OBJS) -o $@ $(LIBS). cpp. o: $(CC) $(CFLAGS) -c $< -o $@ The TAU Performance System 51 WOMPAT 2004 Open. MP Lab
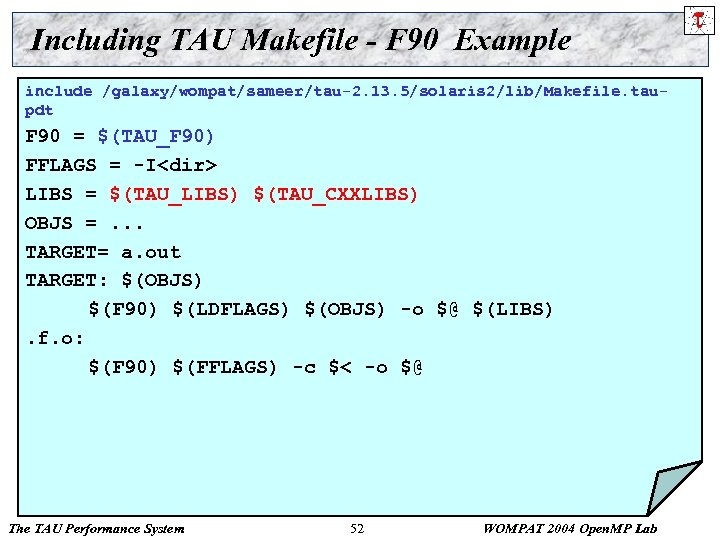
Including TAU Makefile - F 90 Example include /galaxy/wompat/sameer/tau-2. 13. 5/solaris 2/lib/Makefile. taupdt F 90 = $(TAU_F 90) FFLAGS = -I<dir> LIBS = $(TAU_LIBS) $(TAU_CXXLIBS) OBJS =. . . TARGET= a. out TARGET: $(OBJS) $(F 90) $(LDFLAGS) $(OBJS) -o $@ $(LIBS). f. o: $(F 90) $(FFLAGS) -c $< -o $@ The TAU Performance System 52 WOMPAT 2004 Open. MP Lab
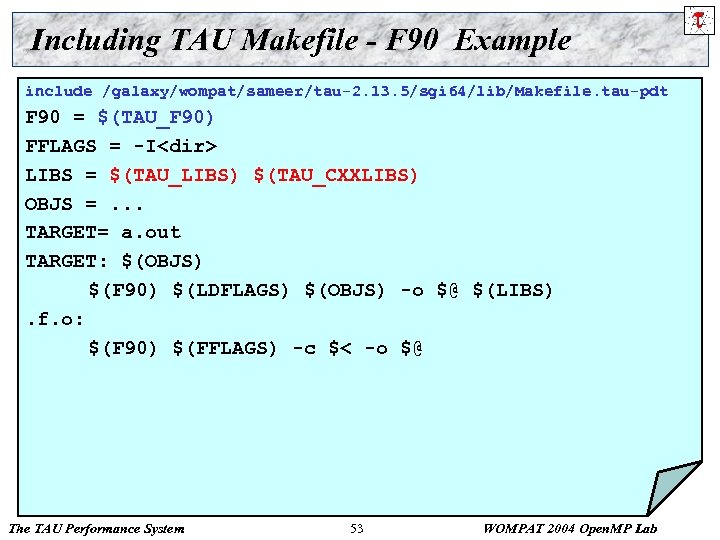
Including TAU Makefile - F 90 Example include /galaxy/wompat/sameer/tau-2. 13. 5/sgi 64/lib/Makefile. tau-pdt F 90 = $(TAU_F 90) FFLAGS = -I<dir> LIBS = $(TAU_LIBS) $(TAU_CXXLIBS) OBJS =. . . TARGET= a. out TARGET: $(OBJS) $(F 90) $(LDFLAGS) $(OBJS) -o $@ $(LIBS). f. o: $(F 90) $(FFLAGS) -c $< -o $@ The TAU Performance System 53 WOMPAT 2004 Open. MP Lab
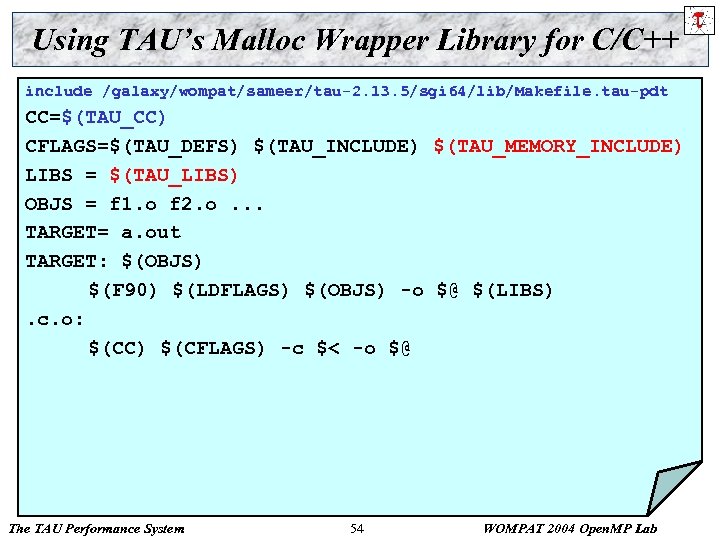
Using TAU’s Malloc Wrapper Library for C/C++ include /galaxy/wompat/sameer/tau-2. 13. 5/sgi 64/lib/Makefile. tau-pdt CC=$(TAU_CC) CFLAGS=$(TAU_DEFS) $(TAU_INCLUDE) $(TAU_MEMORY_INCLUDE) LIBS = $(TAU_LIBS) OBJS = f 1. o f 2. o. . . TARGET= a. out TARGET: $(OBJS) $(F 90) $(LDFLAGS) $(OBJS) -o $@ $(LIBS). c. o: $(CC) $(CFLAGS) -c $< -o $@ The TAU Performance System 54 WOMPAT 2004 Open. MP Lab
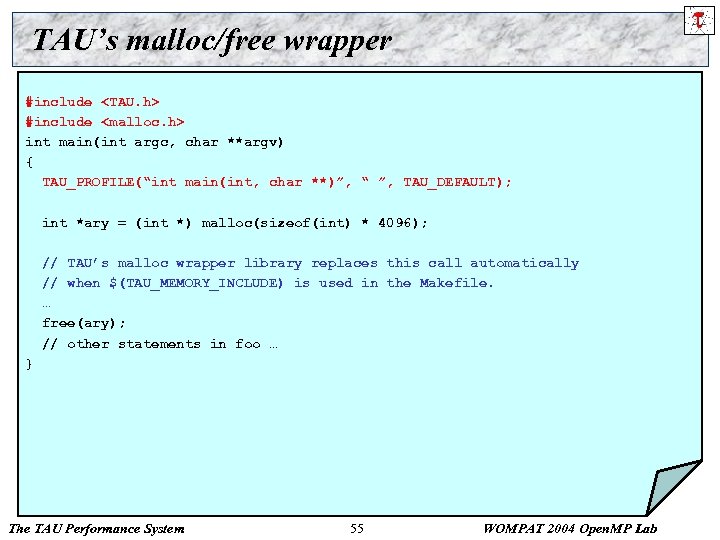
TAU’s malloc/free wrapper #include <TAU. h> #include <malloc. h> int main(int argc, char **argv) { TAU_PROFILE(“int main(int, char **)”, “ ”, TAU_DEFAULT); int *ary = (int *) malloc(sizeof(int) * 4096); // TAU’s malloc wrapper library replaces this call automatically // when $(TAU_MEMORY_INCLUDE) is used in the Makefile. … free(ary); // other statements in foo … } The TAU Performance System 55 WOMPAT 2004 Open. MP Lab
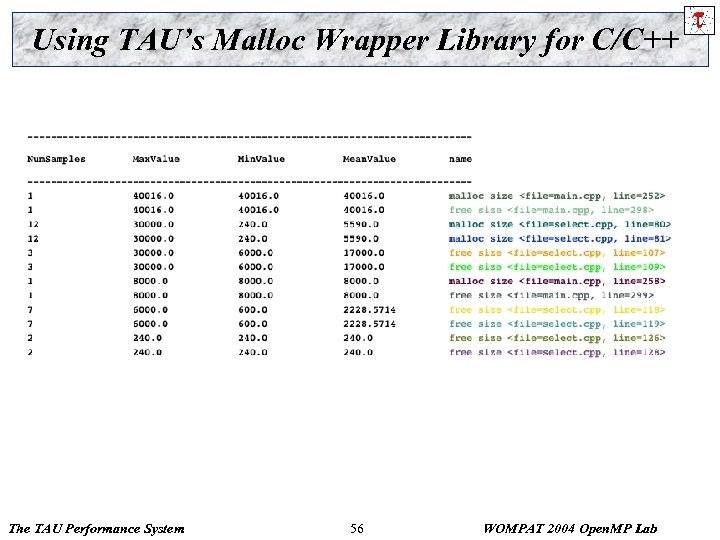
Using TAU’s Malloc Wrapper Library for C/C++ The TAU Performance System 56 WOMPAT 2004 Open. MP Lab

Using TAU – A tutorial r r Configuration Instrumentation ¦ ¦ r r Manual PDT- Source rewriting for C, C++, F 77/90/95 MPI – Wrapper interposition library Open. MP – Directive rewriting Measurement Performance Analysis The TAU Performance System 57 WOMPAT 2004 Open. MP Lab
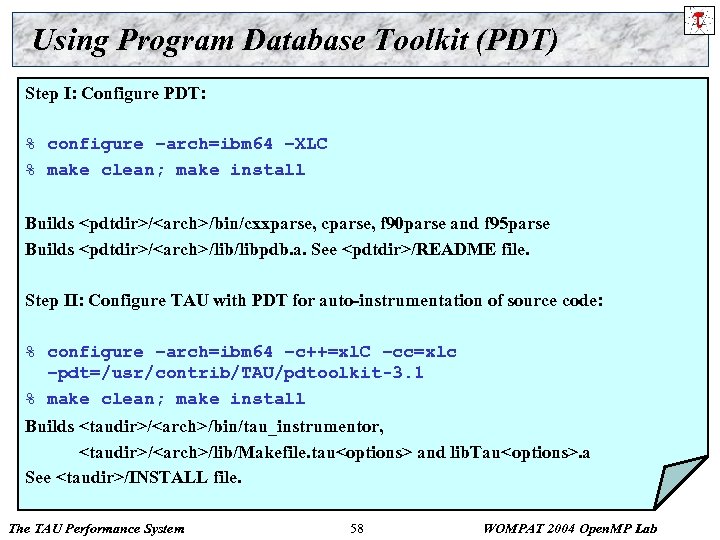
Using Program Database Toolkit (PDT) Step I: Configure PDT: % configure –arch=ibm 64 –XLC % make clean; make install Builds <pdtdir>/<arch>/bin/cxxparse, cparse, f 90 parse and f 95 parse Builds <pdtdir>/<arch>/libpdb. a. See <pdtdir>/README file. Step II: Configure TAU with PDT for auto-instrumentation of source code: % configure –arch=ibm 64 –c++=xl. C –cc=xlc –pdt=/usr/contrib/TAU/pdtoolkit-3. 1 % make clean; make install Builds <taudir>/<arch>/bin/tau_instrumentor, <taudir>/<arch>/lib/Makefile. tau<options> and lib. Tau<options>. a See <taudir>/INSTALL file. The TAU Performance System 58 WOMPAT 2004 Open. MP Lab
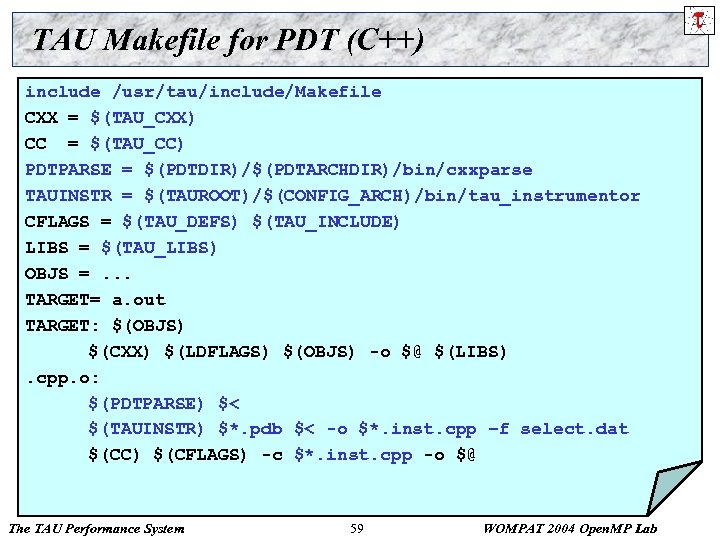
TAU Makefile for PDT (C++) include /usr/tau/include/Makefile CXX = $(TAU_CXX) CC = $(TAU_CC) PDTPARSE = $(PDTDIR)/$(PDTARCHDIR)/bin/cxxparse TAUINSTR = $(TAUROOT)/$(CONFIG_ARCH)/bin/tau_instrumentor CFLAGS = $(TAU_DEFS) $(TAU_INCLUDE) LIBS = $(TAU_LIBS) OBJS =. . . TARGET= a. out TARGET: $(OBJS) $(CXX) $(LDFLAGS) $(OBJS) -o $@ $(LIBS). cpp. o: $(PDTPARSE) $< $(TAUINSTR) $*. pdb $< -o $*. inst. cpp –f select. dat $(CC) $(CFLAGS) -c $*. inst. cpp -o $@ The TAU Performance System 59 WOMPAT 2004 Open. MP Lab
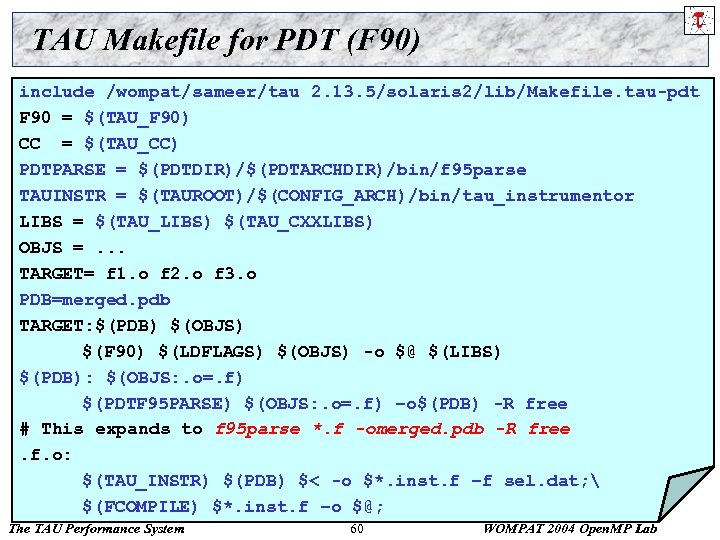
TAU Makefile for PDT (F 90) include /wompat/sameer/tau 2. 13. 5/solaris 2/lib/Makefile. tau-pdt F 90 = $(TAU_F 90) CC = $(TAU_CC) PDTPARSE = $(PDTDIR)/$(PDTARCHDIR)/bin/f 95 parse TAUINSTR = $(TAUROOT)/$(CONFIG_ARCH)/bin/tau_instrumentor LIBS = $(TAU_LIBS) $(TAU_CXXLIBS) OBJS =. . . TARGET= f 1. o f 2. o f 3. o PDB=merged. pdb TARGET: $(PDB) $(OBJS) $(F 90) $(LDFLAGS) $(OBJS) -o $@ $(LIBS) $(PDB): $(OBJS: . o=. f) $(PDTF 95 PARSE) $(OBJS: . o=. f) –o$(PDB) -R free # This expands to f 95 parse *. f -omerged. pdb -R free. f. o: $(TAU_INSTR) $(PDB) $< -o $*. inst. f –f sel. dat; $(FCOMPILE) $*. inst. f –o $@; The TAU Performance System 60 WOMPAT 2004 Open. MP Lab
![Using PDT: tau_instrumentor % tau_instrumentor Usage : tau_instrumentor <pdbfile> <sourcefile> [-o <outputfile>] [-noinline] [ Using PDT: tau_instrumentor % tau_instrumentor Usage : tau_instrumentor <pdbfile> <sourcefile> [-o <outputfile>] [-noinline] [](https://present5.com/presentation/6a854f89b06518b3e5689a8be6a2f45d/image-61.jpg)
Using PDT: tau_instrumentor % tau_instrumentor Usage : tau_instrumentor <pdbfile> <sourcefile> [-o <outputfile>] [-noinline] [ -g groupname] [-i headerfile] [-c|-c++|-fortran] [-f <instr_req_file> ] For selective instrumentation, use –f option % tau_instrumentor foo. pdb foo. cpp –o foo. inst. cpp –f selective. dat % cat selective. dat # Selective instrumentation: Specify an exclude/include list of routines/files. BEGIN_EXCLUDE_LIST void quicksort(int *, int) void sort_5 elements(int *) void interchange(int *, int *) END_EXCLUDE_LIST BEGIN_FILE_INCLUDE_LIST Main. cpp Foo? . c *. C END_FILE_INCLUDE_LIST # Instruments routines in Main. cpp, Foo? . c and *. C files only # Use BEGIN_[FILE]_INCLUDE_LIST with END_[FILE]_INCLUDE_LIST The TAU Performance System 61 WOMPAT 2004 Open. MP Lab
Using TAU – A tutorial r r Configuration Instrumentation ¦ ¦ r r Manual PDT- Source rewriting for C, C++, F 77/90/95 MPI – Wrapper interposition library Open. MP – Directive rewriting Measurement Performance Analysis The TAU Performance System 62 WOMPAT 2004 Open. MP Lab
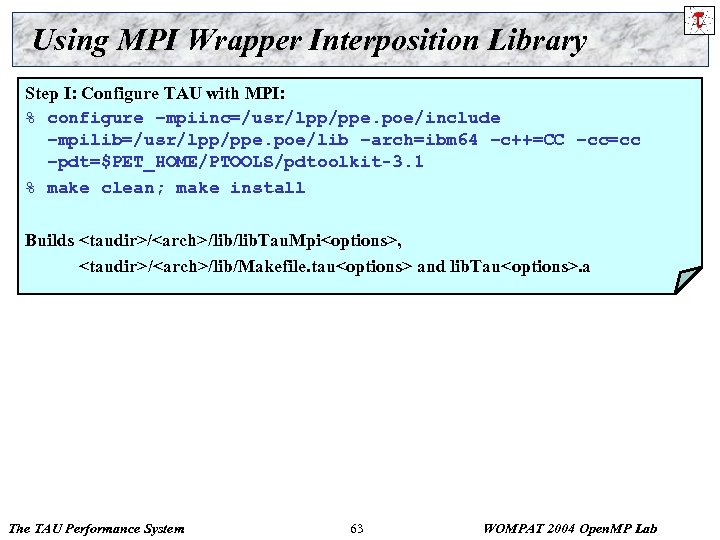
Using MPI Wrapper Interposition Library Step I: Configure TAU with MPI: % configure –mpiinc=/usr/lpp/ppe. poe/include –mpilib=/usr/lpp/ppe. poe/lib –arch=ibm 64 –c++=CC –cc=cc –pdt=$PET_HOME/PTOOLS/pdtoolkit-3. 1 % make clean; make install Builds <taudir>/<arch>/lib. Tau. Mpi<options>, <taudir>/<arch>/lib/Makefile. tau<options> and lib. Tau<options>. a The TAU Performance System 63 WOMPAT 2004 Open. MP Lab
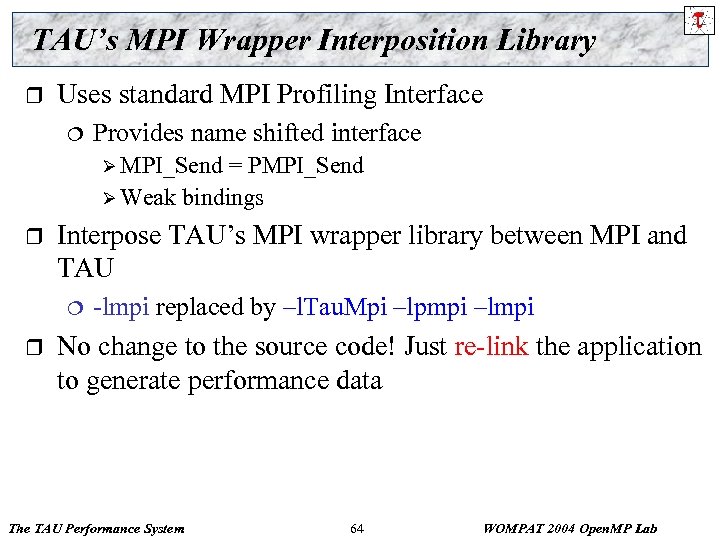
TAU’s MPI Wrapper Interposition Library r Uses standard MPI Profiling Interface ¦ Provides name shifted interface Ø MPI_Send = PMPI_Send Ø Weak bindings r Interpose TAU’s MPI wrapper library between MPI and TAU ¦ r -lmpi replaced by –l. Tau. Mpi –lpmpi –lmpi No change to the source code! Just re-link the application to generate performance data The TAU Performance System 64 WOMPAT 2004 Open. MP Lab
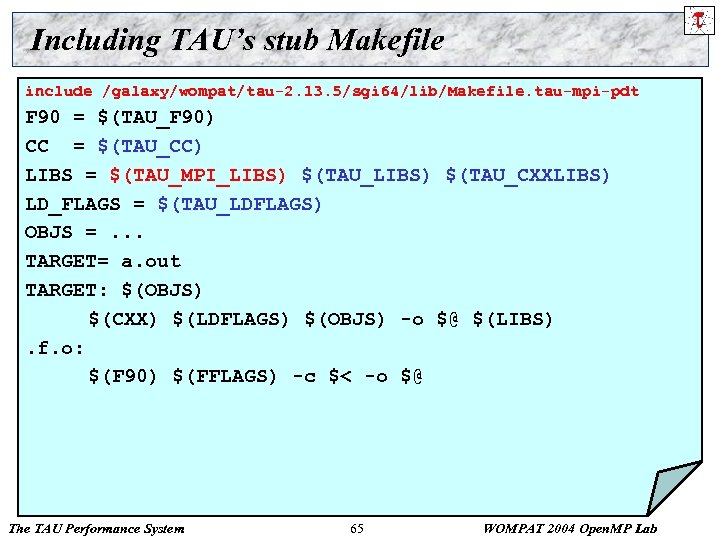
Including TAU’s stub Makefile include /galaxy/wompat/tau-2. 13. 5/sgi 64/lib/Makefile. tau-mpi-pdt F 90 = $(TAU_F 90) CC = $(TAU_CC) LIBS = $(TAU_MPI_LIBS) $(TAU_CXXLIBS) LD_FLAGS = $(TAU_LDFLAGS) OBJS =. . . TARGET= a. out TARGET: $(OBJS) $(CXX) $(LDFLAGS) $(OBJS) -o $@ $(LIBS). f. o: $(F 90) $(FFLAGS) -c $< -o $@ The TAU Performance System 65 WOMPAT 2004 Open. MP Lab
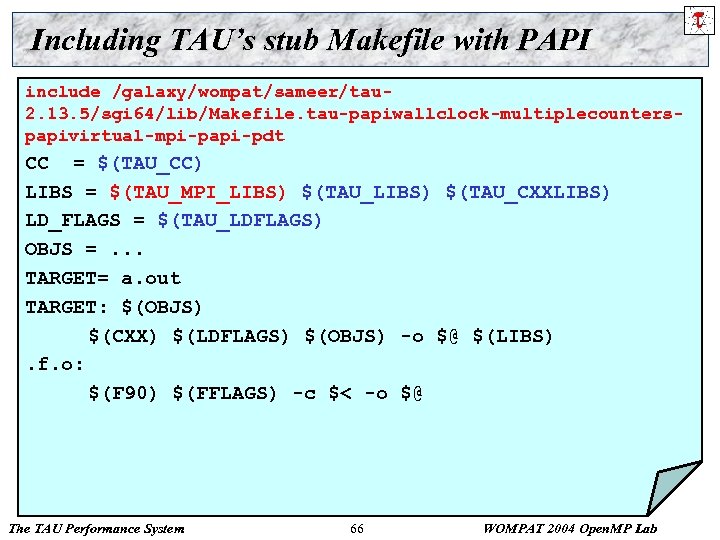
Including TAU’s stub Makefile with PAPI include /galaxy/wompat/sameer/tau 2. 13. 5/sgi 64/lib/Makefile. tau-papiwallclock-multiplecounterspapivirtual-mpi-papi-pdt CC = $(TAU_CC) LIBS = $(TAU_MPI_LIBS) $(TAU_CXXLIBS) LD_FLAGS = $(TAU_LDFLAGS) OBJS =. . . TARGET= a. out TARGET: $(OBJS) $(CXX) $(LDFLAGS) $(OBJS) -o $@ $(LIBS). f. o: $(F 90) $(FFLAGS) -c $< -o $@ The TAU Performance System 66 WOMPAT 2004 Open. MP Lab
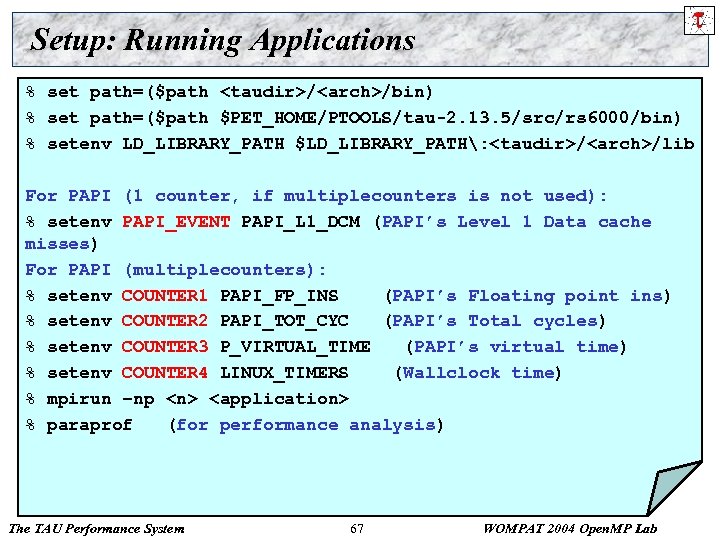
Setup: Running Applications % set path=($path <taudir>/<arch>/bin) % set path=($path $PET_HOME/PTOOLS/tau-2. 13. 5/src/rs 6000/bin) % setenv LD_LIBRARY_PATH $LD_LIBRARY_PATH: <taudir>/<arch>/lib For PAPI (1 counter, if multiplecounters is not used): % setenv PAPI_EVENT PAPI_L 1_DCM (PAPI’s Level 1 Data cache misses) For PAPI (multiplecounters): % setenv COUNTER 1 PAPI_FP_INS (PAPI’s Floating point ins) % setenv COUNTER 2 PAPI_TOT_CYC (PAPI’s Total cycles) % setenv COUNTER 3 P_VIRTUAL_TIME (PAPI’s virtual time) % setenv COUNTER 4 LINUX_TIMERS (Wallclock time) % mpirun –np <n> <application> % paraprof (for performance analysis) The TAU Performance System 67 WOMPAT 2004 Open. MP Lab
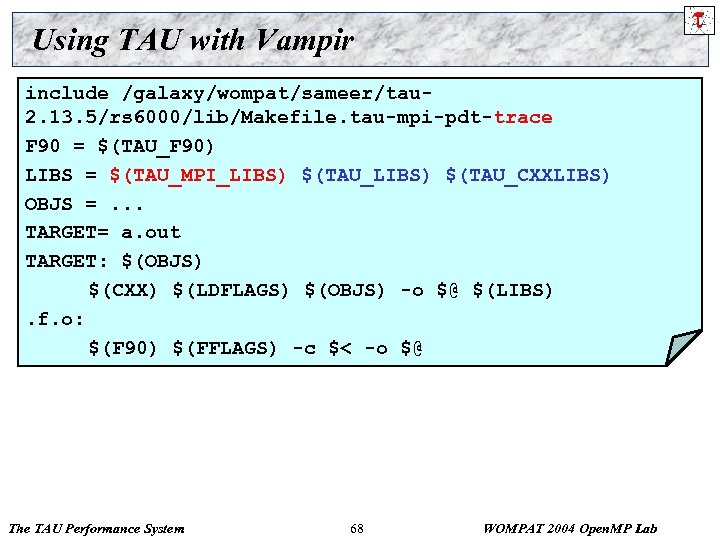
Using TAU with Vampir include /galaxy/wompat/sameer/tau 2. 13. 5/rs 6000/lib/Makefile. tau-mpi-pdt-trace F 90 = $(TAU_F 90) LIBS = $(TAU_MPI_LIBS) $(TAU_CXXLIBS) OBJS =. . . TARGET= a. out TARGET: $(OBJS) $(CXX) $(LDFLAGS) $(OBJS) -o $@ $(LIBS). f. o: $(F 90) $(FFLAGS) -c $< -o $@ The TAU Performance System 68 WOMPAT 2004 Open. MP Lab
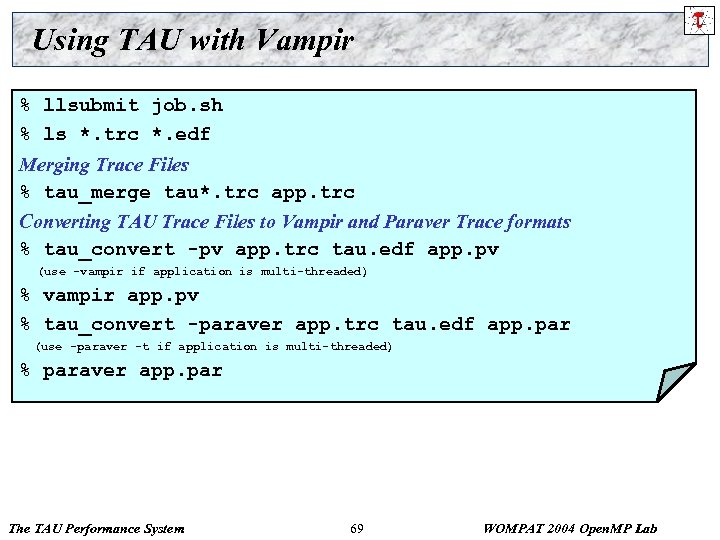
Using TAU with Vampir % llsubmit job. sh % ls *. trc *. edf Merging Trace Files % tau_merge tau*. trc app. trc Converting TAU Trace Files to Vampir and Paraver Trace formats % tau_convert -pv app. trc tau. edf app. pv (use -vampir if application is multi-threaded) % vampir app. pv % tau_convert -paraver app. trc tau. edf app. par (use -paraver -t if application is multi-threaded) % paraver app. par The TAU Performance System 69 WOMPAT 2004 Open. MP Lab
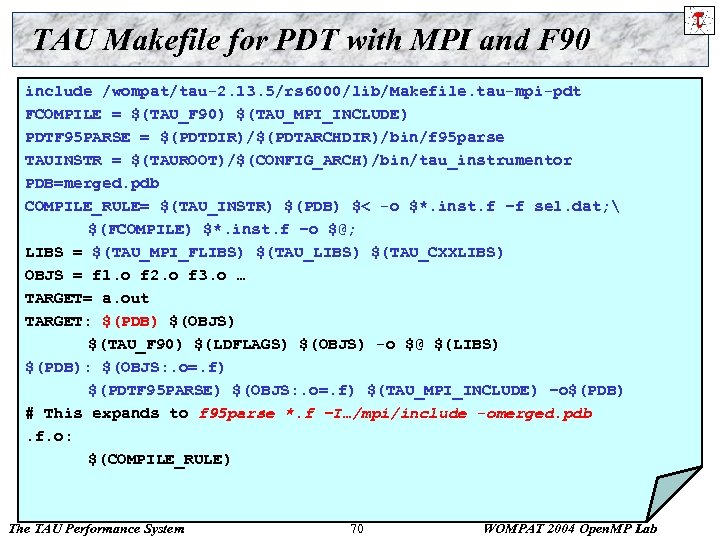
TAU Makefile for PDT with MPI and F 90 include /wompat/tau-2. 13. 5/rs 6000/lib/Makefile. tau-mpi-pdt FCOMPILE = $(TAU_F 90) $(TAU_MPI_INCLUDE) PDTF 95 PARSE = $(PDTDIR)/$(PDTARCHDIR)/bin/f 95 parse TAUINSTR = $(TAUROOT)/$(CONFIG_ARCH)/bin/tau_instrumentor PDB=merged. pdb COMPILE_RULE= $(TAU_INSTR) $(PDB) $< -o $*. inst. f –f sel. dat; $(FCOMPILE) $*. inst. f –o $@; LIBS = $(TAU_MPI_FLIBS) $(TAU_CXXLIBS) OBJS = f 1. o f 2. o f 3. o … TARGET= a. out TARGET: $(PDB) $(OBJS) $(TAU_F 90) $(LDFLAGS) $(OBJS) -o $@ $(LIBS) $(PDB): $(OBJS: . o=. f) $(PDTF 95 PARSE) $(OBJS: . o=. f) $(TAU_MPI_INCLUDE) –o$(PDB) # This expands to f 95 parse *. f –I…/mpi/include -omerged. pdb. f. o: $(COMPILE_RULE) The TAU Performance System 70 WOMPAT 2004 Open. MP Lab
Using TAU – A tutorial r r Configuration Instrumentation ¦ ¦ r r Manual PDT- Source rewriting for C, C++, F 77/90/95 MPI – Wrapper interposition library Open. MP – Directive rewriting Measurement Performance Analysis The TAU Performance System 71 WOMPAT 2004 Open. MP Lab
![Using Opari with TAU Step I: Configure KOJAK/opari [Download from http: //www. fz-juelich. de/zam/kojak/] Using Opari with TAU Step I: Configure KOJAK/opari [Download from http: //www. fz-juelich. de/zam/kojak/]](https://present5.com/presentation/6a854f89b06518b3e5689a8be6a2f45d/image-72.jpg)
Using Opari with TAU Step I: Configure KOJAK/opari [Download from http: //www. fz-juelich. de/zam/kojak/] % cd kojak-1. 0; cp mf/Makefile. defs. ibm Makefile. defs; edit Makefile % make Builds opari Step II: Configure TAU with Opari (used here with MPI and PDT) % configure –opari=/galaxy/wompat/sameer/kojak/sun/kojak-1. 0/opari -mpiinc=/usr/include –mpilib=/usr/lib –pdt=/galaxy/wompat/sameer/pdtoolkit-3. 1 % make clean; make install The TAU Performance System 72 WOMPAT 2004 Open. MP Lab
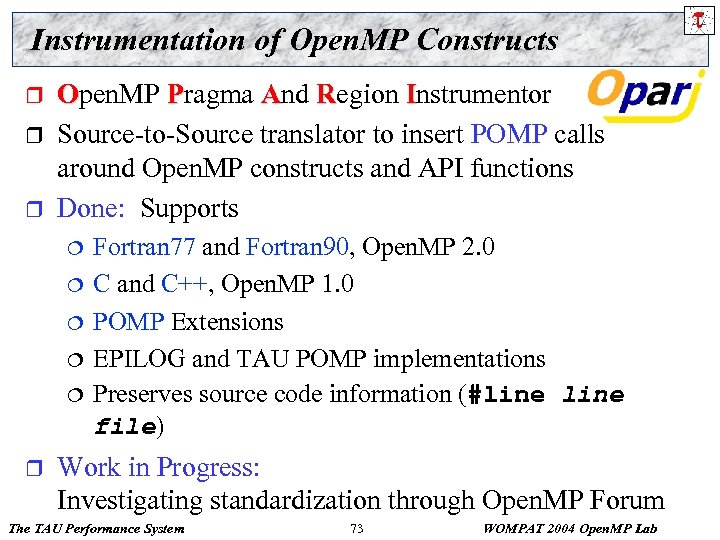
Instrumentation of Open. MP Constructs r r r Open. MP Pragma And Region Instrumentor Source-to-Source translator to insert POMP calls around Open. MP constructs and API functions Done: Supports ¦ ¦ ¦ r Fortran 77 and Fortran 90, Open. MP 2. 0 C and C++, Open. MP 1. 0 POMP Extensions EPILOG and TAU POMP implementations Preserves source code information (#line file) Work in Progress: Investigating standardization through Open. MP Forum The TAU Performance System 73 WOMPAT 2004 Open. MP Lab
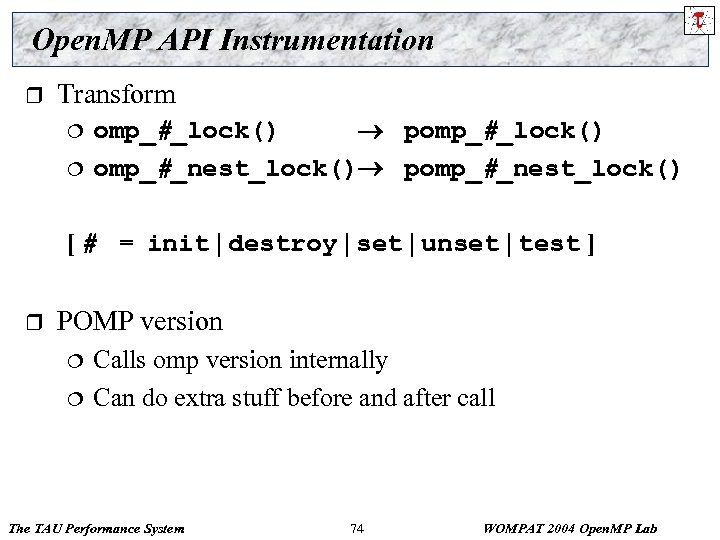
Open. MP API Instrumentation r Transform ¦ ¦ omp_#_lock() pomp_#_lock() omp_#_nest_lock() pomp_#_nest_lock() [ # = init | destroy | set | unset | test ] r POMP version ¦ ¦ Calls omp version internally Can do extra stuff before and after call The TAU Performance System 74 WOMPAT 2004 Open. MP Lab
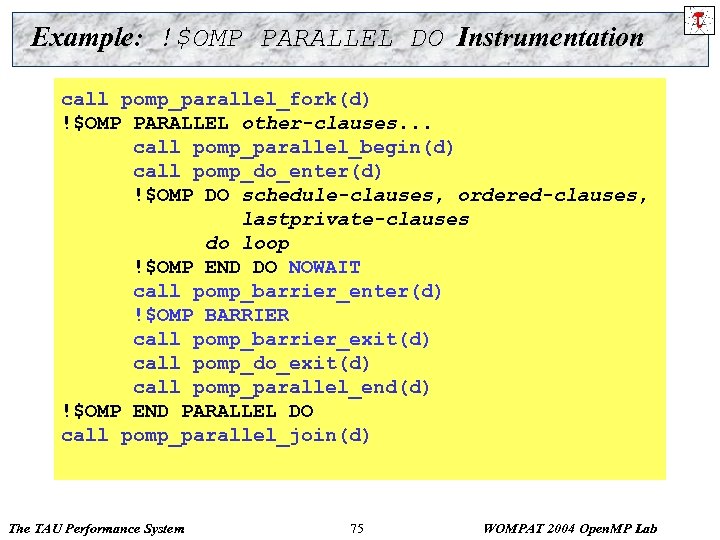
Example: !$OMP PARALLEL DO Instrumentation call pomp_parallel_fork(d) !$OMP PARALLEL other-clauses. . . !$OMP PARALLEL DO clauses. . . call pomp_parallel_begin(d) call pomp_do_enter(d) !$OMP DO schedule-clauses, ordered-clauses, lastprivate-clauses do loop NOWAIT !$OMP END DO call pomp_barrier_enter(d) !$OMP BARRIER call pomp_barrier_exit(d) call pomp_do_exit(d) call pomp_parallel_end(d) !$OMP END PARALLEL DO call pomp_parallel_join(d) The TAU Performance System 75 WOMPAT 2004 Open. MP Lab
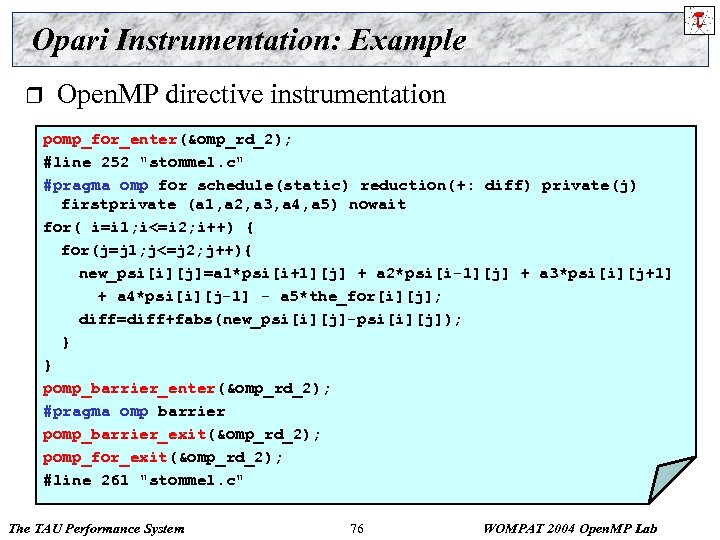
Opari Instrumentation: Example r Open. MP directive instrumentation pomp_for_enter(&omp_rd_2); #line 252 "stommel. c" #pragma omp for schedule(static) reduction(+: diff) private(j) firstprivate (a 1, a 2, a 3, a 4, a 5) nowait for( i=i 1; i<=i 2; i++) { for(j=j 1; j<=j 2; j++){ new_psi[i][j]=a 1*psi[i+1][j] + a 2*psi[i-1][j] + a 3*psi[i][j+1] + a 4*psi[i][j-1] - a 5*the_for[i][j]; diff=diff+fabs(new_psi[i][j]-psi[i][j]); } } pomp_barrier_enter(&omp_rd_2); #pragma omp barrier pomp_barrier_exit(&omp_rd_2); pomp_for_exit(&omp_rd_2); #line 261 "stommel. c" The TAU Performance System 76 WOMPAT 2004 Open. MP Lab
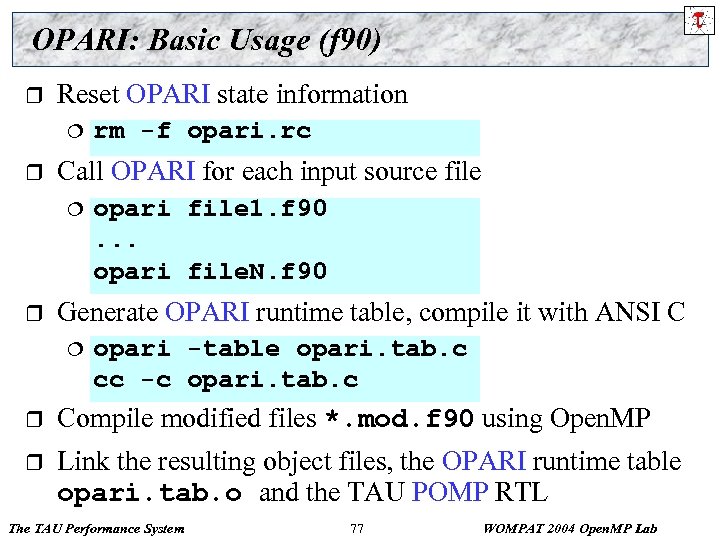
OPARI: Basic Usage (f 90) r Reset OPARI state information ¦ r Call OPARI for each input source file ¦ r rm -f opari. rc opari file 1. f 90. . . opari file. N. f 90 Generate OPARI runtime table, compile it with ANSI C ¦ opari -table opari. tab. c cc -c opari. tab. c r Compile modified files *. mod. f 90 using Open. MP r Link the resulting object files, the OPARI runtime table opari. tab. o and the TAU POMP RTL The TAU Performance System 77 WOMPAT 2004 Open. MP Lab
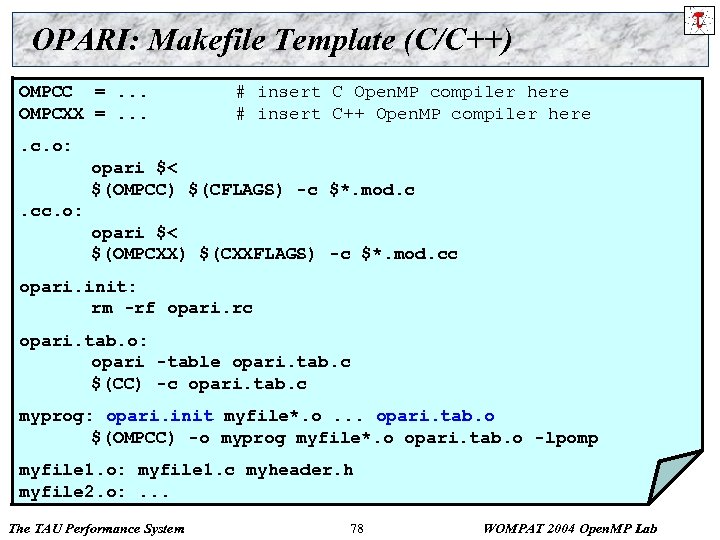
OPARI: Makefile Template (C/C++) OMPCC =. . . OMPCXX =. . . # insert C Open. MP compiler here # insert C++ Open. MP compiler here . c. o: opari $< $(OMPCC) $(CFLAGS) -c $*. mod. c. cc. o: opari $< $(OMPCXX) $(CXXFLAGS) -c $*. mod. cc opari. init: rm -rf opari. rc opari. tab. o: opari -table opari. tab. c $(CC) -c opari. tab. c myprog: opari. init myfile*. o. . . opari. tab. o $(OMPCC) -o myprog myfile*. o opari. tab. o -lpomp myfile 1. o: myfile 1. c myheader. h myfile 2. o: . . . The TAU Performance System 78 WOMPAT 2004 Open. MP Lab
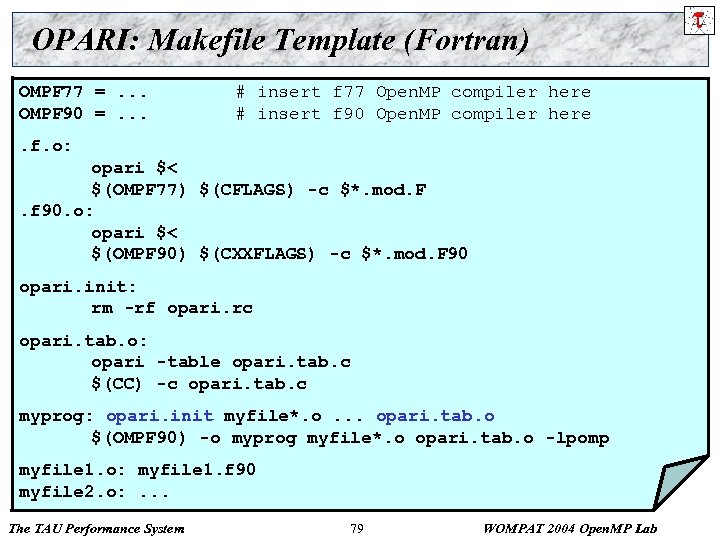
OPARI: Makefile Template (Fortran) OMPF 77 =. . . OMPF 90 =. . . # insert f 77 Open. MP compiler here # insert f 90 Open. MP compiler here . f. o: opari $< $(OMPF 77) $(CFLAGS) -c $*. mod. F. f 90. o: opari $< $(OMPF 90) $(CXXFLAGS) -c $*. mod. F 90 opari. init: rm -rf opari. rc opari. tab. o: opari -table opari. tab. c $(CC) -c opari. tab. c myprog: opari. init myfile*. o. . . opari. tab. o $(OMPF 90) -o myprog myfile*. o opari. tab. o -lpomp myfile 1. o: myfile 1. f 90 myfile 2. o: . . . The TAU Performance System 79 WOMPAT 2004 Open. MP Lab
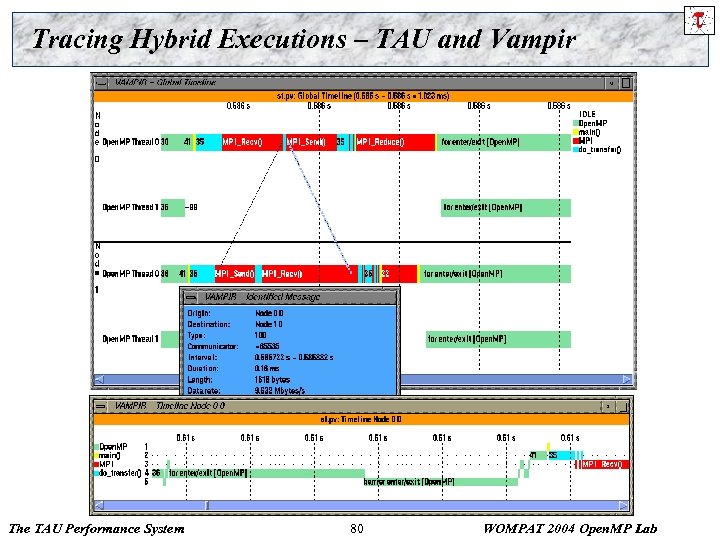
Tracing Hybrid Executions – TAU and Vampir The TAU Performance System 80 WOMPAT 2004 Open. MP Lab
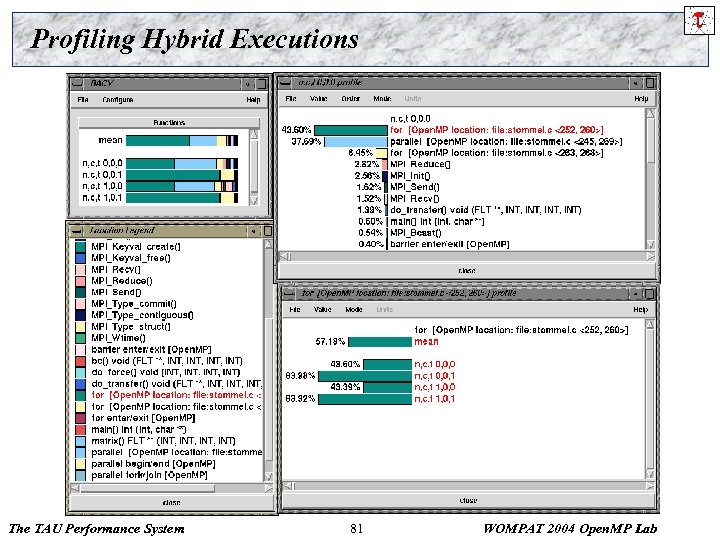
Profiling Hybrid Executions The TAU Performance System 81 WOMPAT 2004 Open. MP Lab
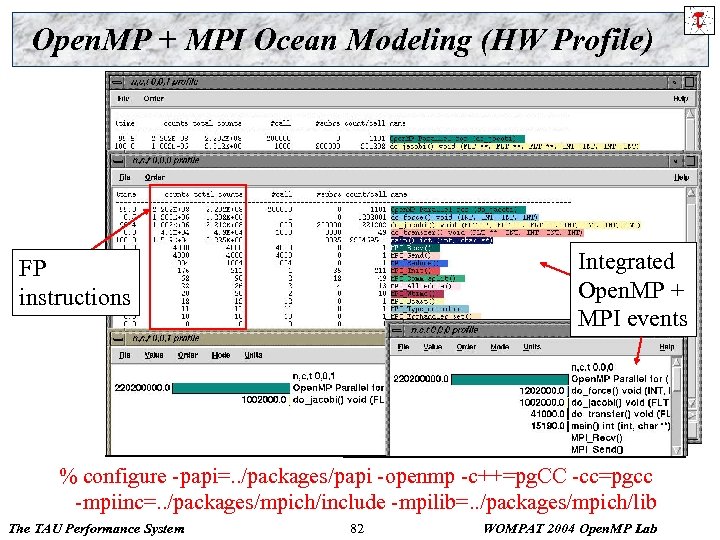
Open. MP + MPI Ocean Modeling (HW Profile) Integrated Open. MP + MPI events FP instructions % configure -papi=. . /packages/papi -openmp -c++=pg. CC -cc=pgcc -mpiinc=. . /packages/mpich/include -mpilib=. . /packages/mpich/lib The TAU Performance System 82 WOMPAT 2004 Open. MP Lab
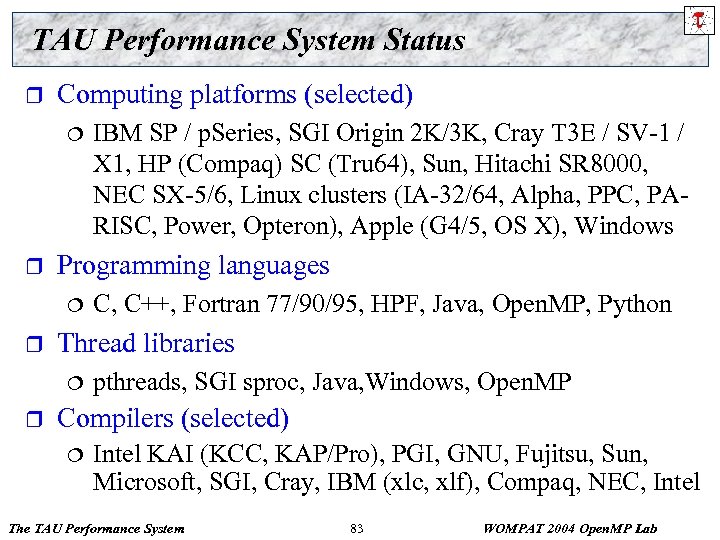
TAU Performance System Status r Computing platforms (selected) ¦ r Programming languages ¦ r C, C++, Fortran 77/90/95, HPF, Java, Open. MP, Python Thread libraries ¦ r IBM SP / p. Series, SGI Origin 2 K/3 K, Cray T 3 E / SV-1 / X 1, HP (Compaq) SC (Tru 64), Sun, Hitachi SR 8000, NEC SX-5/6, Linux clusters (IA-32/64, Alpha, PPC, PARISC, Power, Opteron), Apple (G 4/5, OS X), Windows pthreads, SGI sproc, Java, Windows, Open. MP Compilers (selected) ¦ Intel KAI (KCC, KAP/Pro), PGI, GNU, Fujitsu, Sun, Microsoft, SGI, Cray, IBM (xlc, xlf), Compaq, NEC, Intel The TAU Performance System 83 WOMPAT 2004 Open. MP Lab
Concluding Remarks Complex parallel systems and software pose challenging performance analysis problems that require robust methodologies and tools r To build more sophisticated performance tools, existing proven performance technology must be utilized r Performance tools must be integrated with software and systems models and technology r Performance engineered software ¦ Function consistently and coherently in software and system environments ¦ r TAU performance system offers robust performance technology that can be broadly integrated The TAU Performance System 84 WOMPAT 2004 Open. MP Lab
Support Acknowledgements r r Department of Energy (DOE) ¦ Office of Science contracts ¦ University of Utah DOE ASCI Level 1 sub-contract ¦ DOE ASCI Level 3 (LANL, LLNL) NSF National Young Investigator (NYI) award Research Centre Juelich ¦ John von Neumann Institute for Computing ¦ Dr. Bernd Mohr Los Alamos National Laboratory The TAU Performance System 85 WOMPAT 2004 Open. MP Lab
6a854f89b06518b3e5689a8be6a2f45d.ppt