ffec7ff690bc8986829576963f9fadb3.ppt
- Количество слайдов: 87
 TAU: Performance Technology for Productive, High Performance Computing Cray, Seattle, 10 am Jan 13, 2010 Sameer Shende Director, Performance Research Laboratory University of Oregon, Eugene, OR sameer@cs. uoregon. edu http: //tau. uoregon. edu
 Acknowledgements: University of Oregon r r r r Dr. Allen D. Malony, Professor, CIS Dept, and Director, Neuro. Informatics Center Alan Morris, Senior software engineer Wyatt Spear, Software engineer Scott Biersdorff, Software engineer Dr. Robert Yelle, Research faculty Suzanne Millstein, Ph. D. student Ivan Pulleyn, Systems administrator http: //tau. uoregon. edu TAU 2
 Outline r r r Introduction to TAU Instrumentation Measurement Analysis Examples of TAU usage Future work/collaboration http: //tau. uoregon. edu TAU 3
 What is TAU? r r r r r TAU is a performance evaluation tool It supports parallel profiling and tracing toolkit Profiling shows you how much (total) time was spent in each routine Tracing shows you when the events take place in each process along a timeline Profiling and tracing can measure time as well as hardware performance counters from your CPU TAU can automatically instrument your source code (routines, loops, I/O, memory, phases, etc. ) It supports C++, C, Chapel, UPC, Fortran, Python and Java TAU runs on all HPC platforms and it is free (BSD style license) TAU has instrumentation, measurement and analysis tools To use TAU, you need to set a couple of environment variables and substitute the name of the compiler with a TAU shell script http: //tau. uoregon. edu TAU 4
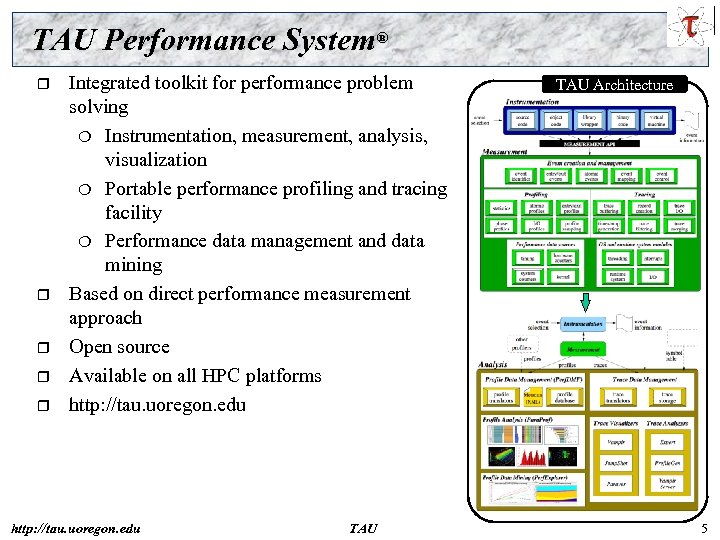 TAU Performance System® r r r Integrated toolkit for performance problem solving Instrumentation, measurement, analysis, visualization Portable performance profiling and tracing facility Performance data management and data mining Based on direct performance measurement approach Open source Available on all HPC platforms http: //tau. uoregon. edu TAU Architecture 5
 Performance Evaluation r Profiling Presents summary statistics of performance metrics number of times a routine was invoked Ø exclusive, inclusive time/hpm counts spent executing it Ø number of instrumented child routines invoked, etc. Ø structure of invocations (calltrees/callgraphs) Ø memory, message communication sizes also tracked Ø r Tracing Presents when and where events took place along a global timeline timestamped log of events Ø message communication events (sends/receives) are tracked l shows when and where messages were sent Ø large volume of performance data generated leads to more perturbation in the program Ø http: //tau. uoregon. edu TAU 6
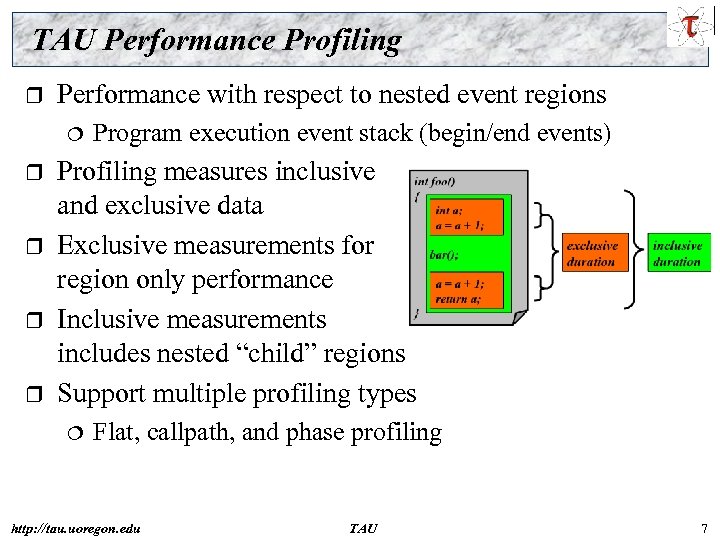 TAU Performance Profiling r Performance with respect to nested event regions r r Program execution event stack (begin/end events) Profiling measures inclusive and exclusive data Exclusive measurements for region only performance Inclusive measurements includes nested “child” regions Support multiple profiling types Flat, callpath, and phase profiling http: //tau. uoregon. edu TAU 7
 TAU Parallel Performance System Goals r Portable (open source) parallel performance system r r r Multi-level, multi-language performance instrumentation Flexible and configurable performance measurement Support for multiple parallel programming paradigms r r r Computer system architectures and operating systems Different programming languages and compilers Multi-threading, message passing, mixed-mode, hybrid, object oriented (generic), component-based Support for performance mapping Integration of leading performance technology Scalable (very large) parallel performance analysis http: //tau. uoregon. edu TAU 8
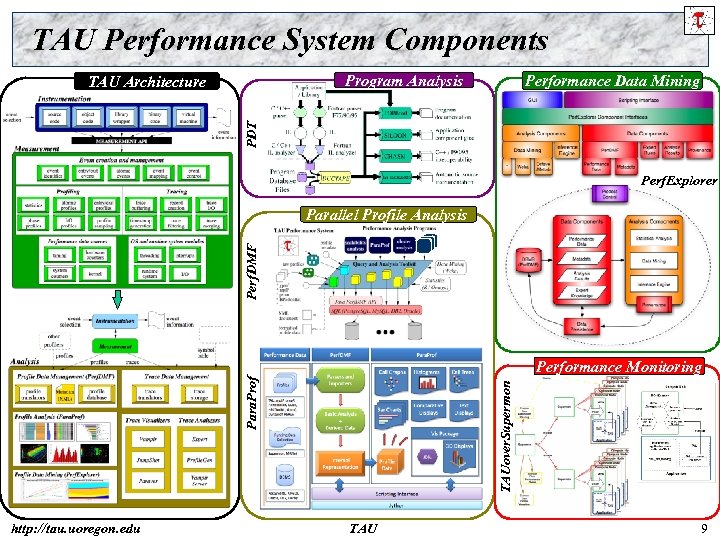 TAU Performance System Components Program Analysis Performance Data Mining PDT TAU Architecture Perf. Explorer Perf. DMF Parallel Profile Analysis http: //tau. uoregon. edu TAUover. Supermon Para. Prof Performance Monitoring TAU 9
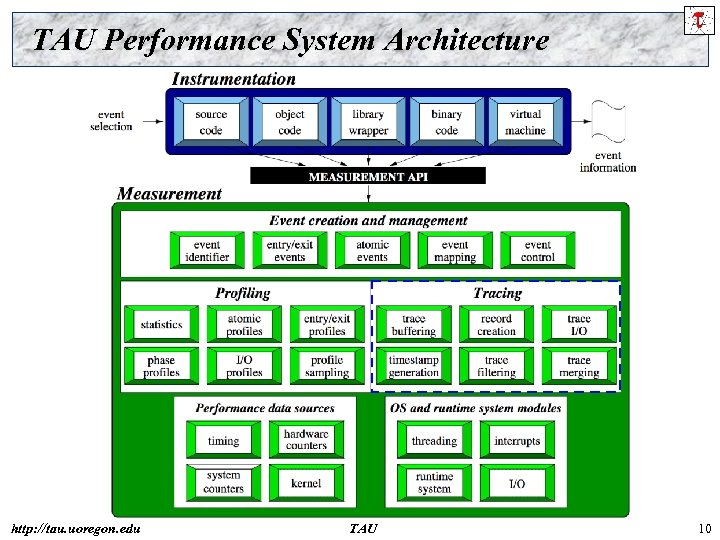 TAU Performance System Architecture http: //tau. uoregon. edu TAU 10
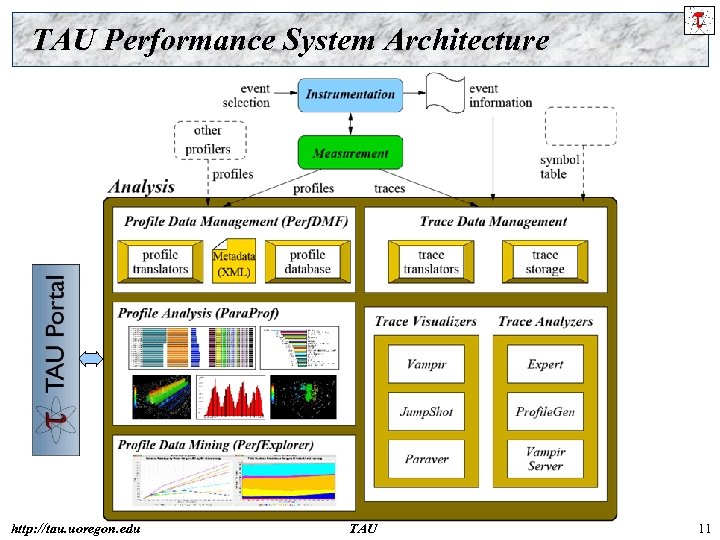 TAU Performance System Architecture http: //tau. uoregon. edu TAU 11
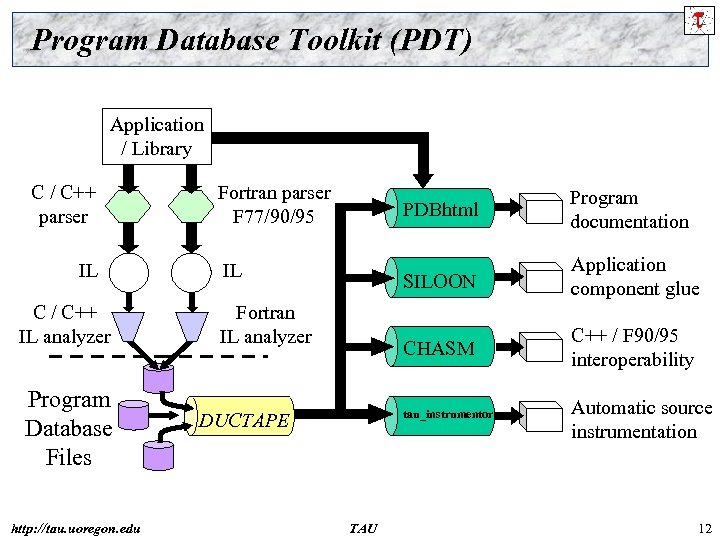 Program Database Toolkit (PDT) Application / Library C / C++ parser IL C / C++ IL analyzer Program Database Files http: //tau. uoregon. edu Fortran parser F 77/90/95 PDBhtml SILOON DUCTAPE TAU C++ / F 90/95 interoperability tau_instrumentor Fortran IL analyzer Application component glue CHASM IL Program documentation Automatic source instrumentation 12
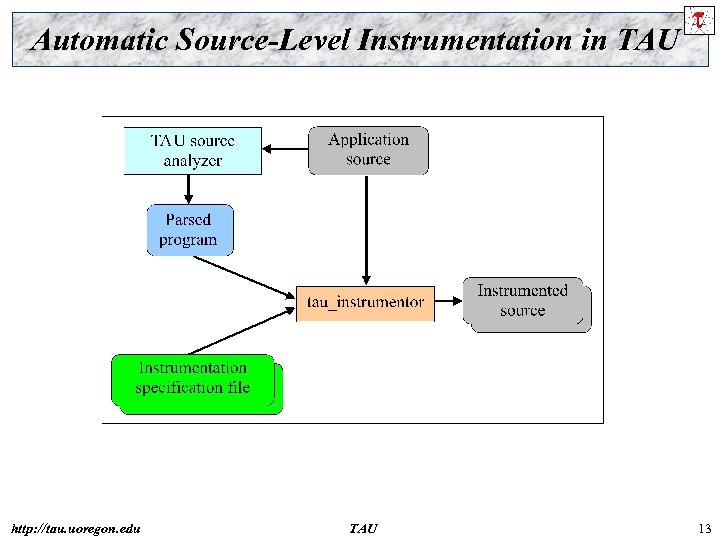 Automatic Source-Level Instrumentation in TAU http: //tau. uoregon. edu TAU 13
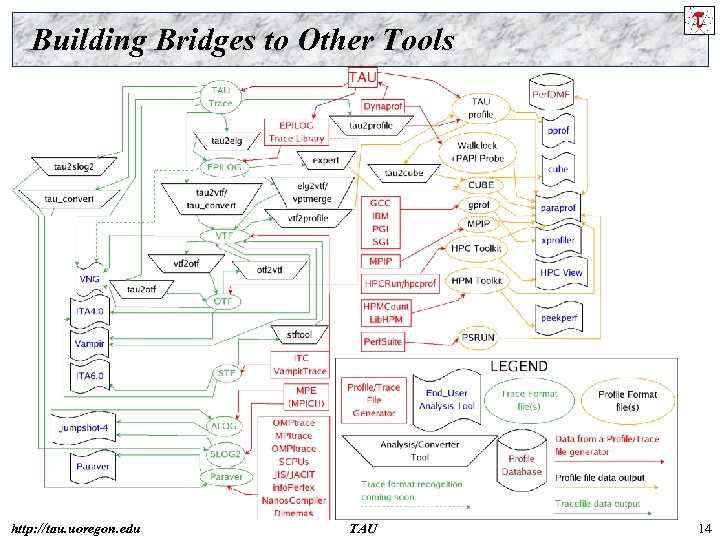 Building Bridges to Other Tools http: //tau. uoregon. edu TAU 14
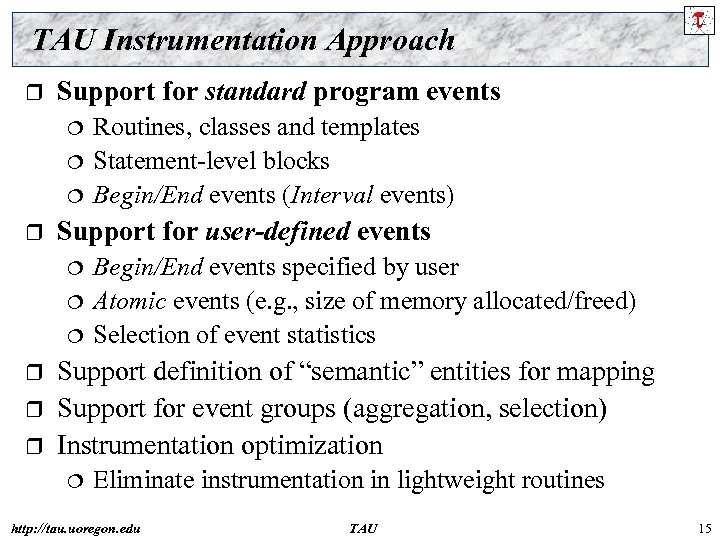 TAU Instrumentation Approach r Support for standard program events r Support for user-defined events r r r Routines, classes and templates Statement-level blocks Begin/End events (Interval events) Begin/End events specified by user Atomic events (e. g. , size of memory allocated/freed) Selection of event statistics Support definition of “semantic” entities for mapping Support for event groups (aggregation, selection) Instrumentation optimization Eliminate instrumentation in lightweight routines http: //tau. uoregon. edu TAU 15
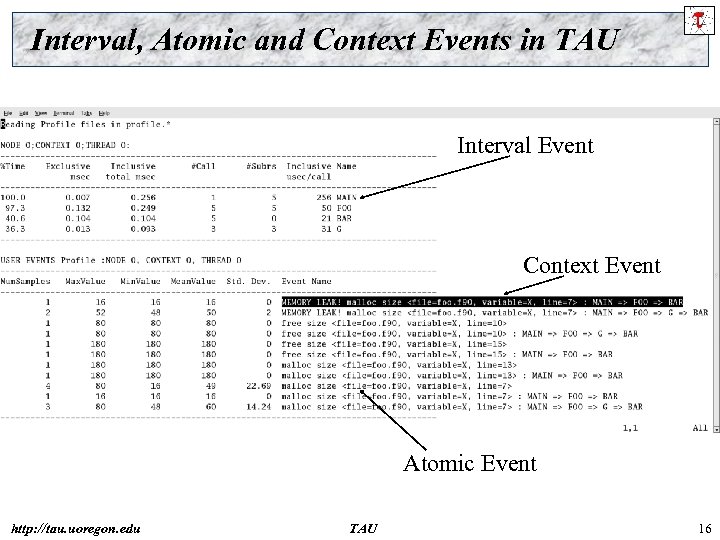 Interval, Atomic and Context Events in TAU Interval Event Context Event Atomic Event http: //tau. uoregon. edu TAU 16
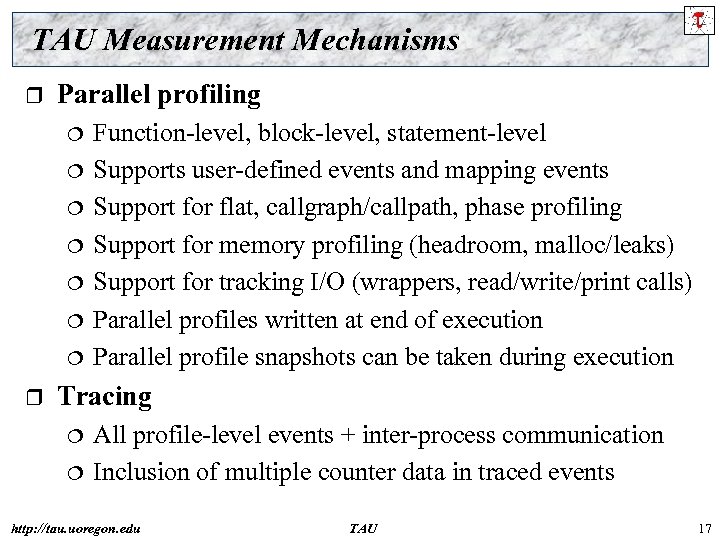 TAU Measurement Mechanisms r Parallel profiling r Function-level, block-level, statement-level Supports user-defined events and mapping events Support for flat, callgraph/callpath, phase profiling Support for memory profiling (headroom, malloc/leaks) Support for tracking I/O (wrappers, read/write/print calls) Parallel profiles written at end of execution Parallel profile snapshots can be taken during execution Tracing All profile-level events + inter-process communication Inclusion of multiple counter data in traced events http: //tau. uoregon. edu TAU 17
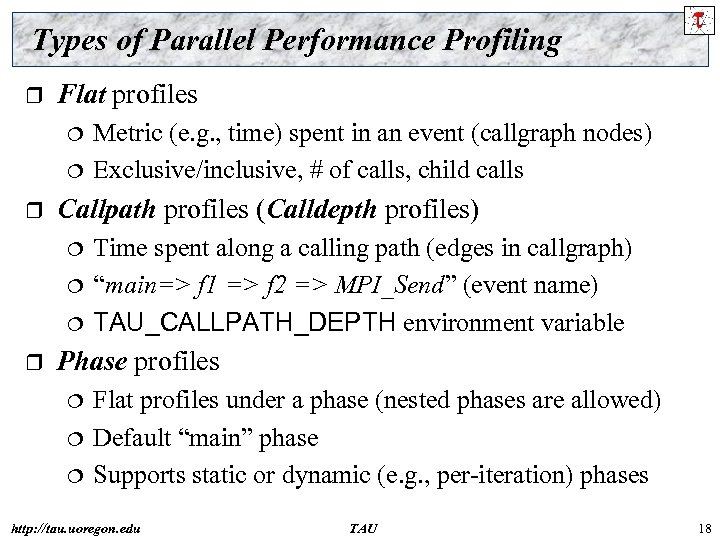 Types of Parallel Performance Profiling r Flat profiles r Callpath profiles (Calldepth profiles) r Metric (e. g. , time) spent in an event (callgraph nodes) Exclusive/inclusive, # of calls, child calls Time spent along a calling path (edges in callgraph) “main=> f 1 => f 2 => MPI_Send” (event name) TAU_CALLPATH_DEPTH environment variable Phase profiles Flat profiles under a phase (nested phases are allowed) Default “main” phase Supports static or dynamic (e. g. , per-iteration) phases http: //tau. uoregon. edu TAU 18
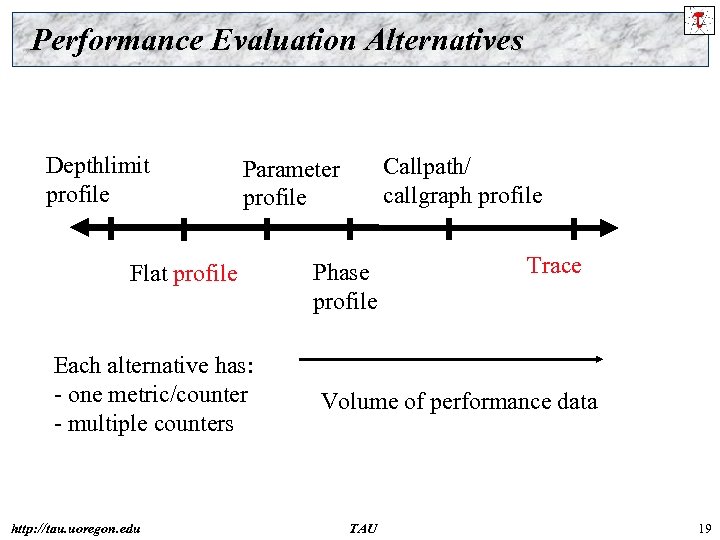 Performance Evaluation Alternatives Depthlimit profile Flat profile Each alternative has: - one metric/counter - multiple counters http: //tau. uoregon. edu Callpath/ callgraph profile Parameter profile Phase profile Trace Volume of performance data TAU 19
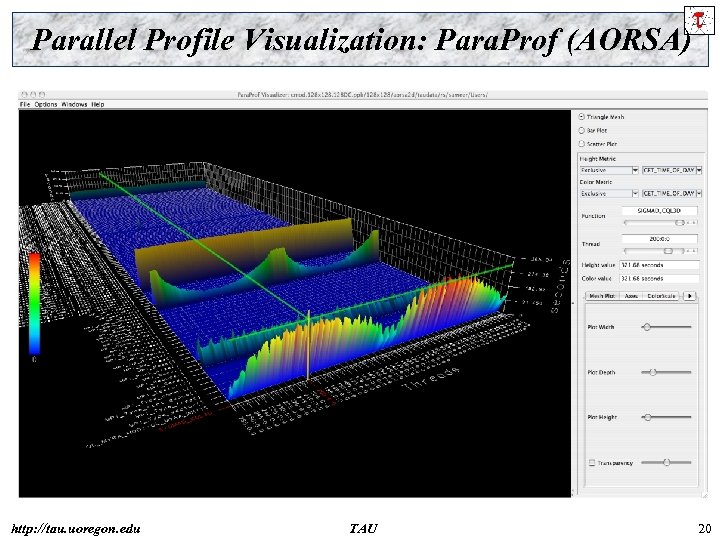 Parallel Profile Visualization: Para. Prof (AORSA) http: //tau. uoregon. edu TAU 20
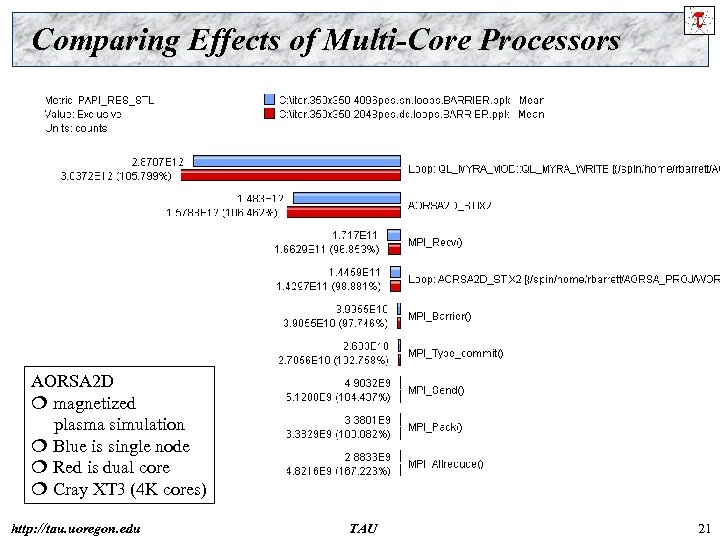 Comparing Effects of Multi-Core Processors AORSA 2 D magnetized plasma simulation Blue is single node Red is dual core Cray XT 3 (4 K cores) http: //tau. uoregon. edu TAU 21
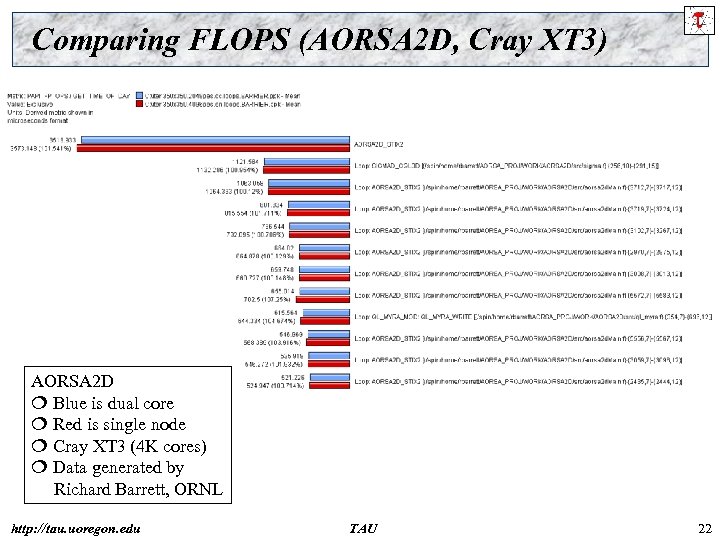 Comparing FLOPS (AORSA 2 D, Cray XT 3) AORSA 2 D Blue is dual core Red is single node Cray XT 3 (4 K cores) Data generated by Richard Barrett, ORNL http: //tau. uoregon. edu TAU 22
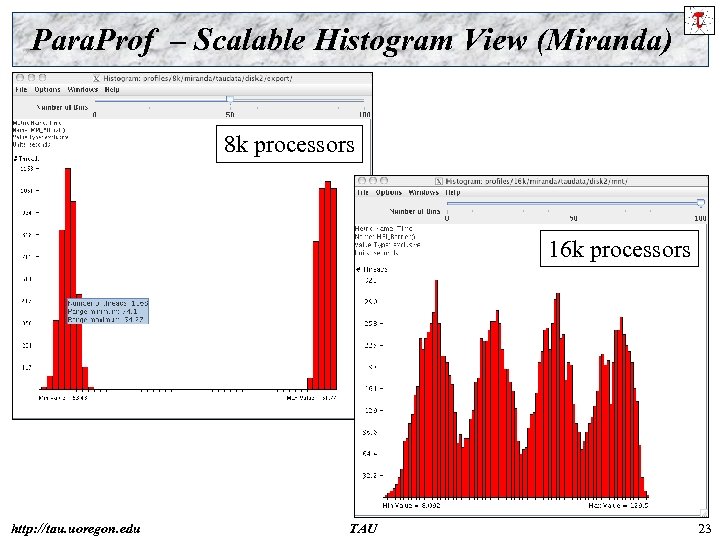 Para. Prof – Scalable Histogram View (Miranda) 8 k processors 16 k processors http: //tau. uoregon. edu TAU 23
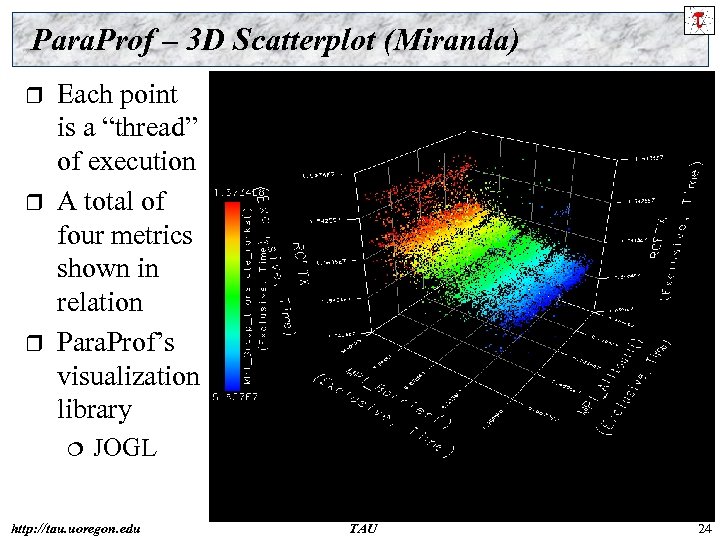 Para. Prof – 3 D Scatterplot (Miranda) r r r Each point is a “thread” of execution A total of four metrics shown in relation Para. Prof’s visualization library JOGL http: //tau. uoregon. edu TAU 24
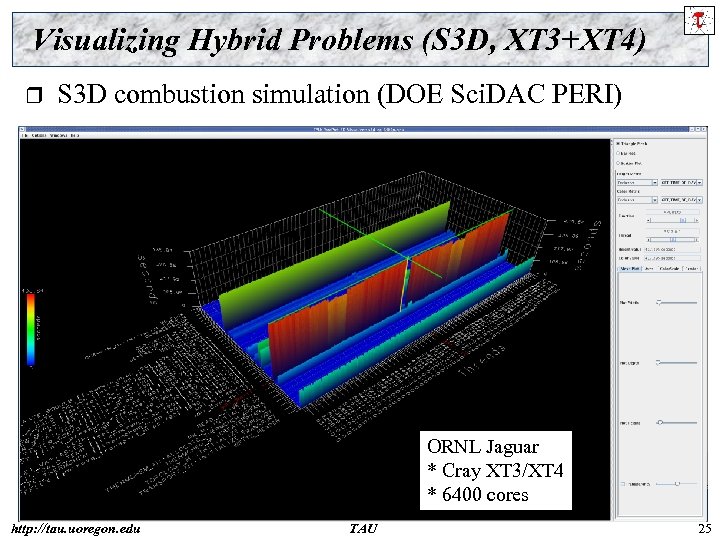 Visualizing Hybrid Problems (S 3 D, XT 3+XT 4) r S 3 D combustion simulation (DOE Sci. DAC PERI) ORNL Jaguar * Cray XT 3/XT 4 * 6400 cores http: //tau. uoregon. edu TAU 25
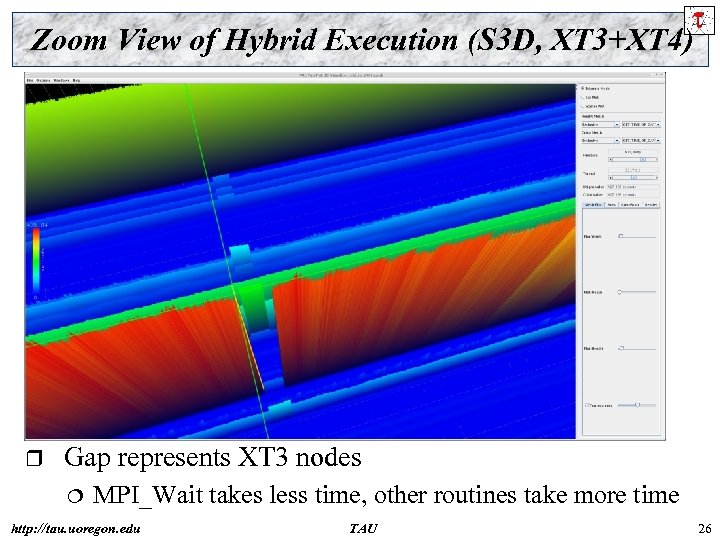 Zoom View of Hybrid Execution (S 3 D, XT 3+XT 4) r Gap represents XT 3 nodes MPI_Wait takes less time, other routines take more time http: //tau. uoregon. edu TAU 26
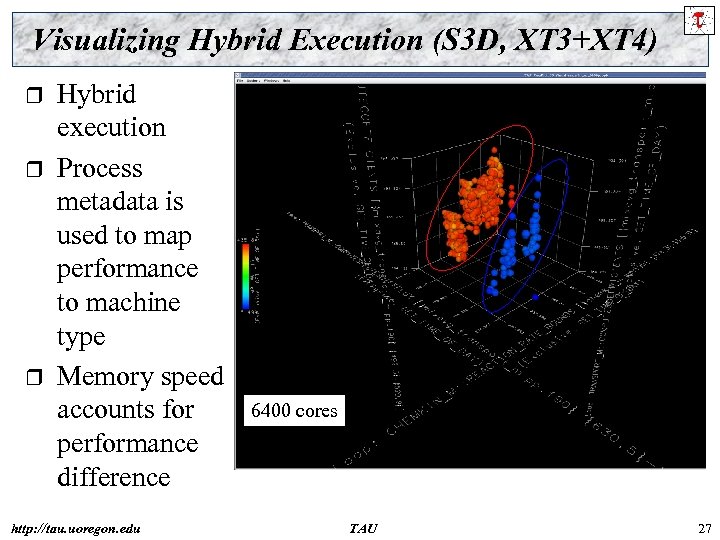 Visualizing Hybrid Execution (S 3 D, XT 3+XT 4) r r r Hybrid execution Process metadata is used to map performance to machine type Memory speed accounts for performance difference http: //tau. uoregon. edu 6400 cores TAU 27
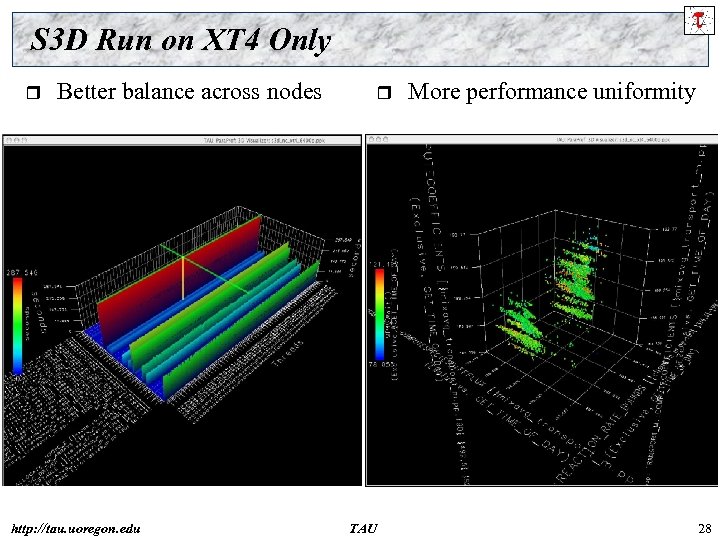 S 3 D Run on XT 4 Only r Better balance across nodes http: //tau. uoregon. edu r TAU More performance uniformity 28
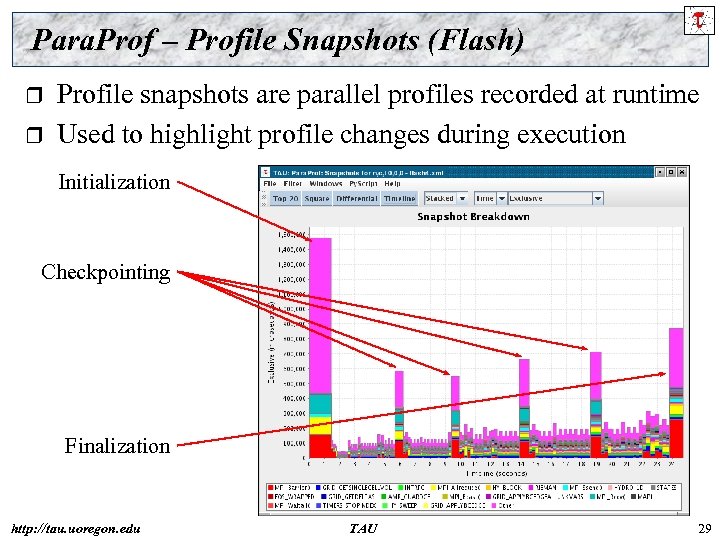 Para. Prof – Profile Snapshots (Flash) r r Profile snapshots are parallel profiles recorded at runtime Used to highlight profile changes during execution Initialization Checkpointing Finalization http: //tau. uoregon. edu TAU 29
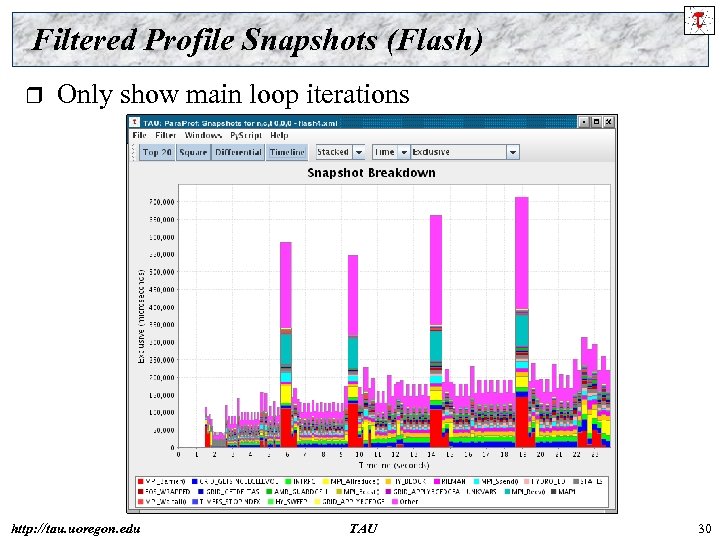 Filtered Profile Snapshots (Flash) r Only show main loop iterations http: //tau. uoregon. edu TAU 30
 Profile Snapshots with Breakdown (Flash) r Breakdown as a percentage http: //tau. uoregon. edu TAU 31
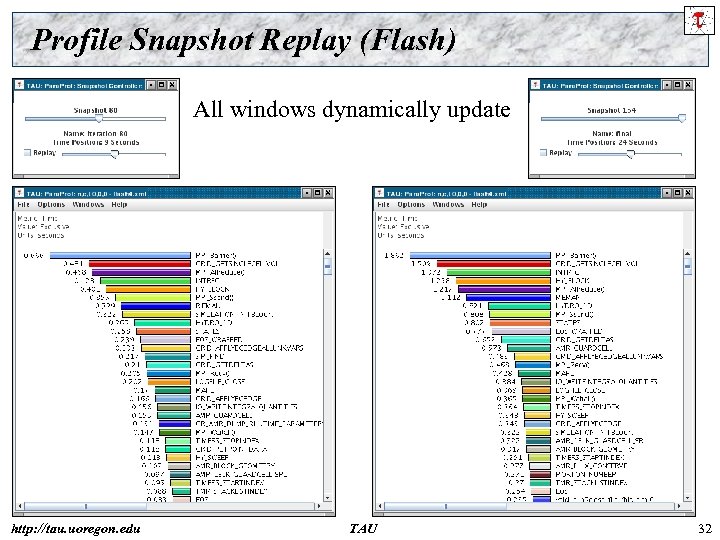 Profile Snapshot Replay (Flash) All windows dynamically update http: //tau. uoregon. edu TAU 32
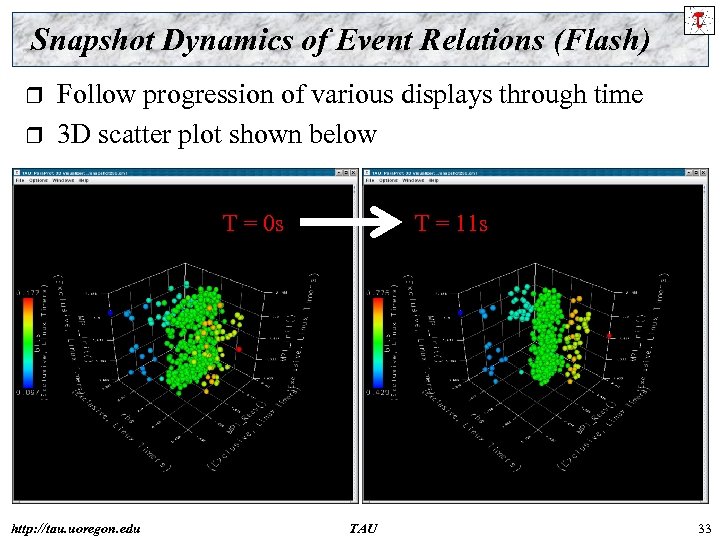 Snapshot Dynamics of Event Relations (Flash) r r Follow progression of various displays through time 3 D scatter plot shown below T = 0 s http: //tau. uoregon. edu T = 11 s TAU 33
 TAU: Usage Scenarios http: //tau. uoregon. edu TAU 34
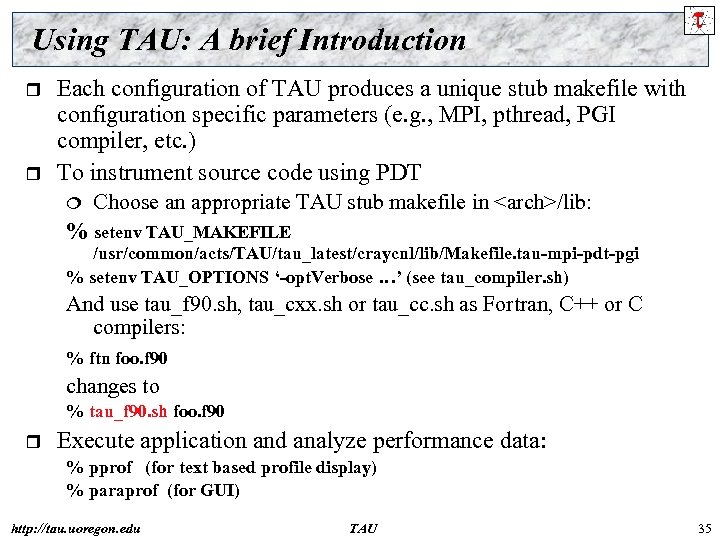 Using TAU: A brief Introduction r r Each configuration of TAU produces a unique stub makefile with configuration specific parameters (e. g. , MPI, pthread, PGI compiler, etc. ) To instrument source code using PDT Choose an appropriate TAU stub makefile in
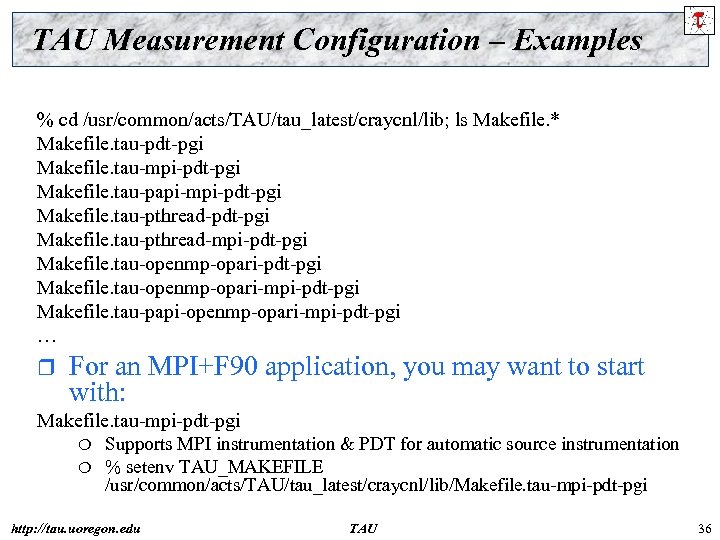 TAU Measurement Configuration – Examples % cd /usr/common/acts/TAU/tau_latest/craycnl/lib; ls Makefile. * Makefile. tau-pdt-pgi Makefile. tau-mpi-pdt-pgi Makefile. tau-papi-mpi-pdt-pgi Makefile. tau-pthread-mpi-pdt-pgi Makefile. tau-openmp-opari-mpi-pdt-pgi Makefile. tau-papi-openmp-opari-mpi-pdt-pgi … r For an MPI+F 90 application, you may want to start with: Makefile. tau-mpi-pdt-pgi Supports MPI instrumentation & PDT for automatic source instrumentation % setenv TAU_MAKEFILE /usr/common/acts/TAU/tau_latest/craycnl/lib/Makefile. tau-mpi-pdt-pgi http: //tau. uoregon. edu TAU 36
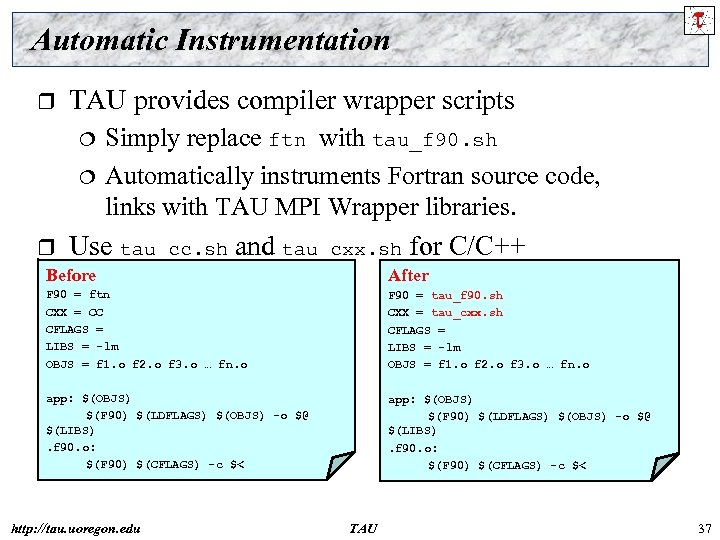 Automatic Instrumentation r TAU provides compiler wrapper scripts r Simply replace ftn with tau_f 90. sh Automatically instruments Fortran source code, links with TAU MPI Wrapper libraries. Use tau_cc. sh and tau_cxx. sh for C/C++ Before After F 90 = ftn CXX = CC CFLAGS = LIBS = -lm OBJS = f 1. o f 2. o f 3. o … fn. o F 90 = tau_f 90. sh CXX = tau_cxx. sh CFLAGS = LIBS = -lm OBJS = f 1. o f 2. o f 3. o … fn. o app: $(OBJS) $(F 90) $(LDFLAGS) $(OBJS) -o $@ $(LIBS). f 90. o: $(F 90) $(CFLAGS) -c $< http: //tau. uoregon. edu TAU 37
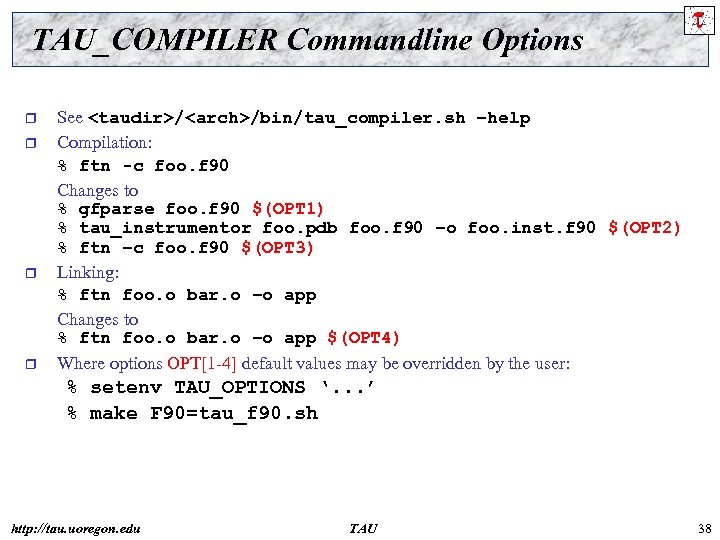 TAU_COMPILER Commandline Options r r See
![Compile-Time Environment Variables r Optional parameters for TAU_OPTIONS: [tau_compiler. sh –help] -opt. Verbose Turn Compile-Time Environment Variables r Optional parameters for TAU_OPTIONS: [tau_compiler. sh –help] -opt. Verbose Turn](https://present5.com/presentation/ffec7ff690bc8986829576963f9fadb3/image-39.jpg) Compile-Time Environment Variables r Optional parameters for TAU_OPTIONS: [tau_compiler. sh –help] -opt. Verbose Turn on verbose debugging messages -opt. Comp. Inst Use compiler based instrumentation -opt. Detect. Memory. Leaks Turn on debugging memory allocations/ de-allocations to track leaks -opt. Keep. Files Does not remove intermediate. pdb and. inst. * files -opt. Pre. Process Preprocess Fortran sources before instrumentation -opt. Tau. Select. File="" Specify selective instrumentation file for tau_instrumentor -opt. Linking="" Options passed to the linker. Typically $(TAU_MPI_FLIBS) $(TAU_CXXLIBS) -opt. Compile="" Options passed to the compiler. Typically $(TAU_MPI_INCLUDE) $(TAU_DEFS) -opt. Pdt. F 95 Opts="" Add options for Fortran parser in PDT (f 95 parse/gfparse) -opt. Pdt. F 95 Reset="" Reset options for Fortran parser in PDT (f 95 parse/gfparse) -opt. Pdt. COpts="" Options for C parser in PDT (cparse). Typically $(TAU_MPI_INCLUDE) $(TAU_DEFS) -opt. Pdt. Cxx. Opts="" Options for C++ parser in PDT (cxxparse). Typically $(TAU_MPI_INCLUDE) $(TAU_DEFS). . . http: //tau. uoregon. edu TAU 39
Compile-Time Environment Variables r Optional parameters for TAU_OPTIONS: [tau_compiler. sh –help] -opt. Verbose Turn on verbose debugging messages -opt. Comp. Inst Use compiler based instrumentation -opt. Detect. Memory. Leaks Turn on debugging memory allocations/ de-allocations to track leaks -opt. Keep. Files Does not remove intermediate. pdb and. inst. * files -opt. Pre. Process Preprocess Fortran sources before instrumentation -opt. Tau. Select. File="" Specify selective instrumentation file for tau_instrumentor -opt. Linking="" Options passed to the linker. Typically $(TAU_MPI_FLIBS) $(TAU_CXXLIBS) -opt. Compile="" Options passed to the compiler. Typically $(TAU_MPI_INCLUDE) $(TAU_DEFS) -opt. Pdt. F 95 Opts="" Add options for Fortran parser in PDT (f 95 parse/gfparse) -opt. Pdt. F 95 Reset="" Reset options for Fortran parser in PDT (f 95 parse/gfparse) -opt. Pdt. COpts="" Options for C parser in PDT (cparse). Typically $(TAU_MPI_INCLUDE) $(TAU_DEFS) -opt. Pdt. Cxx. Opts="" Options for C++ parser in PDT (cxxparse). Typically $(TAU_MPI_INCLUDE) $(TAU_DEFS). . . http: //tau. uoregon. edu TAU 39
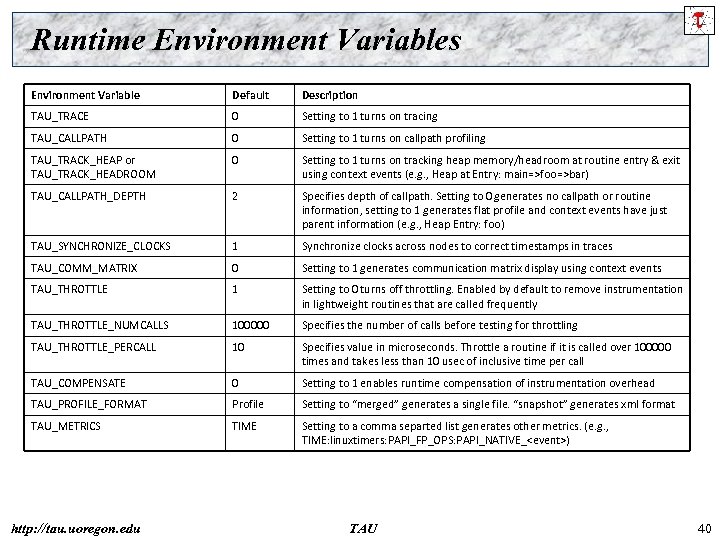 Runtime Environment Variables Environment Variable Default Description TAU_TRACE 0 Setting to 1 turns on tracing TAU_CALLPATH 0 Setting to 1 turns on callpath profiling TAU_TRACK_HEAP or TAU_TRACK_HEADROOM 0 Setting to 1 turns on tracking heap memory/headroom at routine entry & exit using context events (e. g. , Heap at Entry: main=>foo=>bar) TAU_CALLPATH_DEPTH 2 Specifies depth of callpath. Setting to 0 generates no callpath or routine information, setting to 1 generates flat profile and context events have just parent information (e. g. , Heap Entry: foo) TAU_SYNCHRONIZE_CLOCKS 1 Synchronize clocks across nodes to correct timestamps in traces TAU_COMM_MATRIX 0 Setting to 1 generates communication matrix display using context events TAU_THROTTLE 1 Setting to 0 turns off throttling. Enabled by default to remove instrumentation in lightweight routines that are called frequently TAU_THROTTLE_NUMCALLS 100000 Specifies the number of calls before testing for throttling TAU_THROTTLE_PERCALL 10 Specifies value in microseconds. Throttle a routine if it is called over 100000 times and takes less than 10 usec of inclusive time per call TAU_COMPENSATE 0 Setting to 1 enables runtime compensation of instrumentation overhead TAU_PROFILE_FORMAT Profile Setting to “merged” generates a single file. “snapshot” generates xml format TAU_METRICS TIME Setting to a comma separted list generates other metrics. (e. g. , TIME: linuxtimers: PAPI_FP_OPS: PAPI_NATIVE_
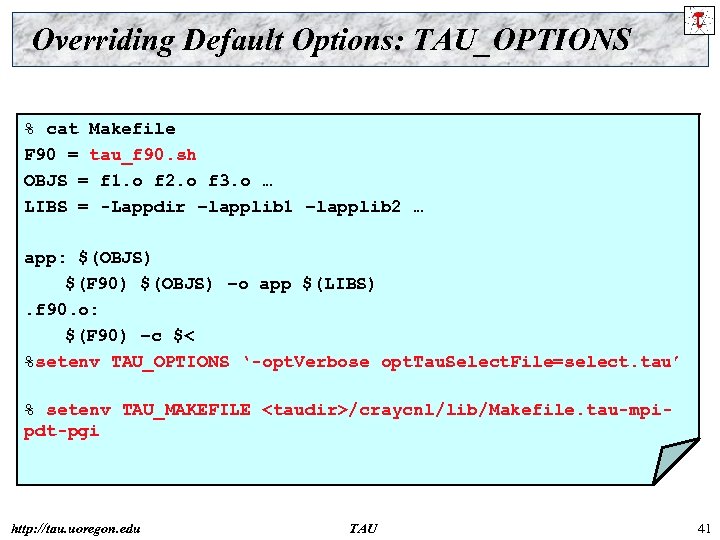 Overriding Default Options: TAU_OPTIONS % cat Makefile F 90 = tau_f 90. sh OBJS = f 1. o f 2. o f 3. o … LIBS = -Lappdir –lapplib 1 –lapplib 2 … app: $(OBJS) $(F 90) $(OBJS) –o app $(LIBS). f 90. o: $(F 90) –c $< %setenv TAU_OPTIONS ‘-opt. Verbose opt. Tau. Select. File=select. tau’ % setenv TAU_MAKEFILE
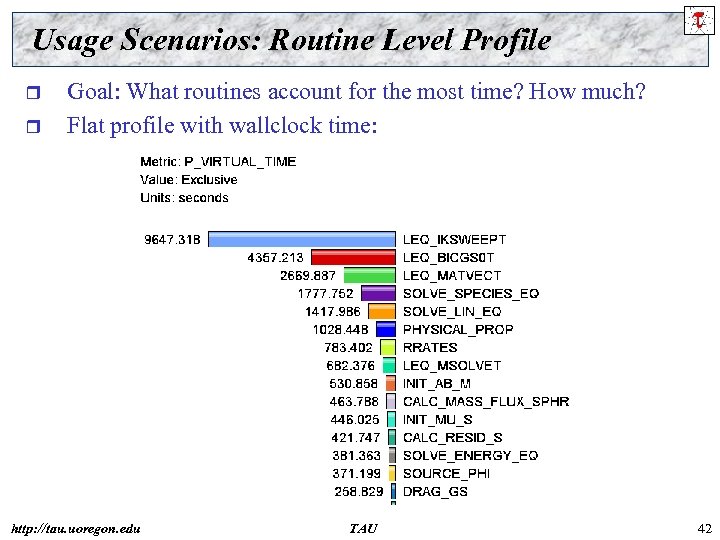 Usage Scenarios: Routine Level Profile r r Goal: What routines account for the most time? How much? Flat profile with wallclock time: http: //tau. uoregon. edu TAU 42
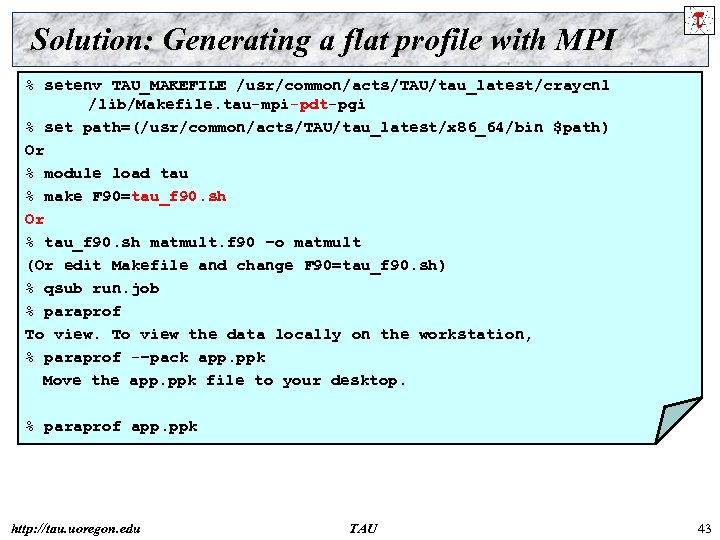 Solution: Generating a flat profile with MPI % setenv TAU_MAKEFILE /usr/common/acts/TAU/tau_latest/craycnl /lib/Makefile. tau-mpi-pdt-pgi % set path=(/usr/common/acts/TAU/tau_latest/x 86_64/bin $path) Or % module load tau % make F 90=tau_f 90. sh Or % tau_f 90. sh matmult. f 90 –o matmult (Or edit Makefile and change F 90=tau_f 90. sh) % qsub run. job % paraprof To view the data locally on the workstation, % paraprof -–pack app. ppk Move the app. ppk file to your desktop. % paraprof app. ppk http: //tau. uoregon. edu TAU 43
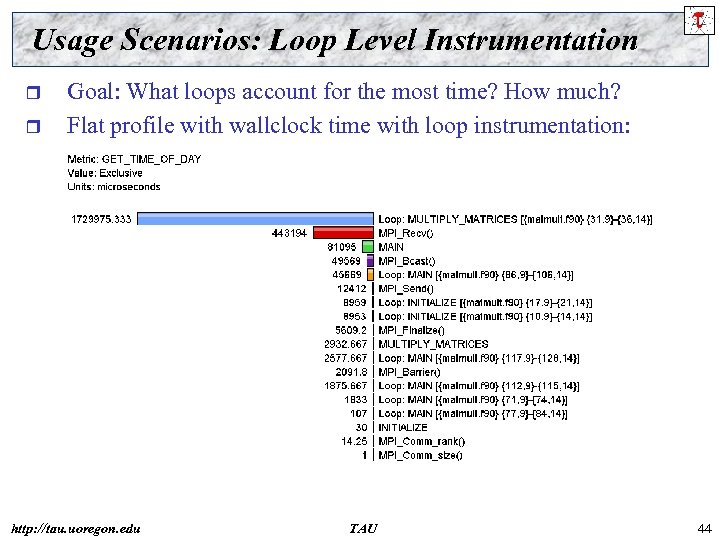 Usage Scenarios: Loop Level Instrumentation r r Goal: What loops account for the most time? How much? Flat profile with wallclock time with loop instrumentation: http: //tau. uoregon. edu TAU 44
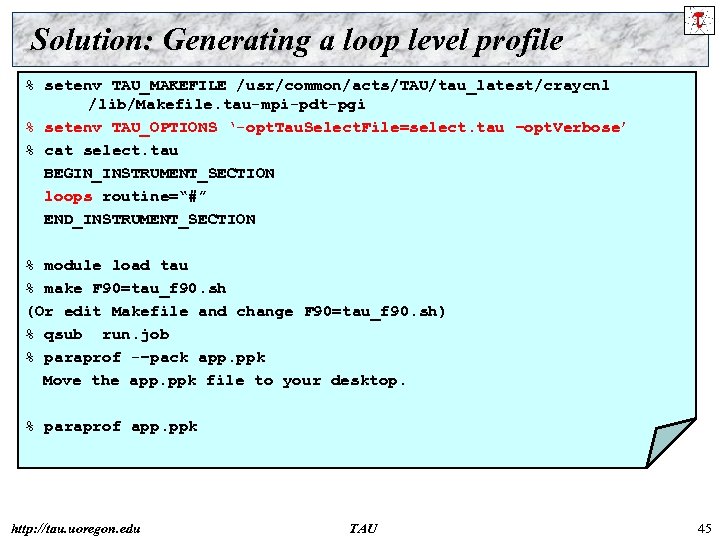 Solution: Generating a loop level profile % setenv TAU_MAKEFILE /usr/common/acts/TAU/tau_latest/craycnl /lib/Makefile. tau-mpi-pdt-pgi % setenv TAU_OPTIONS ‘-opt. Tau. Select. File=select. tau –opt. Verbose’ % cat select. tau BEGIN_INSTRUMENT_SECTION loops routine=“#” END_INSTRUMENT_SECTION % module load tau % make F 90=tau_f 90. sh (Or edit Makefile and change F 90=tau_f 90. sh) % qsub run. job % paraprof -–pack app. ppk Move the app. ppk file to your desktop. % paraprof app. ppk http: //tau. uoregon. edu TAU 45
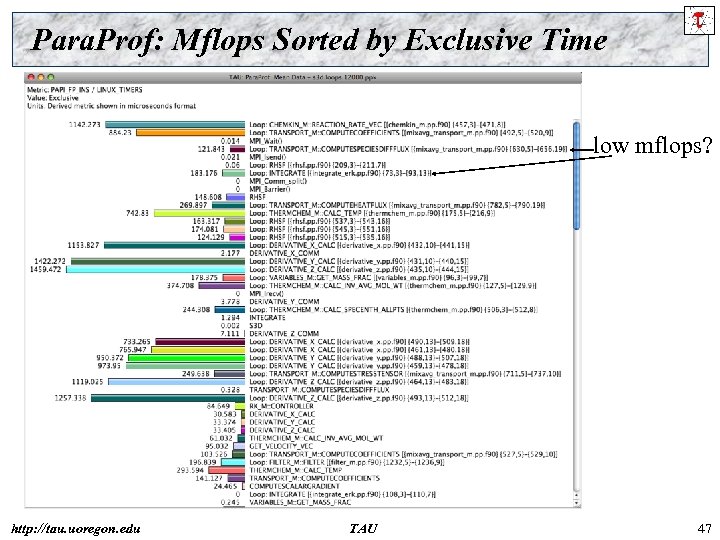
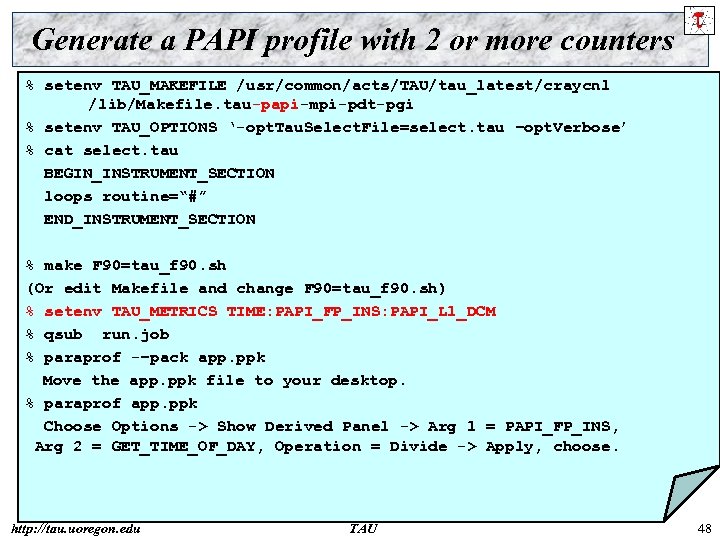
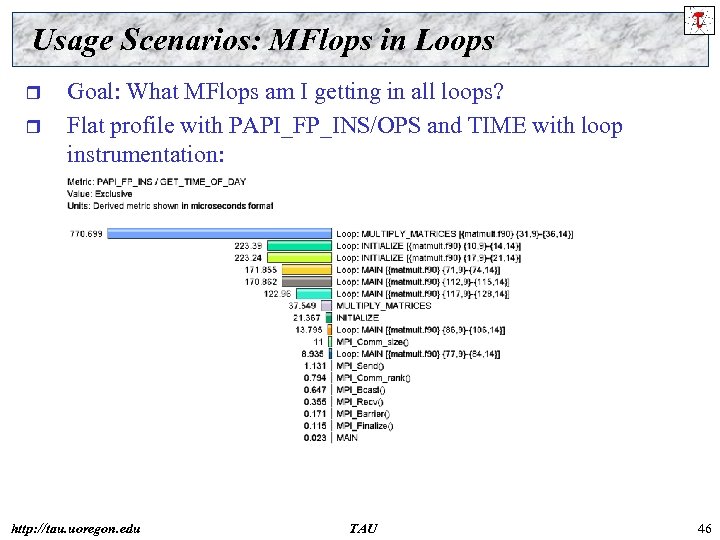 Usage Scenarios: MFlops in Loops r r Goal: What MFlops am I getting in all loops? Flat profile with PAPI_FP_INS/OPS and TIME with loop instrumentation: http: //tau. uoregon. edu TAU 46
 Para. Prof: Mflops Sorted by Exclusive Time low mflops? http: //tau. uoregon. edu TAU 47
 Generate a PAPI profile with 2 or more counters % setenv TAU_MAKEFILE /usr/common/acts/TAU/tau_latest/craycnl /lib/Makefile. tau-papi-mpi-pdt-pgi % setenv TAU_OPTIONS ‘-opt. Tau. Select. File=select. tau –opt. Verbose’ % cat select. tau BEGIN_INSTRUMENT_SECTION loops routine=“#” END_INSTRUMENT_SECTION % make F 90=tau_f 90. sh (Or edit Makefile and change F 90=tau_f 90. sh) % setenv TAU_METRICS TIME: PAPI_FP_INS: PAPI_L 1_DCM % qsub run. job % paraprof -–pack app. ppk Move the app. ppk file to your desktop. % paraprof app. ppk Choose Options -> Show Derived Panel -> Arg 1 = PAPI_FP_INS, Arg 2 = GET_TIME_OF_DAY, Operation = Divide -> Apply, choose. http: //tau. uoregon. edu TAU 48
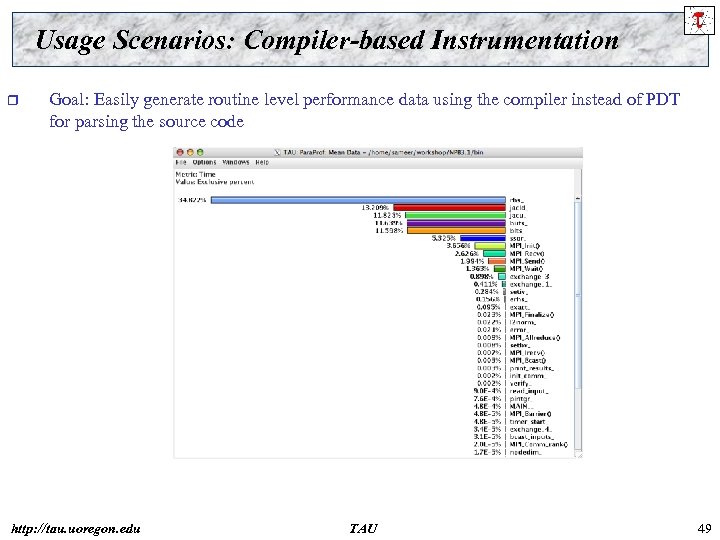 Usage Scenarios: Compiler-based Instrumentation r Goal: Easily generate routine level performance data using the compiler instead of PDT for parsing the source code http: //tau. uoregon. edu TAU 49
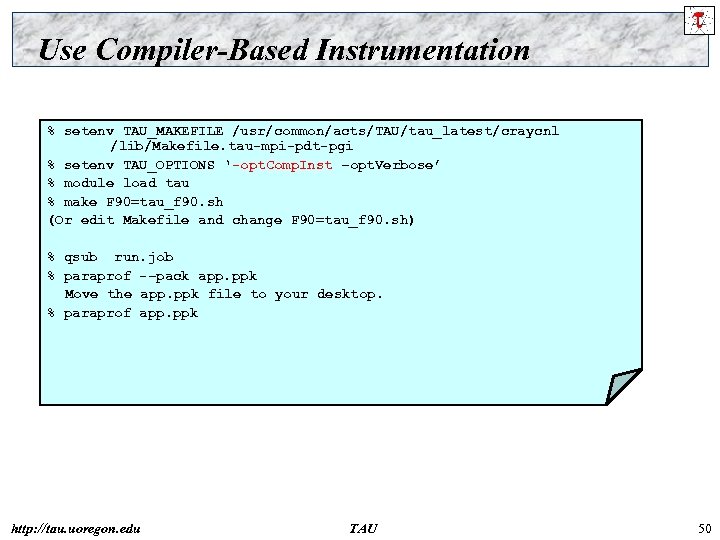 Use Compiler-Based Instrumentation % setenv TAU_MAKEFILE /usr/common/acts/TAU/tau_latest/craycnl /lib/Makefile. tau-mpi-pdt-pgi % setenv TAU_OPTIONS ‘-opt. Comp. Inst –opt. Verbose’ % module load tau % make F 90=tau_f 90. sh (Or edit Makefile and change F 90=tau_f 90. sh) % qsub run. job % paraprof -–pack app. ppk Move the app. ppk file to your desktop. % paraprof app. ppk http: //tau. uoregon. edu TAU 50
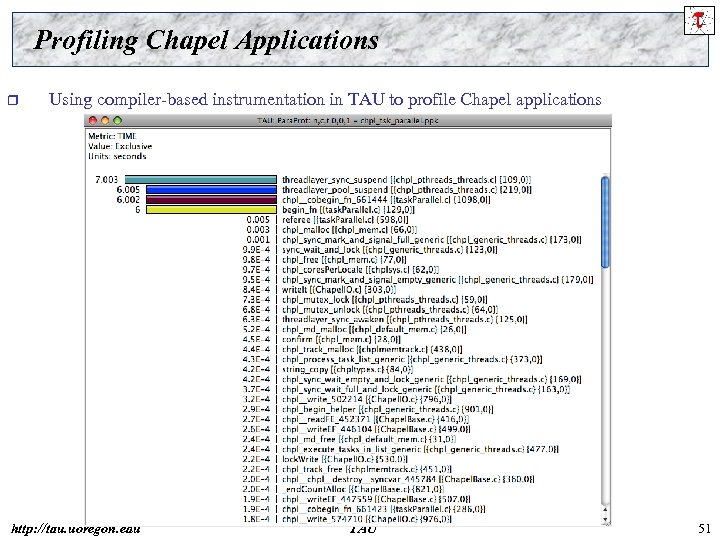 Profiling Chapel Applications r Using compiler-based instrumentation in TAU to profile Chapel applications http: //tau. uoregon. edu TAU 51
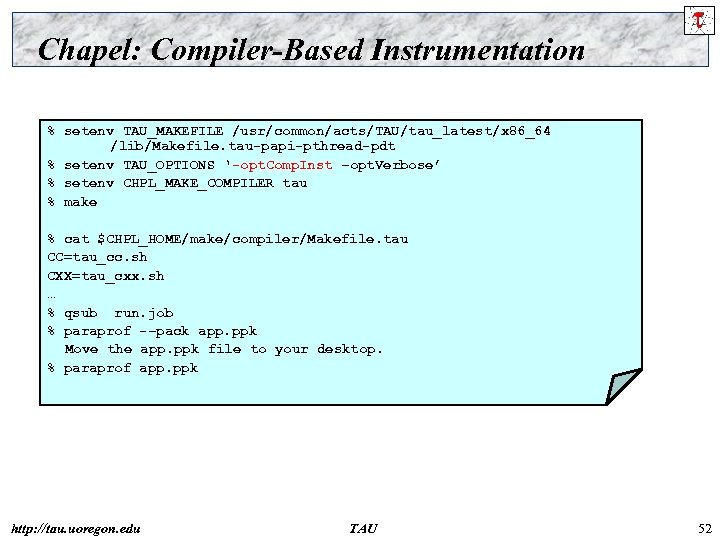 Chapel: Compiler-Based Instrumentation % setenv TAU_MAKEFILE /usr/common/acts/TAU/tau_latest/x 86_64 /lib/Makefile. tau-papi-pthread-pdt % setenv TAU_OPTIONS ‘-opt. Comp. Inst –opt. Verbose’ % setenv CHPL_MAKE_COMPILER tau % make % cat $CHPL_HOME/make/compiler/Makefile. tau CC=tau_cc. sh CXX=tau_cxx. sh … % qsub run. job % paraprof -–pack app. ppk Move the app. ppk file to your desktop. % paraprof app. ppk http: //tau. uoregon. edu TAU 52
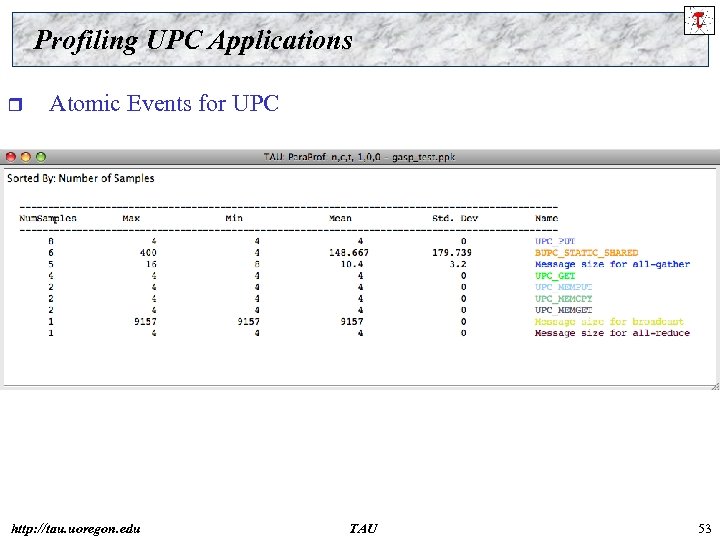 Profiling UPC Applications r Atomic Events for UPC http: //tau. uoregon. edu TAU 53
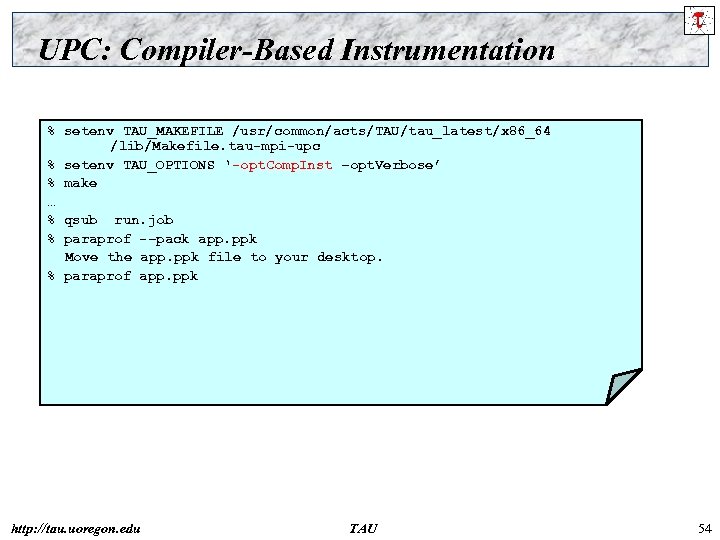 UPC: Compiler-Based Instrumentation % setenv TAU_MAKEFILE /usr/common/acts/TAU/tau_latest/x 86_64 /lib/Makefile. tau-mpi-upc % setenv TAU_OPTIONS ‘-opt. Comp. Inst –opt. Verbose’ % make … % qsub run. job % paraprof -–pack app. ppk Move the app. ppk file to your desktop. % paraprof app. ppk http: //tau. uoregon. edu TAU 54
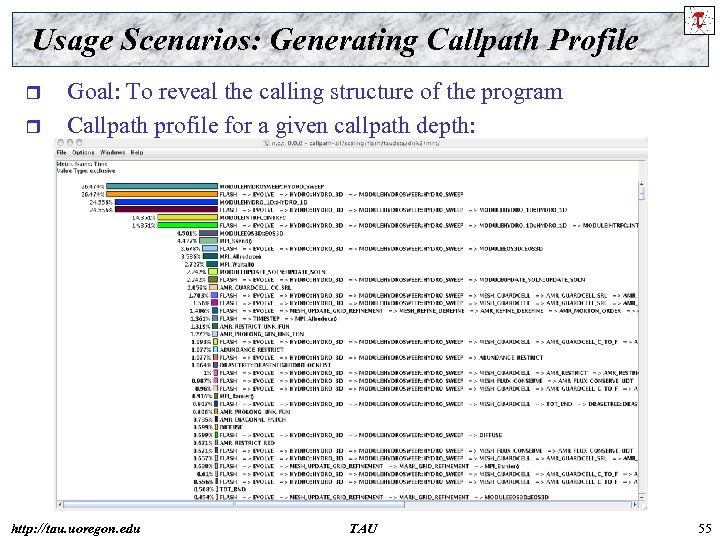 Usage Scenarios: Generating Callpath Profile r r Goal: To reveal the calling structure of the program Callpath profile for a given callpath depth: http: //tau. uoregon. edu TAU 55
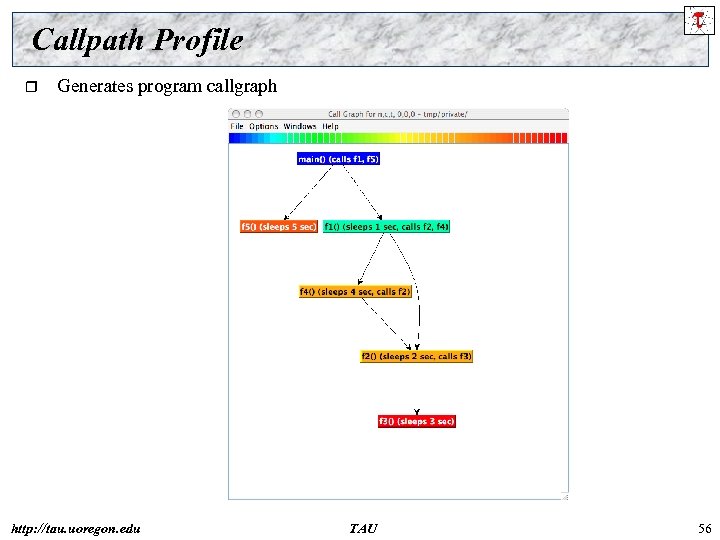 Callpath Profile r Generates program callgraph http: //tau. uoregon. edu TAU 56
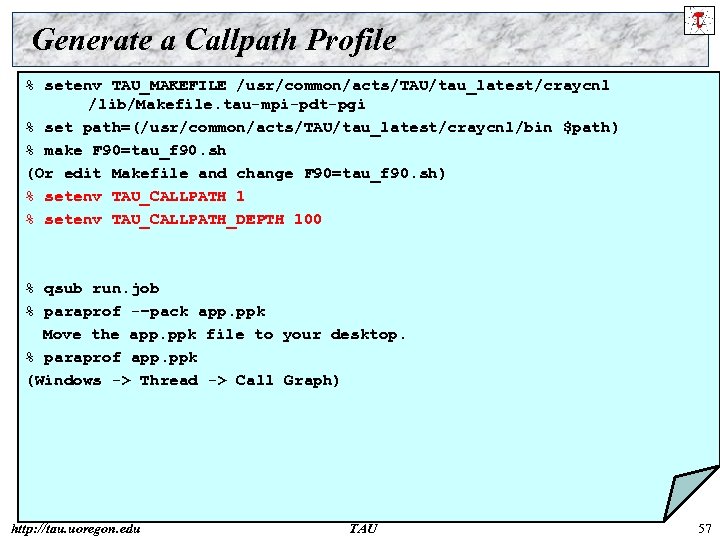 Generate a Callpath Profile % setenv TAU_MAKEFILE /usr/common/acts/TAU/tau_latest/craycnl /lib/Makefile. tau-mpi-pdt-pgi % set path=(/usr/common/acts/TAU/tau_latest/craycnl/bin $path) % make F 90=tau_f 90. sh (Or edit Makefile and change F 90=tau_f 90. sh) % setenv TAU_CALLPATH 1 % setenv TAU_CALLPATH_DEPTH 100 % qsub run. job % paraprof -–pack app. ppk Move the app. ppk file to your desktop. % paraprof app. ppk (Windows -> Thread -> Call Graph) http: //tau. uoregon. edu TAU 57
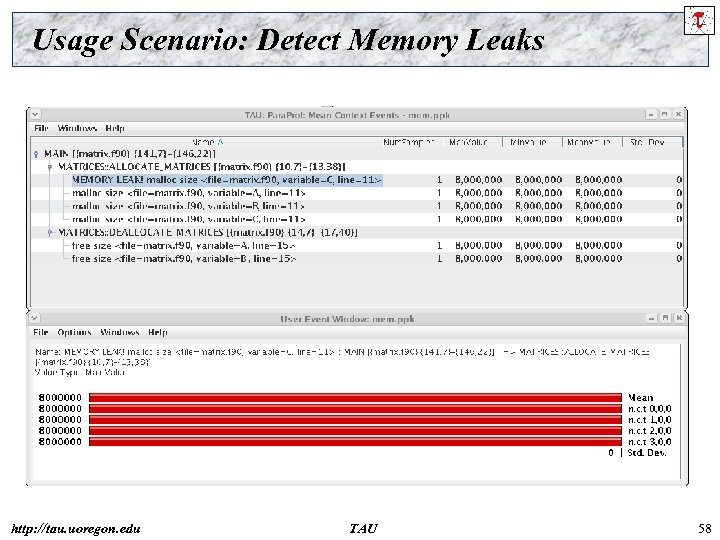 Usage Scenario: Detect Memory Leaks http: //tau. uoregon. edu TAU 58
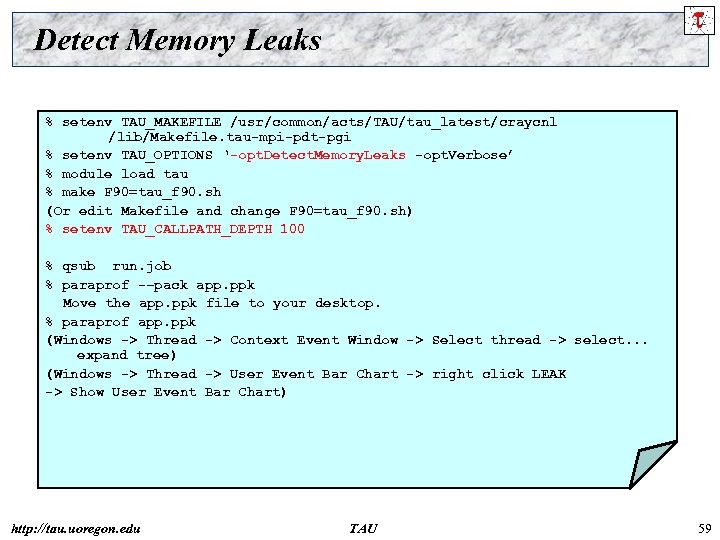 Detect Memory Leaks % setenv TAU_MAKEFILE /usr/common/acts/TAU/tau_latest/craycnl /lib/Makefile. tau-mpi-pdt-pgi % setenv TAU_OPTIONS ‘-opt. Detect. Memory. Leaks -opt. Verbose’ % module load tau % make F 90=tau_f 90. sh (Or edit Makefile and change F 90=tau_f 90. sh) % setenv TAU_CALLPATH_DEPTH 100 % qsub run. job % paraprof -–pack app. ppk Move the app. ppk file to your desktop. % paraprof app. ppk (Windows -> Thread -> Context Event Window -> Select thread -> select. . . expand tree) (Windows -> Thread -> User Event Bar Chart -> right click LEAK -> Show User Event Bar Chart) http: //tau. uoregon. edu TAU 59
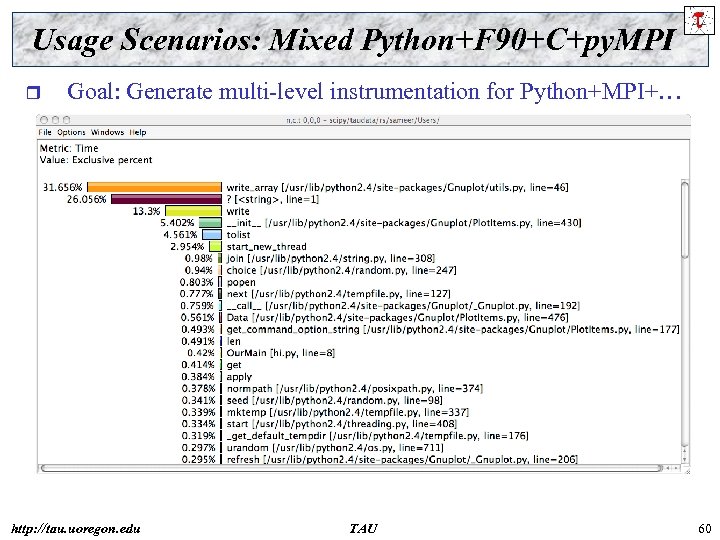 Usage Scenarios: Mixed Python+F 90+C+py. MPI r Goal: Generate multi-level instrumentation for Python+MPI+… http: //tau. uoregon. edu TAU 60
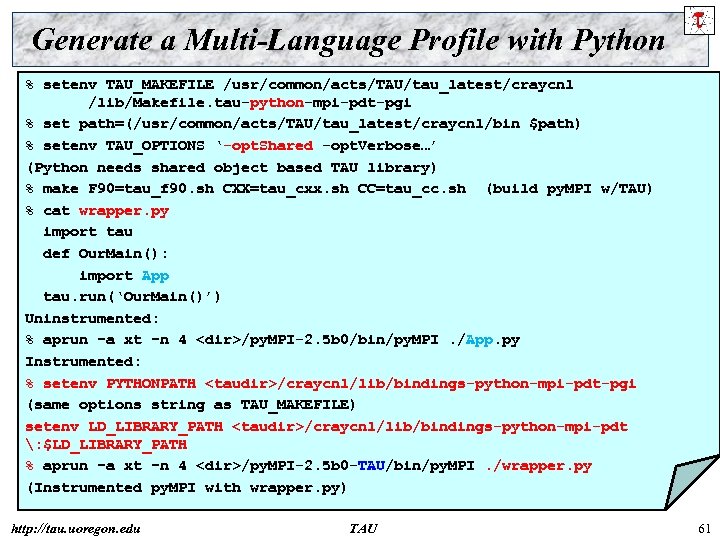 Generate a Multi-Language Profile with Python % setenv TAU_MAKEFILE /usr/common/acts/TAU/tau_latest/craycnl /lib/Makefile. tau-python-mpi-pdt-pgi % set path=(/usr/common/acts/TAU/tau_latest/craycnl/bin $path) % setenv TAU_OPTIONS ‘-opt. Shared -opt. Verbose…’ (Python needs shared object based TAU library) % make F 90=tau_f 90. sh CXX=tau_cxx. sh CC=tau_cc. sh (build py. MPI w/TAU) % cat wrapper. py import tau def Our. Main(): import App tau. run(‘Our. Main()’) Uninstrumented: % aprun –a xt –n 4
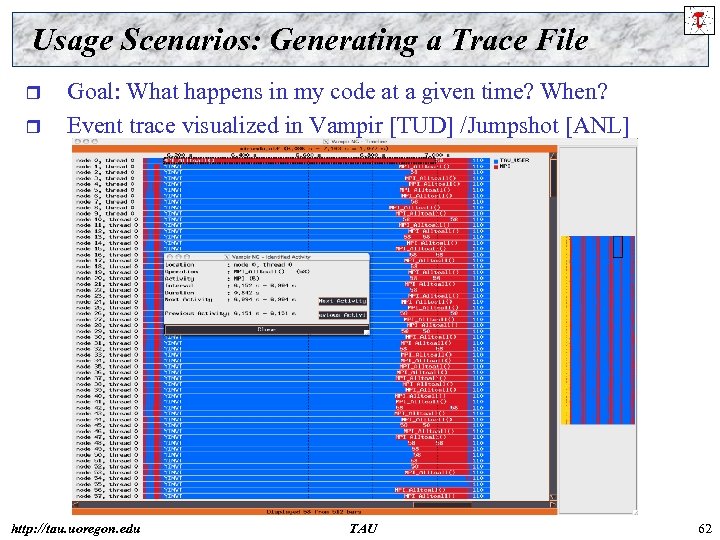 Usage Scenarios: Generating a Trace File r r Goal: What happens in my code at a given time? When? Event trace visualized in Vampir [TUD] /Jumpshot [ANL] http: //tau. uoregon. edu TAU 62
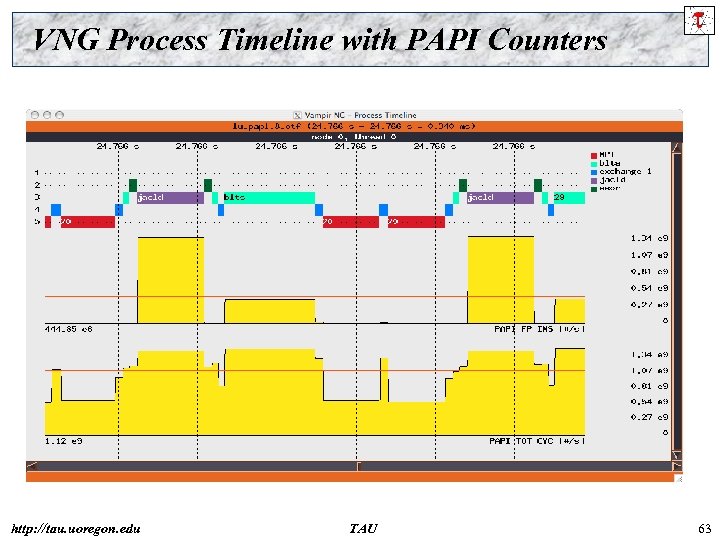 VNG Process Timeline with PAPI Counters http: //tau. uoregon. edu TAU 63
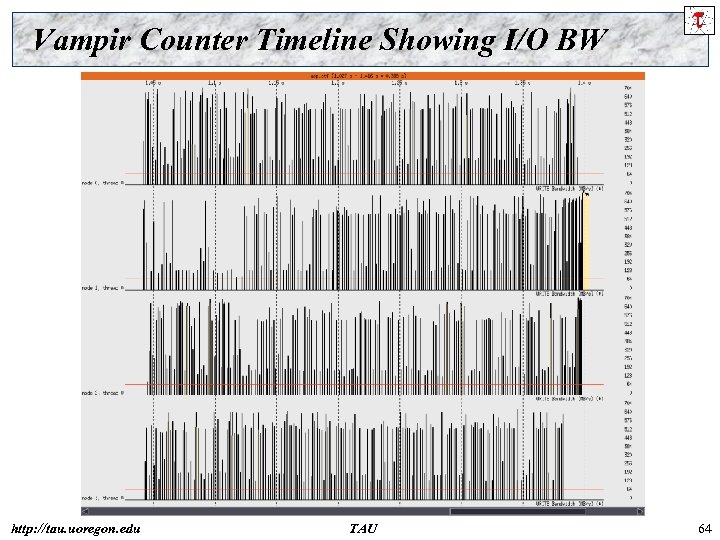 Vampir Counter Timeline Showing I/O BW http: //tau. uoregon. edu TAU 64
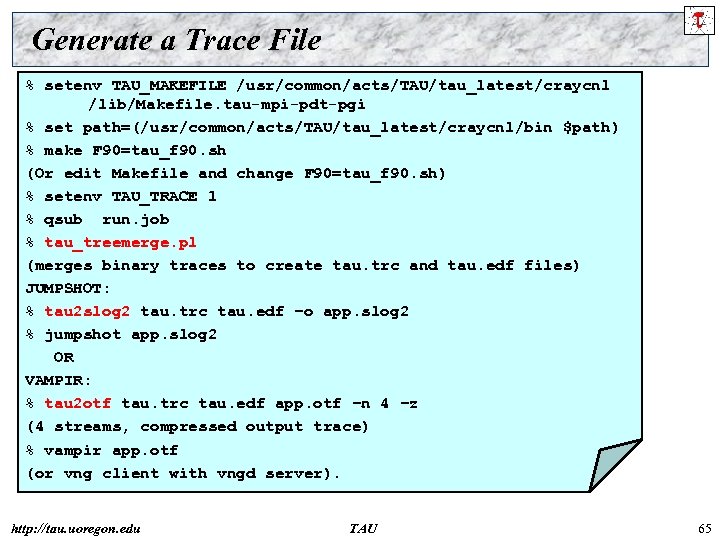 Generate a Trace File % setenv TAU_MAKEFILE /usr/common/acts/TAU/tau_latest/craycnl /lib/Makefile. tau-mpi-pdt-pgi % set path=(/usr/common/acts/TAU/tau_latest/craycnl/bin $path) % make F 90=tau_f 90. sh (Or edit Makefile and change F 90=tau_f 90. sh) % setenv TAU_TRACE 1 % qsub run. job % tau_treemerge. pl (merges binary traces to create tau. trc and tau. edf files) JUMPSHOT: % tau 2 slog 2 tau. trc tau. edf –o app. slog 2 % jumpshot app. slog 2 OR VAMPIR: % tau 2 otf tau. trc tau. edf app. otf –n 4 –z (4 streams, compressed output trace) % vampir app. otf (or vng client with vngd server). http: //tau. uoregon. edu TAU 65
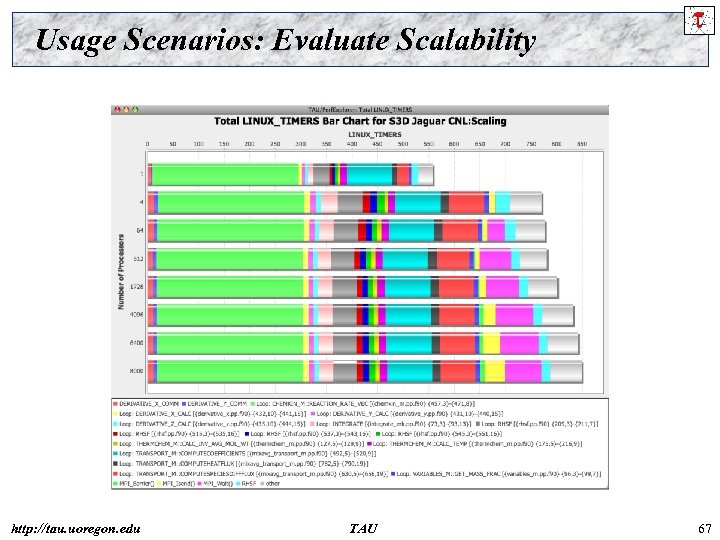
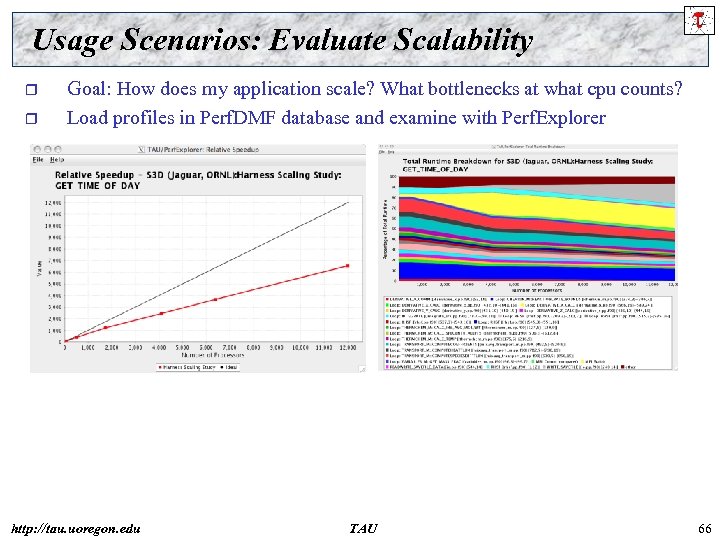 Usage Scenarios: Evaluate Scalability r r Goal: How does my application scale? What bottlenecks at what cpu counts? Load profiles in Perf. DMF database and examine with Perf. Explorer http: //tau. uoregon. edu TAU 66
 Usage Scenarios: Evaluate Scalability http: //tau. uoregon. edu TAU 67
 Performance Regression Testing http: //tau. uoregon. edu TAU 68
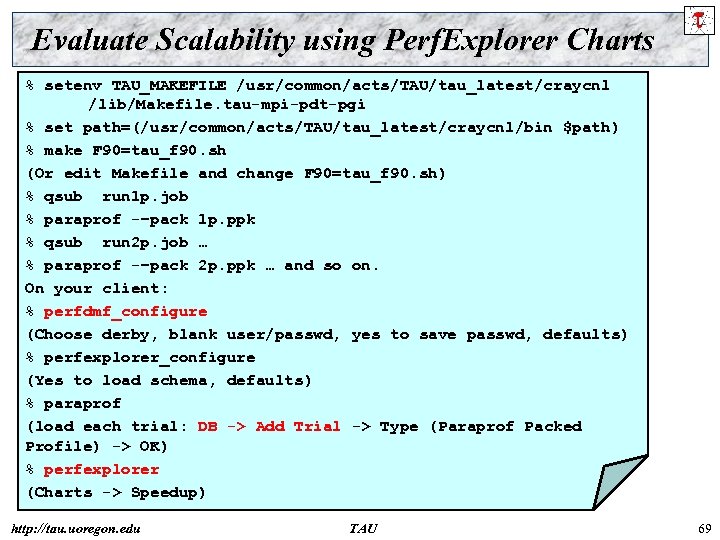 Evaluate Scalability using Perf. Explorer Charts % setenv TAU_MAKEFILE /usr/common/acts/TAU/tau_latest/craycnl /lib/Makefile. tau-mpi-pdt-pgi % set path=(/usr/common/acts/TAU/tau_latest/craycnl/bin $path) % make F 90=tau_f 90. sh (Or edit Makefile and change F 90=tau_f 90. sh) % qsub run 1 p. job % paraprof -–pack 1 p. ppk % qsub run 2 p. job … % paraprof -–pack 2 p. ppk … and so on. On your client: % perfdmf_configure (Choose derby, blank user/passwd, yes to save passwd, defaults) % perfexplorer_configure (Yes to load schema, defaults) % paraprof (load each trial: DB -> Add Trial -> Type (Paraprof Packed Profile) -> OK) % perfexplorer (Charts -> Speedup) http: //tau. uoregon. edu TAU 69
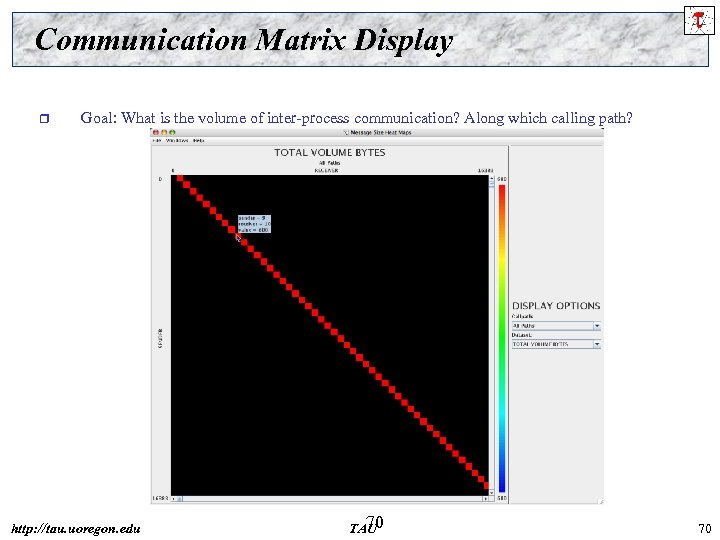 Communication Matrix Display r Goal: What is the volume of inter-process communication? Along which calling path? http: //tau. uoregon. edu 70 TAU 70
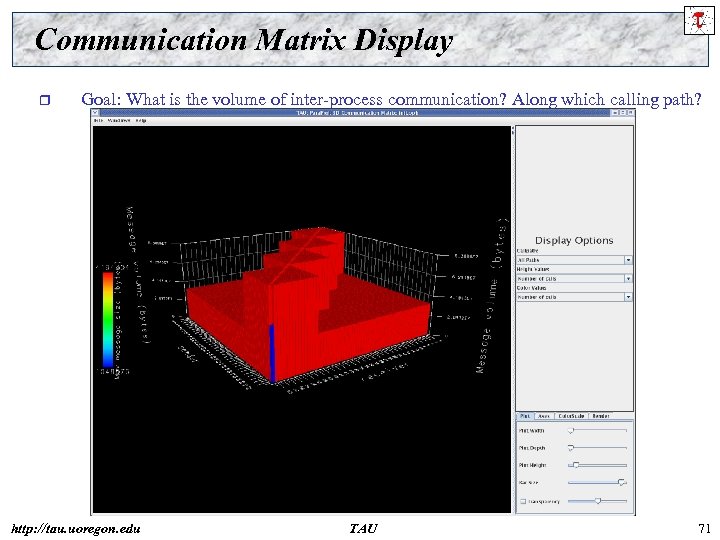 Communication Matrix Display r Goal: What is the volume of inter-process communication? Along which calling path? http: //tau. uoregon. edu TAU 71
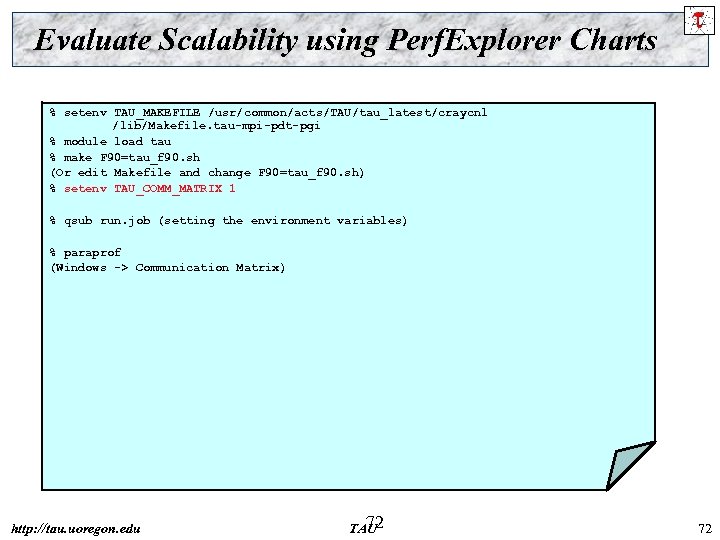 Evaluate Scalability using Perf. Explorer Charts % setenv TAU_MAKEFILE /usr/common/acts/TAU/tau_latest/craycnl /lib/Makefile. tau-mpi-pdt-pgi % module load tau % make F 90=tau_f 90. sh (Or edit Makefile and change F 90=tau_f 90. sh) % setenv TAU_COMM_MATRIX 1 % qsub run. job (setting the environment variables) % paraprof (Windows -> Communication Matrix) http: //tau. uoregon. edu 72 TAU 72
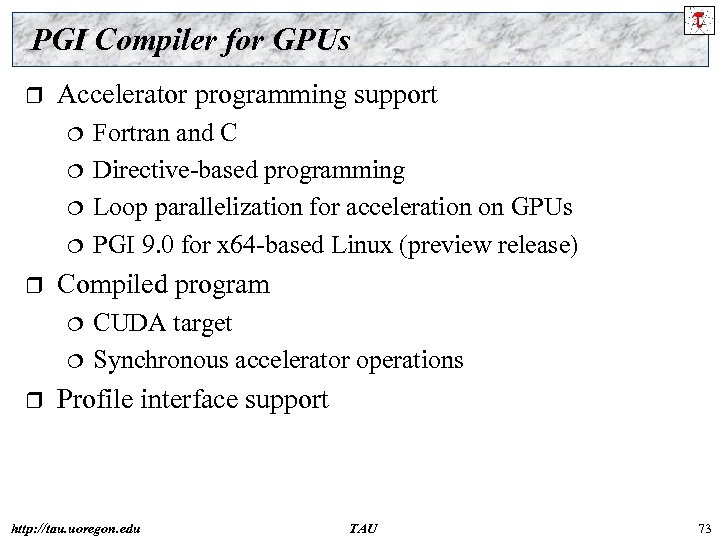 PGI Compiler for GPUs r Accelerator programming support r Compiled program r Fortran and C Directive-based programming Loop parallelization for acceleration on GPUs PGI 9. 0 for x 64 -based Linux (preview release) CUDA target Synchronous accelerator operations Profile interface support http: //tau. uoregon. edu TAU 73
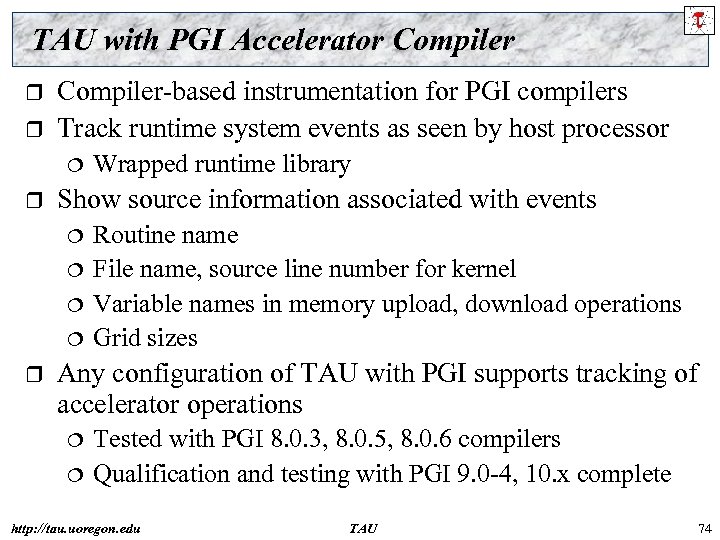 TAU with PGI Accelerator Compiler r r Compiler-based instrumentation for PGI compilers Track runtime system events as seen by host processor r Show source information associated with events r Wrapped runtime library Routine name File name, source line number for kernel Variable names in memory upload, download operations Grid sizes Any configuration of TAU with PGI supports tracking of accelerator operations Tested with PGI 8. 0. 3, 8. 0. 5, 8. 0. 6 compilers Qualification and testing with PGI 9. 0 -4, 10. x complete http: //tau. uoregon. edu TAU 74
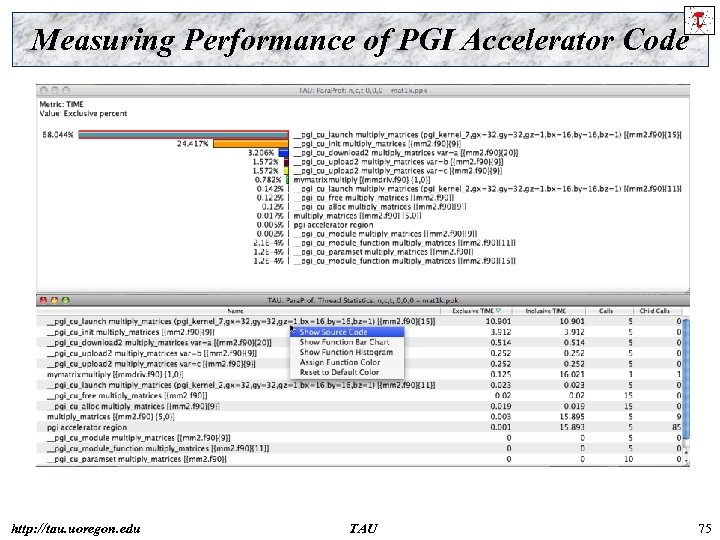 Measuring Performance of PGI Accelerator Code http: //tau. uoregon. edu TAU 75
![Binary Rewriting: Dyninst. API [U. Wisc] and TAU http: //tau. uoregon. edu TAU 76 Binary Rewriting: Dyninst. API [U. Wisc] and TAU http: //tau. uoregon. edu TAU 76](https://present5.com/presentation/ffec7ff690bc8986829576963f9fadb3/image-76.jpg) Binary Rewriting: Dyninst. API [U. Wisc] and TAU http: //tau. uoregon. edu TAU 76
Binary Rewriting: Dyninst. API [U. Wisc] and TAU http: //tau. uoregon. edu TAU 76
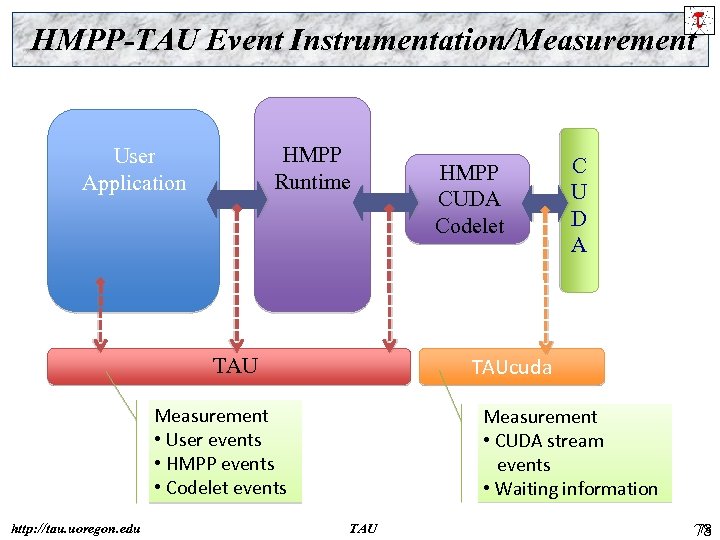 HMPP-TAU Event Instrumentation/Measurement HMPP Runtime User Application C U D A TAUcuda TAU Measurement • User events • HMPP events • Codelet events http: //tau. uoregon. edu HMPP CUDA Codelet Measurement • CUDA stream events • Waiting information TAU 78 78
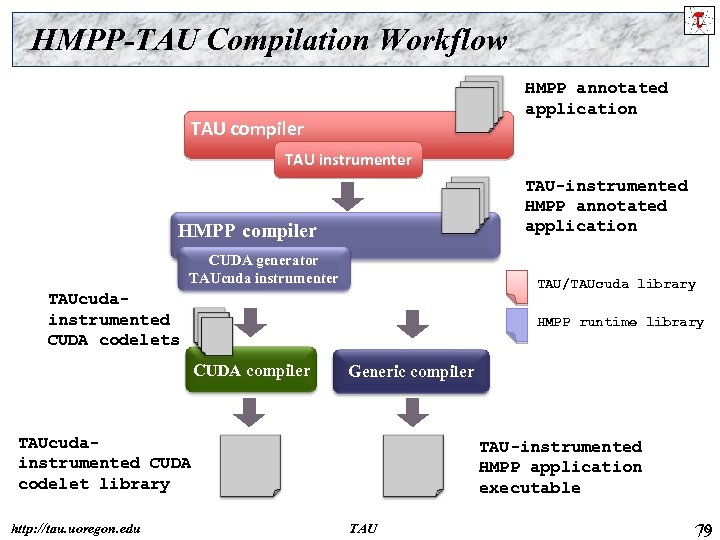 HMPP-TAU Compilation Workflow HMPP annotated application TAU compiler TAU instrumenter TAU-instrumented HMPP annotated application HMPP compiler CUDA generator TAUcuda instrumenter TAU/TAUcuda library TAUcudainstrumented CUDA codelets HMPP runtime library CUDA compiler Generic compiler TAUcudainstrumented CUDA codelet library http: //tau. uoregon. edu TAU-instrumented HMPP application executable TAU 79 79
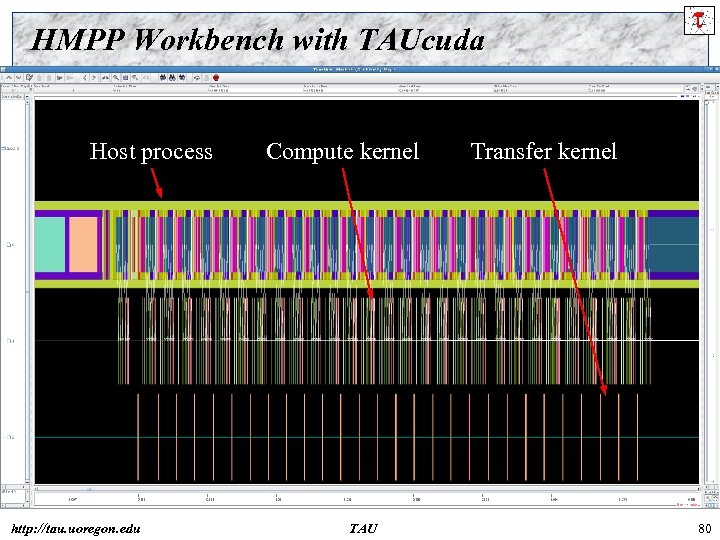 HMPP Workbench with TAUcuda Host process http: //tau. uoregon. edu Compute kernel TAU Transfer kernel 80
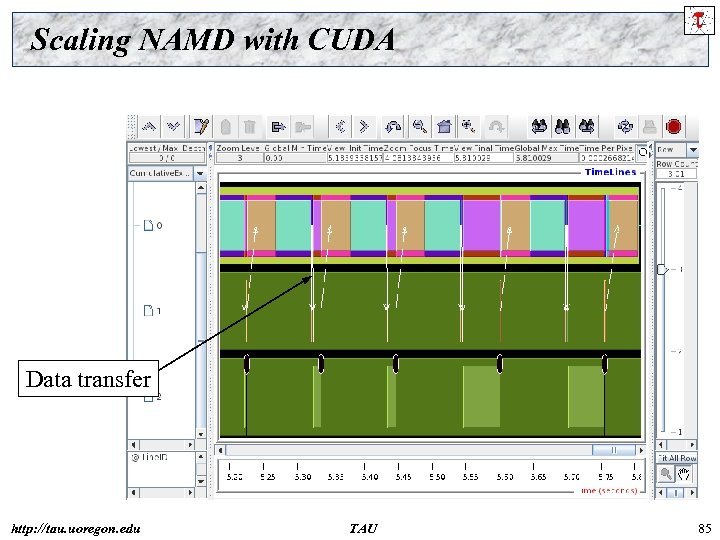
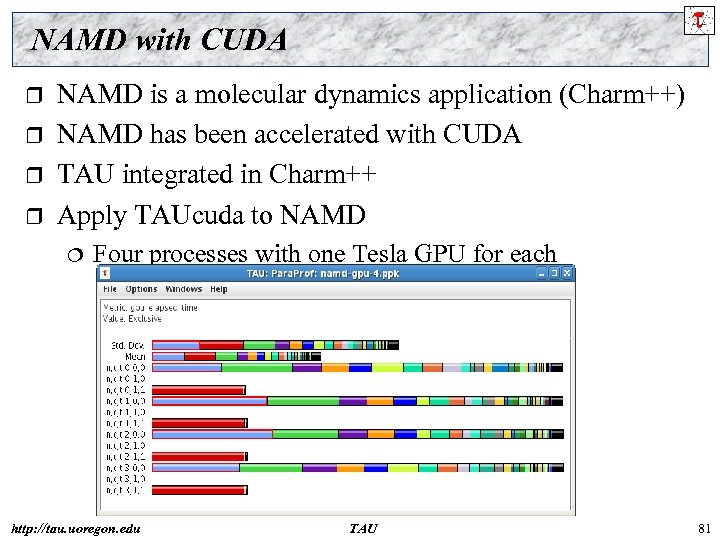 NAMD with CUDA r r NAMD is a molecular dynamics application (Charm++) NAMD has been accelerated with CUDA TAU integrated in Charm++ Apply TAUcuda to NAMD Four processes with one Tesla GPU for each http: //tau. uoregon. edu TAU 81
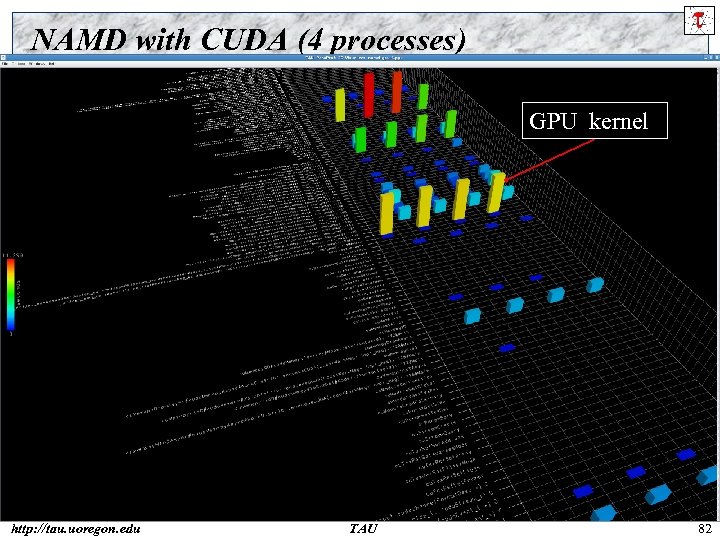 NAMD with CUDA (4 processes) GPU kernel http: //tau. uoregon. edu TAU 82
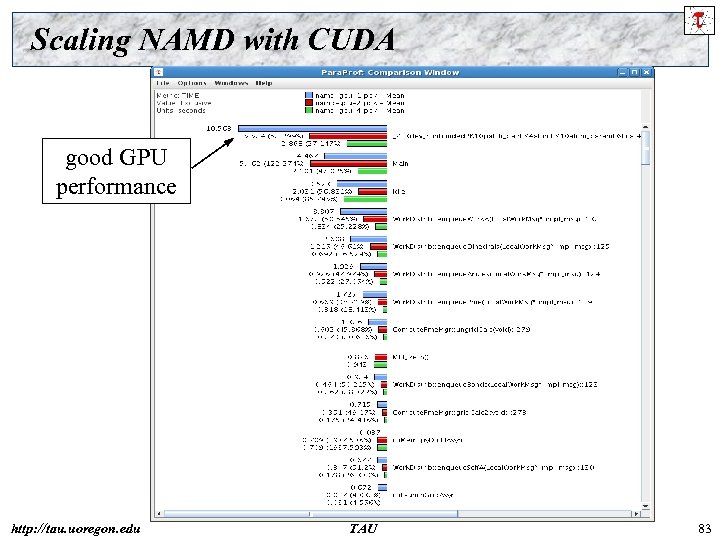 Scaling NAMD with CUDA good GPU performance http: //tau. uoregon. edu TAU 83
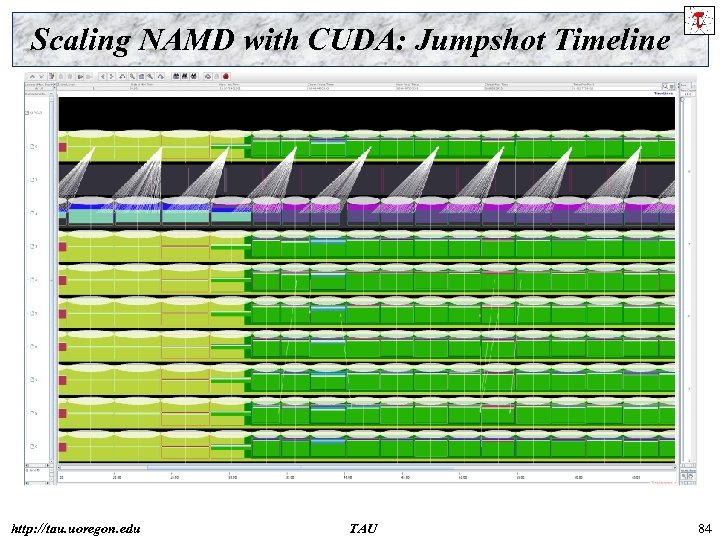 Scaling NAMD with CUDA: Jumpshot Timeline http: //tau. uoregon. edu TAU 84
 Scaling NAMD with CUDA Data transfer http: //tau. uoregon. edu TAU 85
 Conclusions r Heterogeneous parallel computing will challenge parallel performance technology r Must deal with diversity in hardware and software Must deal with richer parallelism and concurrency Performance tools should support parallel execution and computation models Understanding of “performance” interactions Ø between integrated components Ø control and data interactions r Might not be able to see full parallel (concurrent) detail Need to support multiple performance perspectives Layers of performance abstraction http: //tau. uoregon. edu TAU 8 86
 Discussions r r TAU represents a mature technology for performance instrumentation, measurement and analysis We would like to collaborate with the Cray language and compiler teams to improve the support for TAU on Cray systems Near-term goals Chapel runtime support Support for compiler-based instrumentation for Cray compilers on XT systems Long-term goals Explore hybrid execution models (XT 5 h) and other new systems Integrate and ship TAU with the Cray tool chain http: //tau. uoregon. edu TAU 8 87
 Support Acknowledgements Department of Energy (DOE) Office of Science Ø MICS, Argonne National Lab ASC/NNSA Ø University of Utah ASC/NNSA Level 1 Ø ASC/NNSA, LLNL r Department of Defense (Do. D) HPC Modernization Office (HPCMO) r NSF SDCI r Research Centre Juelich r LBL, ORNL, ANL, LANL, PNNL, LLNL r TU Dresden r Para. Tools, Inc. r http: //tau. uoregon. edu TAU 88


