ec5b4492cfdec6d695dde4d848ad9d44.ppt
- Количество слайдов: 25
 Systems Support for End-to-End Performance Management Sandip Agarwala Ph. D Advisor: Karsten Schwan College of Computing Georgia Tech
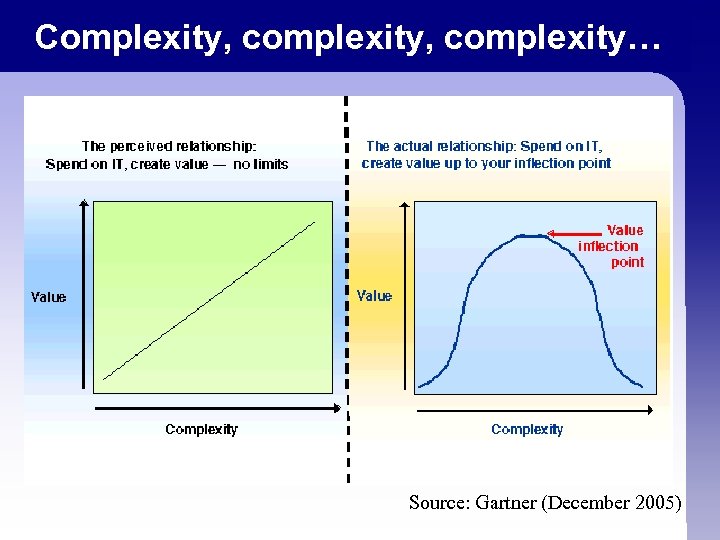 Complexity, complexity… Source: Gartner (December 2005)
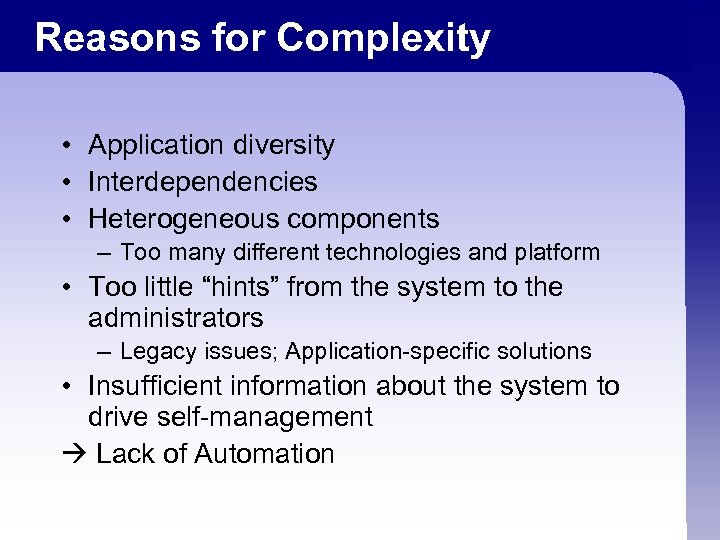 Reasons for Complexity • Application diversity • Interdependencies • Heterogeneous components – Too many different technologies and platform • Too little “hints” from the system to the administrators – Legacy issues; Application-specific solutions • Insufficient information about the system to drive self-management Lack of Automation
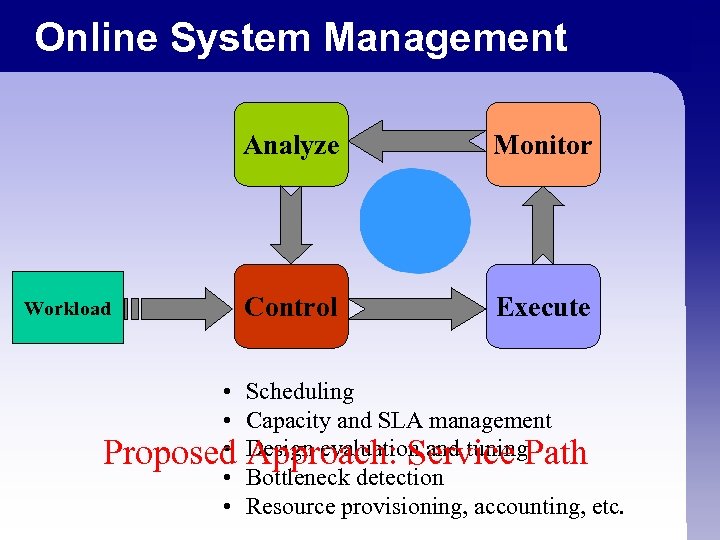 Online System Management Analyze Workload • • • Proposed • • Monitor Control Execute Scheduling Capacity and SLA management Design evaluation and tuning. Path Approach: Service Bottleneck detection Resource provisioning, accounting, etc.
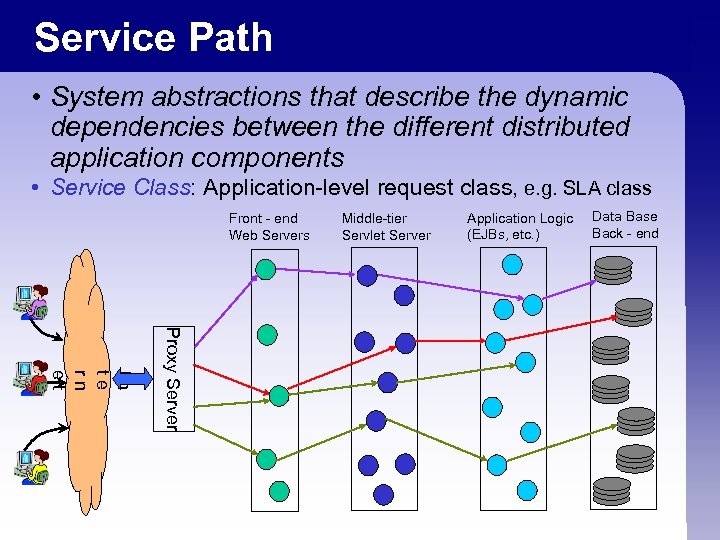 Service Path • System abstractions that describe the dynamic dependencies between the different distributed application components • Service Class: Application-level request class, e. g. SLA class Front - end Web Servers Middle-tier Servlet Server Application Logic (EJBs, etc. ) Data Base Back - end Proxy Server In te rn et
 Service Path Characteristics • End-to-End analysis • Online • Non-intrusive • Application-generic
 Outline • Background • Motivation • Service path – Discovery with E 2 EProf – Refinement with Sys. Prof – Automated SLA Enforcement • Related Work • Future Plans
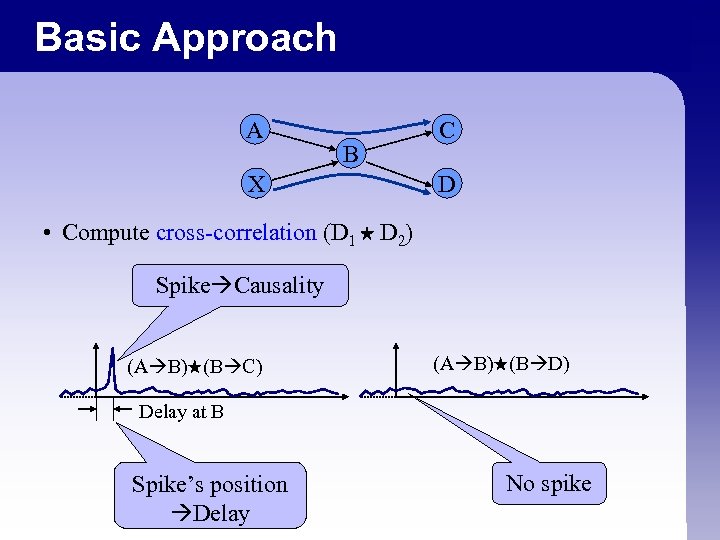
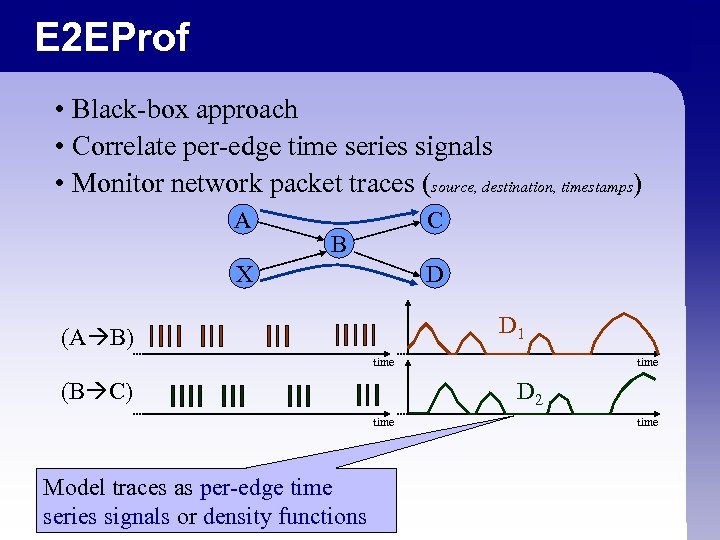 E 2 EProf • Black-box approach • Correlate per-edge time series signals • Monitor network packet traces (source, destination, timestamps) A C B X D D 1 (A B) time (B C) D 2 time Model traces as per-edge time series signals or density functions time
 Basic Approach A B X C D • Compute cross-correlation (D 1 D 2) Spike Causality (A B) (B C) (A B) (B D) Delay at B Spike’s position Delay No spike
 Evaluation with 4 -tier RUBi. S Tomcat Server 1 Clients I/O bound comm ent g biddin CPU bound 1 EJB Server 1 My. SQL Server Apache Web Server Tomcat Server 2 EJB Server 2 1 http: //rubis. objectweb. org/
 Service Path Detection in RUBi. S Highest delay node Static server assignment Round-robin load balancer Highest delay nodes delay node
 Change detection in RUBi. S Injected Delay
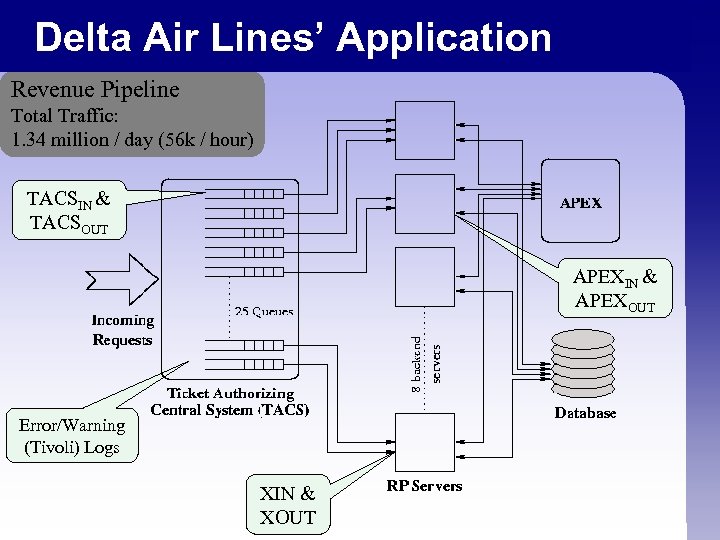 Delta Air Lines’ Application Revenue Pipeline Total Traffic: 1. 34 million / day (56 k / hour) TACSIN & TACSOUT APEXIN & APEXOUT Error/Warning (Tivoli) Logs XIN & XOUT
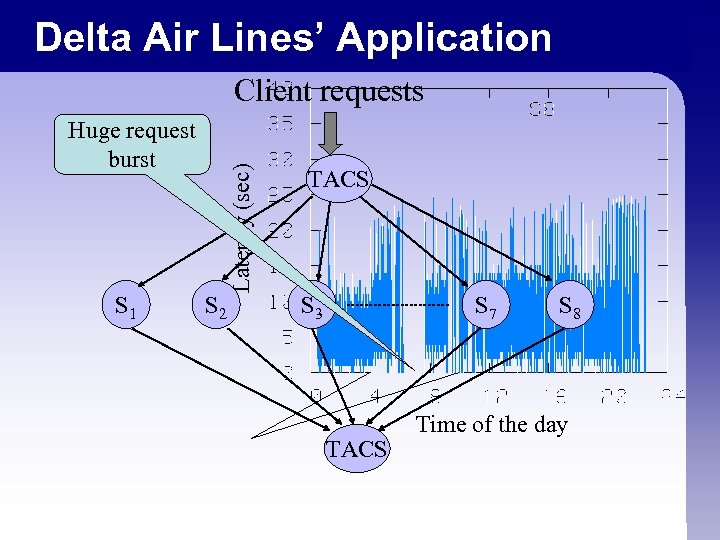 Delta Air Lines’ Application Huge request burst S 1 S 2 Latency (sec) Client requests TACS S 3 S 7 TACS S 8 Time of the day
 Outline • Background • Motivation • Service path – Discovery with E 2 EProf – Refinement with Sys. Prof – Automated SLA Enforcement • Related Work • Future Plans
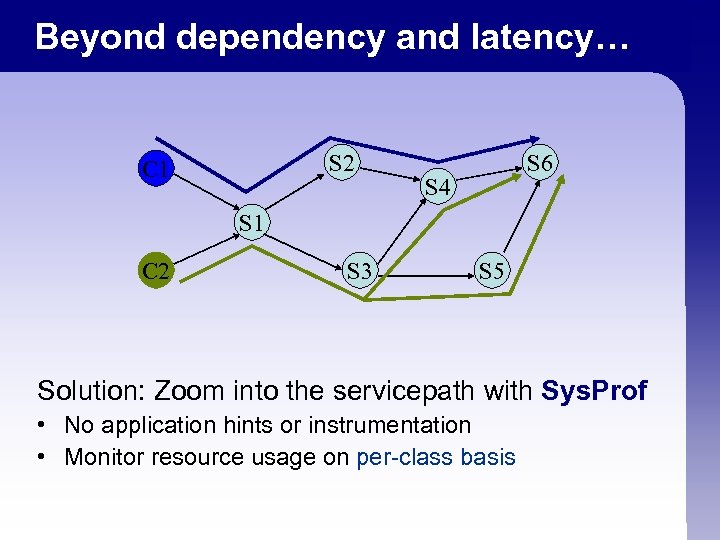 Beyond dependency and latency… S 2 C 1 S 6 S 4 S 1 C 2 S 3 S 5 Solution: Zoom into the servicepath with Sys. Prof • No application hints or instrumentation • Monitor resource usage on per-class basis
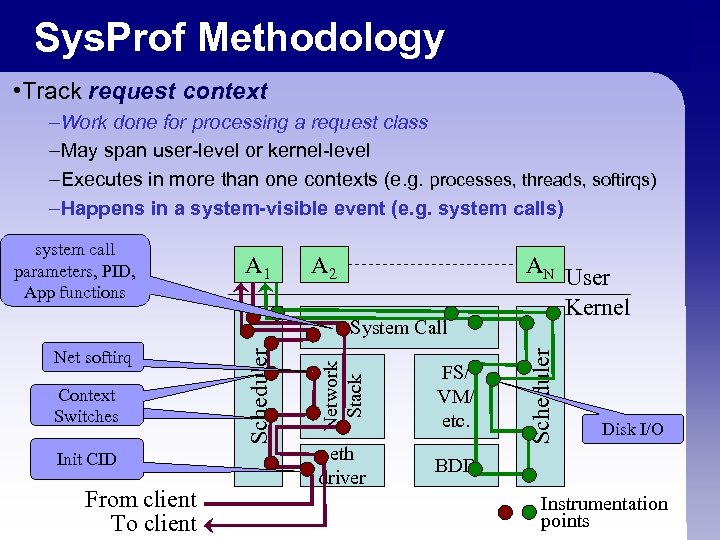 Sys. Prof Methodology • Track request context –Work done for processing a request class –May span user-level or kernel-level –Executes in more than one contexts (e. g. processes, threads, softirqs) –Happens in a system-visible event (e. g. system calls) system call parameters, PID, App functions A 1 A 2 AN Init CID From client To client FS/ VM/ etc. eth driver Scheduler Context Switches Network Stack Net softirq Scheduler System Call User Kernel BDD Disk I/O Instrumentation points
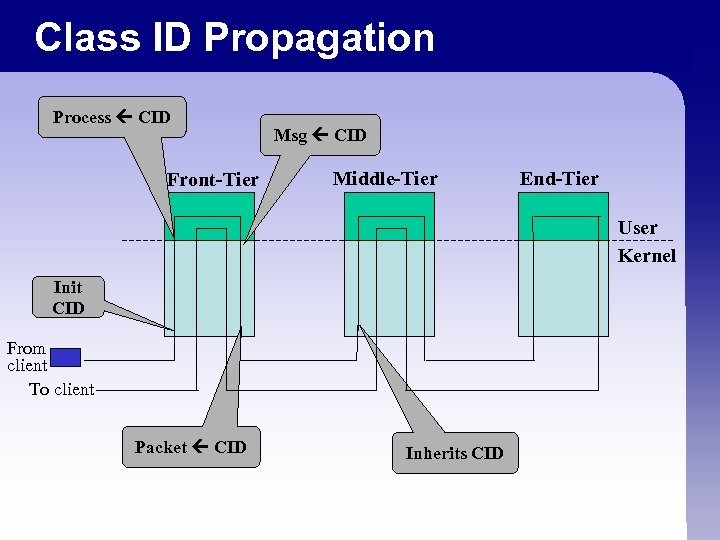 Class ID Propagation Process CID Front-Tier Msg CID Middle-Tier End-Tier User Kernel Init CID From client To client Packet CID Inherits CID
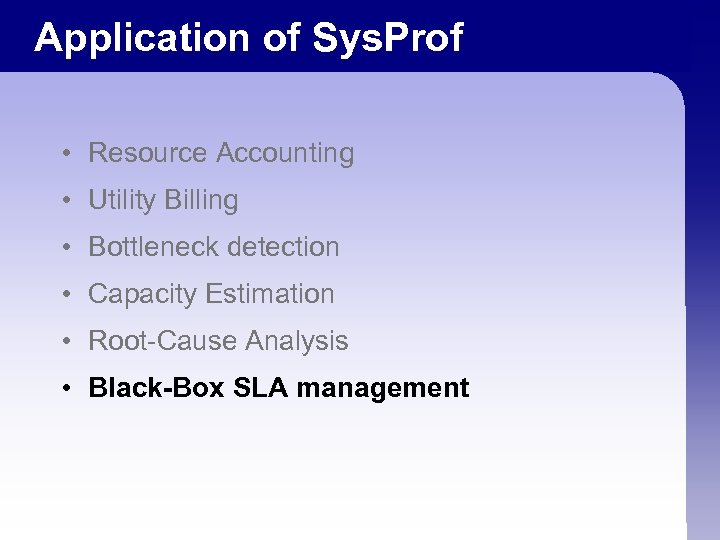 Application of Sys. Prof • Resource Accounting • Utility Billing • Bottleneck detection • Capacity Estimation • Root-Cause Analysis • Black-Box SLA management
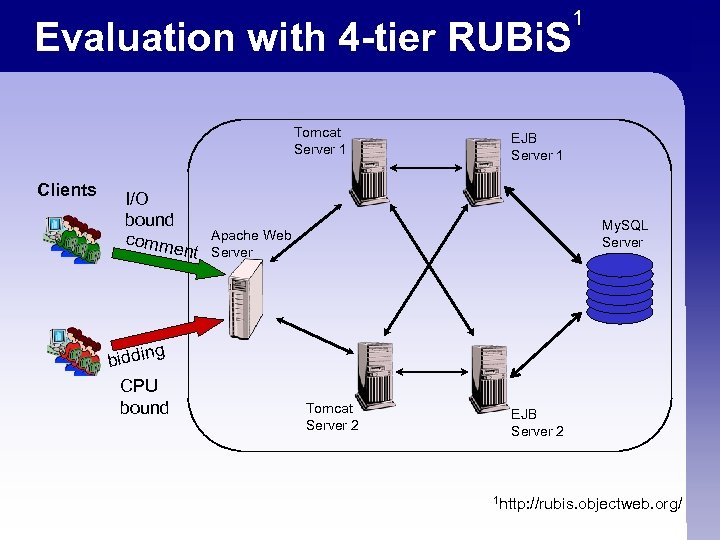
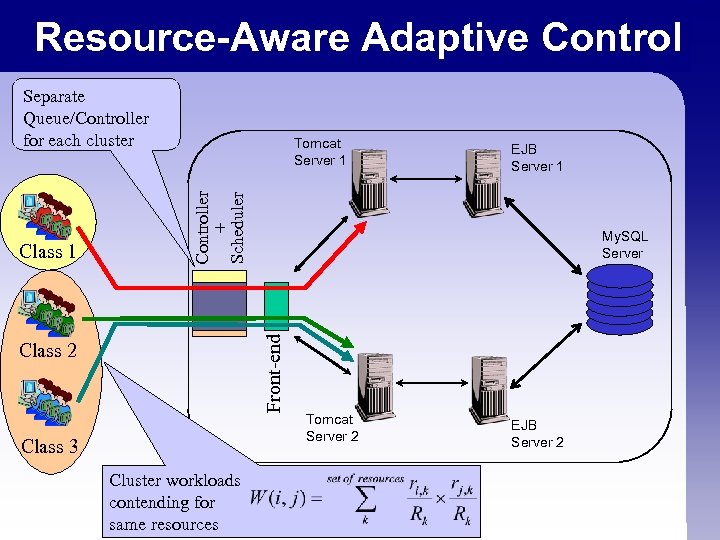 Resource-Aware Adaptive Control Separate Queue/Controller for each cluster EJB Server 1 Controller + Scheduler My. SQL Server Front-end Class 1 Tomcat Server 1 Class 2 Class 3 Cluster workloads contending for same resources Tomcat Server 2 EJB Server 2
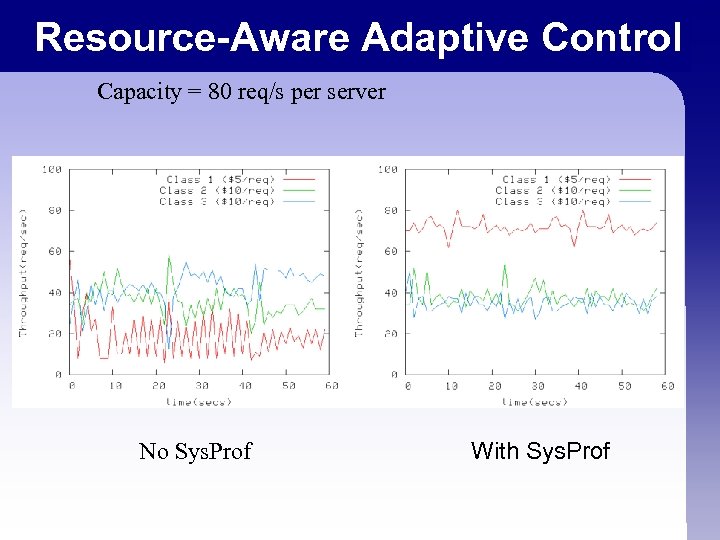 Resource-Aware Adaptive Control Capacity = 80 req/s per server No Sys. Prof With Sys. Prof
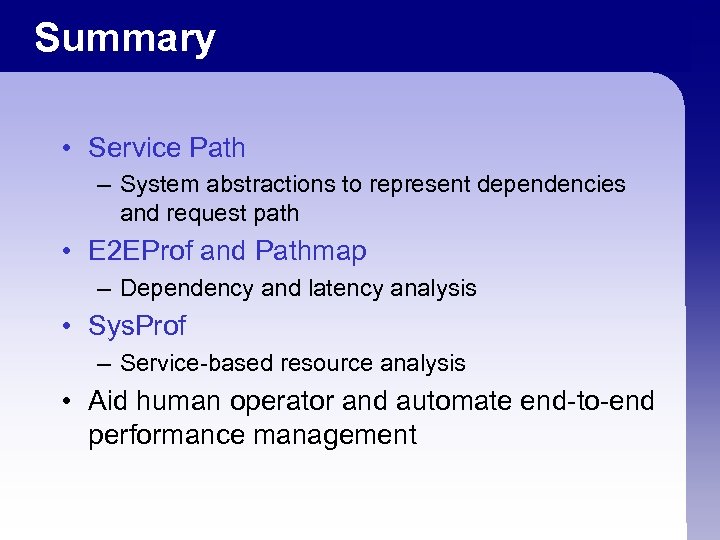 Summary • Service Path – System abstractions to represent dependencies and request path • E 2 EProf and Pathmap – Dependency and latency analysis • Sys. Prof – Service-based resource analysis • Aid human operator and automate end-to-end performance management
 Thank You! Questions? Email: sandip@cc. gatech. edu
 Extra Slides
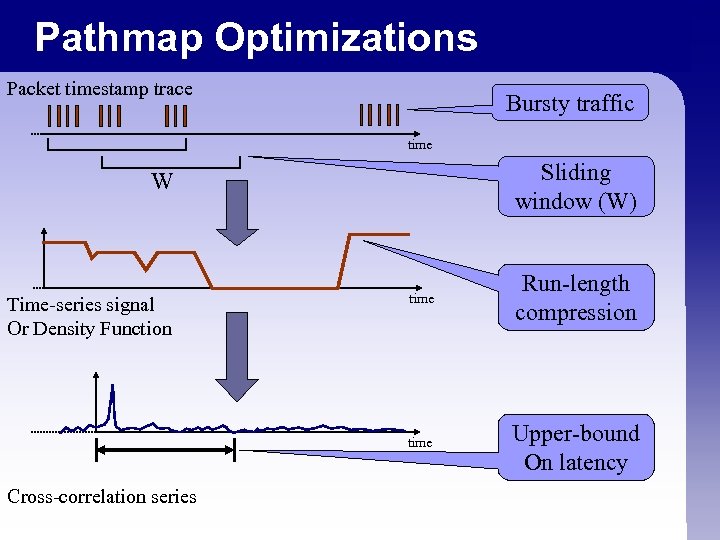 Pathmap Optimizations Packet timestamp trace Bursty traffic time Sliding window (W) W Cross-correlation series Run-length compression time Time-series signal Or Density Function time Upper-bound On latency


