6add5a6da822a8bd9b27bcc3d8936d89.ppt
- Количество слайдов: 52


")
Supplementary Table S 1. Tumor sample and patient information Indivumed # Tumor pairs (T) & normal control (N) # Differentiation A 3429 T 1/N 1 W 1 LN 0/LV 0 R 0 M 76 R 78 T 2/N 2 W 1 LN 0/LV 0 R 0 M 60 R 311 T 3/N 3 W 3 LN 0/LV 0 R 0 M 62 A 2983 T 4/N 4 P 3 LN 0/LV 0 R 0 F 79 A 2992 T 5/N 5 P 3 LN 0/LV 0 R 0 F 80 A 3036 T 6/N 6 P 4 LN 0/LV 0 R 0 M 66 A 2602 T 7/N 7 M 1 LN 0/LV 0 R 0 F 73 A 2613 T 8/N 8 P 4 LN 1/LV 0 R 0 M 80 A 2648 T 9/N 9 M 3 LN 0/LV 0 R 0 M 66 A 2672 T 10/N 10 M 2 LN 0/LV 0 R 0 M 50 A 1778 T 11/N 11 M 3 LN 0/LV 1 R 0 M 73 A 1887 T 12/N 12 M 3 LN 0/LV 0 R 0 F 75 A 1888 T 13/N 13 M 2 LN 0/LV 0 R 0 M 57 A 2652 T 14/N 14 P 3 LN 1/LV 1 R 2 F 66 A 2673 T 15/N 15 M 4 LN 2/LV 1 R 2 F 68 Tumor Stage Lymph Node (LN) and vessels (LV) Metastases stage Resection Gender Age
 Indivumed")
Supplementary Table S 1. Tumor sample and patient information ( to be continued) Indivumed # Tumor pairs (T) & normal control (N) # Lymph Node (LN) and vessels (LV) Metastases stage Differentiation KC 71 T 16/N 16 W 1 LN 0/LV 0 R 0 F 66 A 3800 T 17/N 17 W 2 LN 0/LV 0 R 0 F 81 A 3869 T 18/N 18 W 2 LN 0/LV 0 R 0 F 80 A 2566 T 19/N 19 W 3 LN 0/LV 0 R 0 M 76 B 1253 T 20/N 20 W 1 LN 0/LV 1 R 0 F 43 A 3666 T 21 N 21 W 3 LN 0/LV 0 R 0 M 83 R 293 T 22/N 22 W 3 LN 0/LV 0 R 0 F 75 R 428 T 23/N 23 W 3 LN 0/LV 0 R 0 M 74 Z 320 T 24/N 24 W 3 LN 0/LV 0 R 0 F 70 Z 322 T 25/N 25 W 3 LN 0/LV 1 R 0 F 80 A 1976 T 26/N 26 M 3 LN 1/LV 0 R 0 M 64 A 1995 T 27/N 27 M 3 LN 0/LV 0 R 0 M 60 A 2019 T 28/N 28 M 3 LN 0/LV 0 R 0 M 84 A 2076 T 29/N 29 M 3 LN 0/LV 0 R 0 M 65 A 2081 T 30/N 30 M 3 LN 0/LV 1 R 0 F 78 A 2082 T 31/N 31 M 2 LN 0/LV 0 R 0 F 72 A 2099 T 32/N 32 M 3 LN 0/LV 0 R 0 F 51 A 2103 T 33/N 33 M 2 LN 0/LV 0 R 0 F 65 A 2106 T 34/N 34 M 3 LN 0/LV 0 R 0 M 33 A 2156 T 35/N 35 M 3 LN 1/LV 0 R 0 M 77 Tumor Stage Resection Gender Age Table. S 1. Patient information was provided by Indivumed. Tumor and normal controls were numbered in the order they were sequenced. Differential stages (grade) were defined as well differentiated (W), moderately differentiated (M), and poorly differentiation (P). Lymph node (LN) metastases were defined as the following: LN 0= no LN had metastases, LN 1=1 to 3 LNs had metastases, LN 2=4 or more LN had metastases. Lymphatic vessel (LV) metastases were defined as LV 1. Resection is defined as tumor residue left after surgery with R 0=no residue tumor, R 1=microscopic residual tumor, R 2=marcoscopic residue tumor. Tumor tissues had 60% tumor content plus desmoplasia and normal tissues were normal colon mucosa and submucosa with 0% tumor content at histological level. Normal tissues were minimum 5 cm away from tumors.

Distinct profiles for mitochondrial t-RNAs and small nucleolar RNAs in locally invasive and metastatic colorectal cancer. Supplementary information (S 1) Fidelity of RNA-Seq analysis and identification of house keeping genes Since the regulation of 14 % of 270 mi. RNAs reported in this study is inconsistent with current references in CRC (3), the fidelity is very critical for evaluation studies. This variability may be caused by a number of factors including: use of different detection methods such as Q-PCR, microarray and RNA-Seq; differences in the storage of tissue used for the studies (eg, paraffin-embedded tissue versus frozen tissue); and lack of blood perfusion following resection and preservation, which is known to cause marked changes in gene. Thus, surmounting these challenges is difficult. Accumulating evidences suggest that nc. RNA clusters may have one core promoter region and transcriptional start site, which are shared by all nc. RNA genes within that cluster and thus are expressed within a single nc. RNA transcript (16). In that regard, the trends and consistency of nc. RNA cluster expression may be used in lieu of housekeeping genes as indicators of the accuracy of a quantitation study. We, therefore, sought to verify the fidelity of RNA-Seq by examining expression patterns of known clustered sequences including the snord 12 (Fig. S 1 a) and snord 114 clusters (Fig. S 1 b). Expression correlations of both snord 12 cluster and snord 114 cluster were strong since their coefficients (r) were all above 0. 60. The relative expression levels of these clusters had similar trends in all 35 paired samples indicating the accuracy of RNA-Seq for non-coding RNA. Using nc. RNA clusters as internal controls have not yet been reported. Moreover, commonly used nc. RNA normalizers were found unsuitable in some quantification assays (36, 37). We specifically searched invariable genes in our first 15 CRC pairs data bank. From 5, 171 s. RNAs (including house-keeping genes: U 6 families) and 1, 009 mi. RNAs, we identified let 7 a and snord 25 among having smallest relative variation. For let 7 a, the largest variation ratio across 15 pairs was 3. 9 and the largest variation within a pair of tumor and normal tissues was 1. 5. For snord 25, the largest variation across 15 pairs was 2. 5 and the largest variation within a pair was 2. 4 (Fig. S 1 c). Based on these studies, we propose that, as the best candidates for house-keeping genes, let 7 a be used in studies of paired tumor and normal samples and that snord 25 be used across numerous samples. Since let 7 a is downregulated in tumor, it is a biased normalizer in Q-PCR study of human primary CRC (Fig. S 1 d). The expression of traditional house keeping genes such as GAPDH and actin B were also variable between tumors and their matched normal controls (Fig. S 1 e). Thus without ideal house-keeping genes, it is theoretically difficult to verify RNA-Seq data with Q-PCR in paired matched CRC samples.
 (Supplementary Fig. S 1")
Fidelity of RNA-Seq data proved by snord RNA clusters (2) (Supplementary Fig. S 1 a) (Supplementary Fig. S 1 b)

mi. RNA and s. RNA candidates for normalizers Biggest ratio between 30 samples: T 11/N 3=2. 5. Biggest ratio within pairs: T 6/N 6=2. 4 mir 16 Biggest ratio between 2 patients : T 15/T 8=6. 3. Biggest ratio within pairs: T 3/N 3=3. 8 Supplementary Fig. S 1 c Biggest ratio between 30 patients: N 3/T 8=3. 9. Biggest ratio within pairs: N 3/T 3=1. 5 mir 93 Biggest ratio between 2 patients: T 7/N 8=17. 6. Biggest ratio within pairs: T 7/N 7=5. 6
 T/N=0. 63 Supplementary Fig. S 1 d (2) T/N=0. 80 (3) T/N=1. 27")
(1) T/N=0. 63 Supplementary Fig. S 1 d (2) T/N=0. 80 (3) T/N=1. 27
")
Supplementary Fig. S 1 e Fig. S 1. RPKMs of snord 12 cluster (a) and snord 114 cluster (b) were plotted in 35 CRC pairs. Correlation coefficient (r) was calculated by excel 2003. Since all rs were larger than 0. 70 for snord 12 cluster and snord 114 cluster, there were strong positive linear relationship among the expression levels of genes in snord 12 cluster and snord 114 cluster in 35 CRC pairs. (c) Identification of nc. RNAs as “house keeping” genes with smallest variation among first 15 pairs. nc. RNAs were plotted by their RPKMs. (d) An example of using Let 7 a as a house keeping gene. (1) let 7 a expression in T 7 pair. N 7 had higher level of let 7 a. (2) mir 378 a expression in T 7 pair. N 7 had higher level of mir 38 a. (3) mir 378 a expression in T 7 pair after normalization with let 7 a. N 7 had “lower” level of mir 378 a. Therefore, the use of let 7 a as a housekeeping gene would be unreliable. (e) The expression profile of m. RNA “house keeping” genes, GAPDH and actin B in first 14 CRC pairs. Expression of GAPDH was higher in 13 out of 14 tumors and expression of actin B was higher in 7 out of 14 tumors.
")
(Supplementary Fig. S 2 a)

Supplementary Fig. S 2 b Supplementary Fig. S 2 c
 3 D PCA of")
Supplementary Fig. S 2 d Supplemental Fig. S 2. (a) 3 D PCA of 22 MT-t. RNAs (RPKM) in 35 CRC pairs. Four LN/LV positive tumors (T 11 Lv, T 14 LN, T 15 LN, T 26 LN) (boxed) and 2 LN/LV negative tumors (T 12, T 13) were clearly separately from remaining 29 tumors and 35 normal controls. (b and c) Identification of most up/down regulated s. RNAs in tumors. All 35 tumors and 35 controls were grouped into 2 groups (T and N). Average T/N ratios were obtained, and log 2 ratios of LN/LV positive /negative ratio were sorted from high to low as shown. (c) Nine MT-t. RNAs were among top expressed 20 s. RNAs. (d) Nineteen sno. RNAs were among the 20 most downregulated s. RNAs. (d) 3 D PCA of 32 sno. RNAs RPKMs in 35 CRC pairs. Twenty-eight (boxed) out of thirty-five tumors were separated from 35 normal controls and remaining 7 tumors.

Supplementary Table. S 2 a. 9 upregulated MT-t. RNAs p-value Supplementary Table. S 2 b. 13 upregulated sno. RNAs Supplementary Table. S 2 c. 19 downregulated sno. RNAs 13 upregulated sno. RNAs host genes snord 12 B ZFAS 1 3. 83 E-12 0. 0052 snora 84 NOL 8 7. 03 E-12 MT-TC (cysteine) 0. 013 snord 78 GAS 5 5. 06 E-10 MT-TL 2 (leucine 2) 0. 015 snord 12 C ZFAS 1 1. 68 E-09 MT-TY (tyrosine) 0. 025 snord 86 ? 5. 29 E-08 MT-TI (isoleucine) 0. 026 snord 19 BGNL 3 7. 91 E-07 MT-TE (glutamic acid) 0. 036 snord 77 GAS 5 3. 75 E-06 MT-TH (histidine) 0. 048 snord 12 ZAS 1 7. 32 E-06 MT-TS 1 (serine 1) 0. 169 snora 71 D AP 1 G 1 5. 22 E-05 CTD 265120. 6 SHF snord 43 ? snord 49 B TRPV 2 0. 07 snord 1 A ? 0. 08 MT-TF (phenyalanine) MT-TL 1 (leucine 2) 7. 69 E-06 p-value 0. 0014 0. 008 host genes p-value snord 59 A ATP 5 B 2. 42 E-08 snord 114 -1 PWS 6. 65 E-08 snord 125 ADTB 1 7. 03 E-07 snord 71 A P 1 G 1 7. 65 E-07 AP 000318. 1 ? 9. 22 E-07 snora 54 RP 2 1. 38 E-06 snord 107 PWS 2. 07 E-06 scarna 18 TMEM 167 a 1. 25 E-05 snord 113 PWS 1. 69 E-05 snord 114 -14 PWS 2. 96 E-05 VTRNA 1 ZMAT 2 2. 96 E-05 snord 14 -23 PWS 3. 11 E-05 snord 64 PWS 4. 96 E-05 snord 114 -25 PWS 0. 00011 snord 116 -7 PWS 0. 0082 snord 116 -29 PWS 0. 0086 snord 83. 9 ? 0. 0099 snord 93 RL 12 P 10 0. 108

Supplementary Fig. S 3 a 9 upregulated Mt-t. RNAs W M W P M P

W M P W W M M P P

W M P

Supplementary Fig. S 3 b 13 Upregulated sno. RNAs W M P P W M P

W M W P P W M P

W W M M P P W W M P

W M P

Supplementary Fig. S 3 c W 19 Downregulated sno. RNAs M W M P P W M P

W W M P W M W P M P

W M W W P M P W M P

W M W P M W M P P

W M W W P M P

Supplementary Fig. S 3 d 9 upregulated 9 Mt-t. RNAs

Supplementary Fig. S 3 e 13 Upregulated sno. RNAs

Supplementary Fig. S 3 f 19 downregulated sno. RNAs
, 13 upregulated (b) and 19")
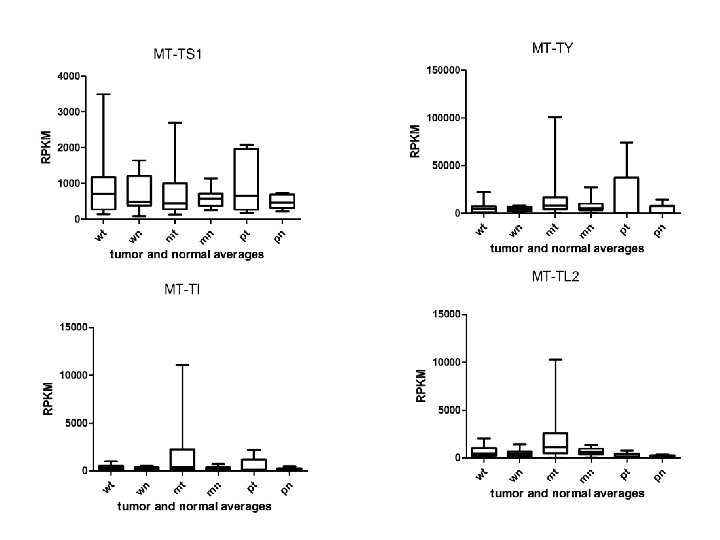
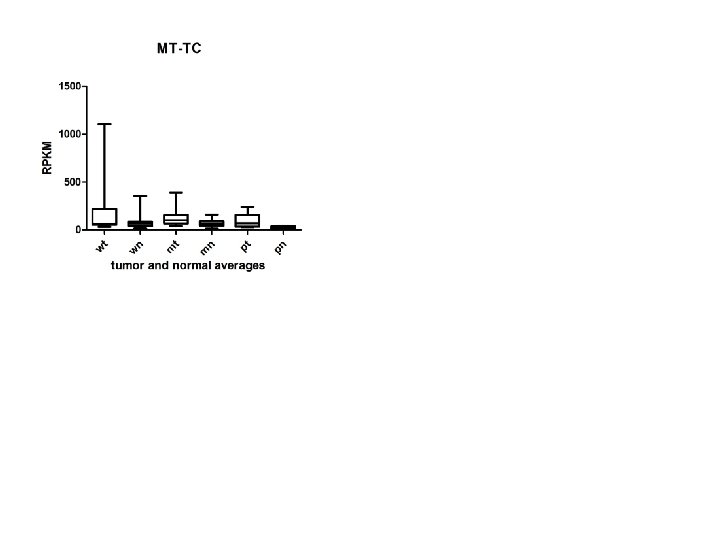
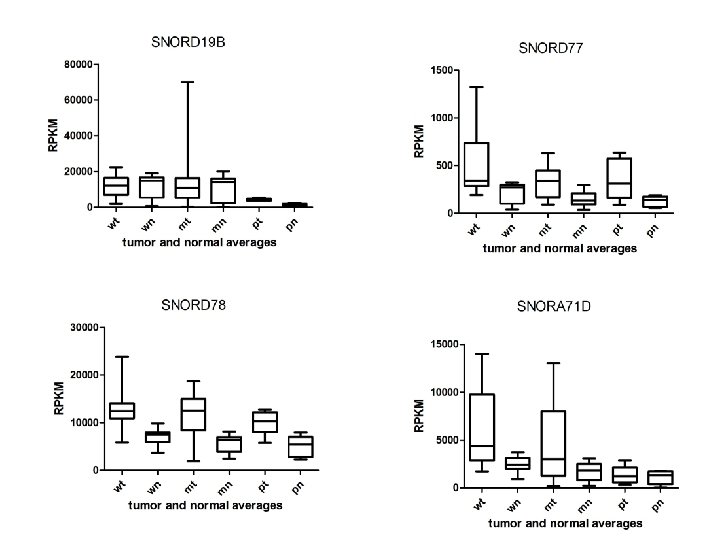
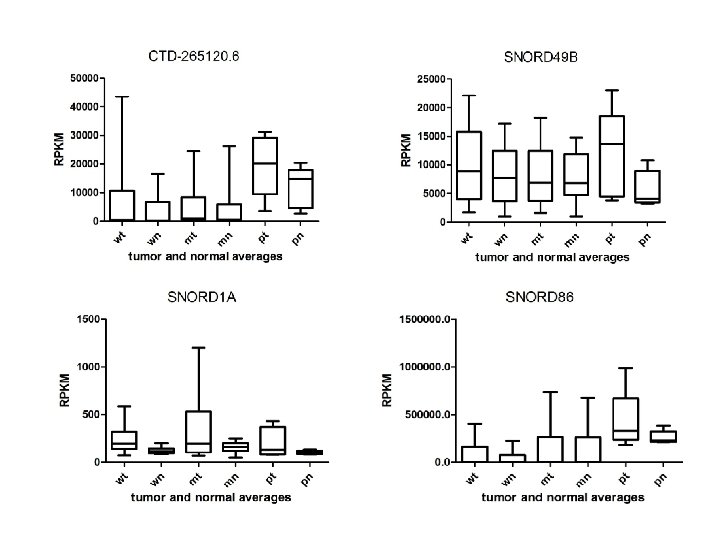
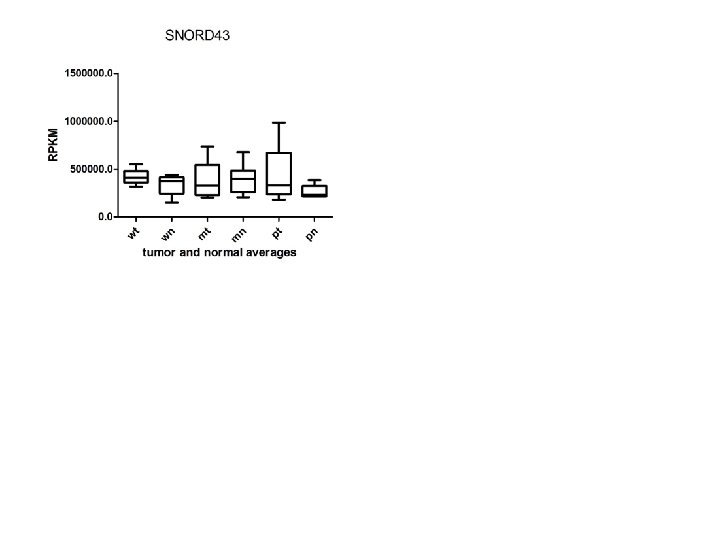
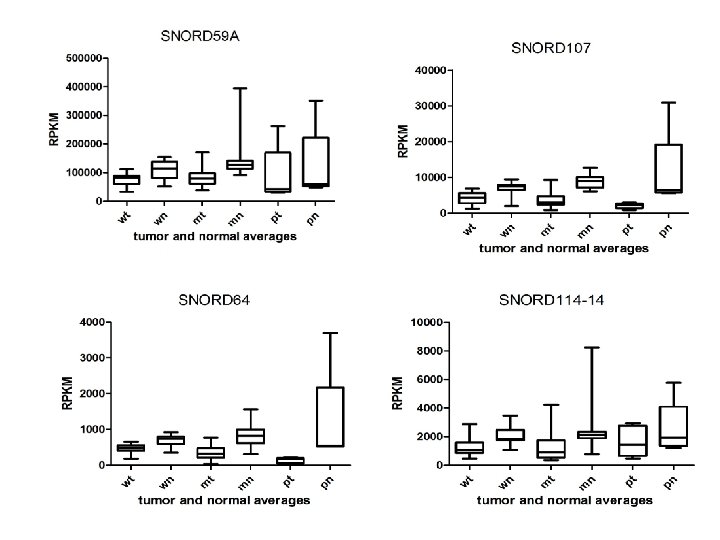
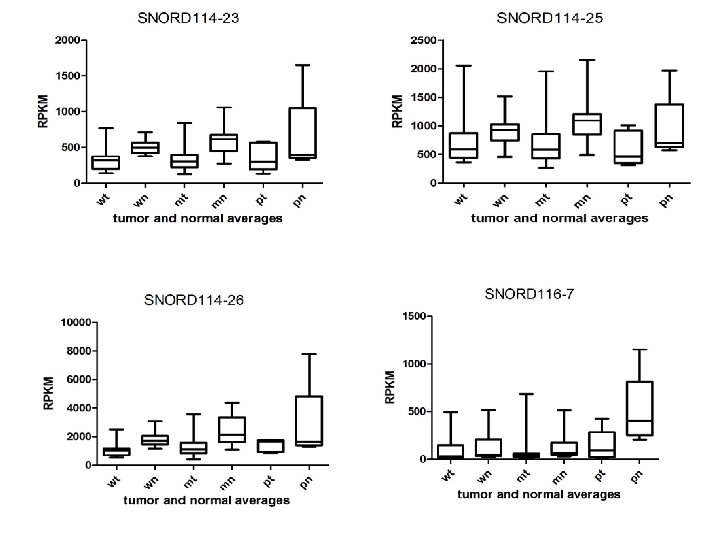
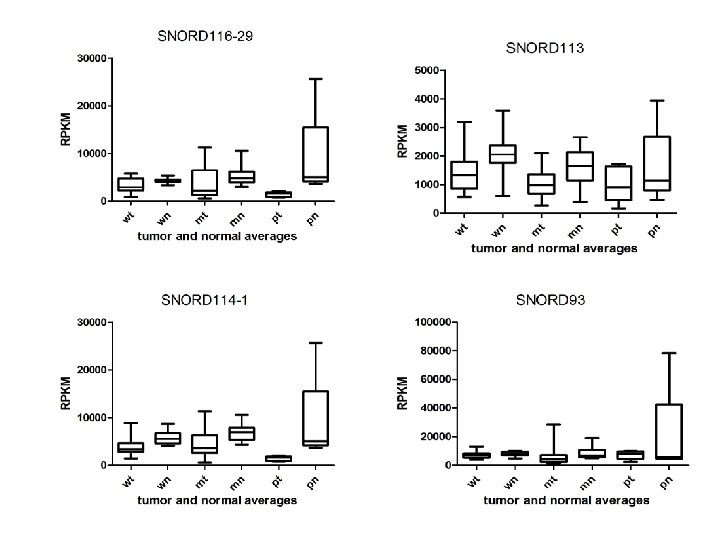
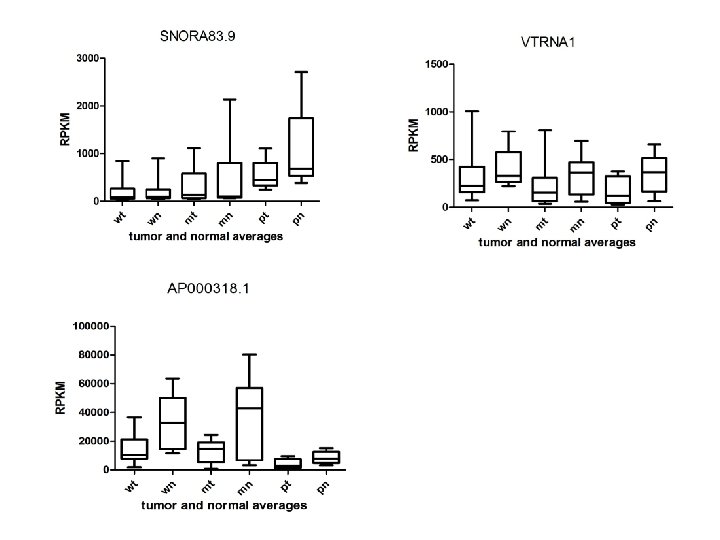
Supplementary Fig. S 3. Nine regulated MT-t. RNAs (a), 13 upregulated (b) and 19 downregulated sno. RNAs (c) were plotted by their RPKMs in 35 CRC pairs. W, M and P boxes represent well, moderately and poorly differentiated tumors respectively. Red arrows indicate LN/LV positive tumors. Nine upregulated MT-t. RNAs (d), 13 upregulated (e) and 19 downregulated sno. RNAs (f) were plotted by their average RPKMs in 35 CRC pairs grouped by well (w), moderately (m) and poorly (p) differentiated tumors (t) and their normal controls (n).

Ranks of deregulated s. RNAs with smallest p-values in CRC Supplementary Fig. S 4 a. Supplementary Fig. S 4 b. Supplementary Fig. S 4 c. Fig. S 4. (a) Top twenty s. RNAs with smallest p-values (paired t-test) in all 35 CRCs. (b) All examined 14 tumors had higher expression of ZNFX 1 -AS 1 (host gene of snord 12 cluster). (c) Expression correlation between snord 12 B and ZNFX 1 -AS 1 in 14 tumors. There was a moderate correlation (r=0. 66) between snord 12 B and ZNFX 1 -AS 1 at RPKM ratio (T/N).

Correlation between MT-t. RNAs and mi. RNAs Supplementary information. S 2 a

Correlation between sno. RNAs and mi. RNAs Supplementary information. S 2 b
 Supplementary information. S 2")
Correlation of sno. RNAs between mi. RNAs (to be continued) Supplementary information. S 2 b (to be continued 1)

Correlation between MT-t. RNAs and m. RNAs Supplementary information. S 2 c

Correlation between sno. RNAs and m. RNAs Supplementary information. S 2 d

Correlation between sno. RNAs and m. RNAs Supplementary information. S 2 d (to be continued 1 )
 Supplementary information. S")
Correlation between sno. RNAs and m. RNAs (to be continued 1) Supplementary information. S 2 d (to be continued 2)
 Supplementary information. S")
Correlation of sno. RNAs and m. RNAs (to be continued 2) Supplementary information. S 2 d (to be continued 3)
 Supplementary information. S")
Correlation of sno. RNAs and m. RNAs (to be continued 3) Supplementary information. S 2 d (to be continued 4) Supplementary information S 2. Correlation between MT-t. RNAs and mi. RNAs. (b) Correlation between MT-t. RNAs and m. RNAs. (b) Correlation between sno. RNAs and mi. RNAs. (d) Correlation between sno. RNAs and m. RNAs. (correlation strength (r) >0. 6).
 Type I: sno. RNAs only")
CRC tumor fingerprint based on T/N PRKM ratio (1) Type I: sno. RNAs only T 7 T 5 T 16 T 19 T 20 T 22 T 27 T 30 T 31 T 35 up up up CTD 26 S 77 S 12 C S 1 A S 12 C S 19 CTD 26 S 77 S 78 S 19 5. 5 S 12 4. 5 S 19 B 3. 6 S 12 B 1. 7 S 12 B 4. 1 S 101 3 3. 2 S 77 1. 6 S 12 3. 6 1. 2 S 78 3. 2 S 71 D 1. 6 7. 5 S 77 1. 2 S 19 3. 2 4. 5 S 71 D 4. 8 S 71 D 1. 2 9. 1 S 19 B 4. 1 S 19 4. 8 2. 1 S 12 B 8. 6 S 19. 2 3. 6 7. 9 S 71 D 1. 8 S 19. 2 7. 9 3. 8 S 78 1. 8 3. 7 down down down S 116 -7 S 107 S 114 -26 VTRNA 1 S 113 -7 S 114 -17 S 107 S 114 -26 -14 S 107 -2. 5 S 64 -14 S 64 AP 00 -2. 5 S 116 -7 -50 -2. 5 -3. 2 AP 00 -2. 5 VTRNA 1 -3. 2 Supplementary Table S 3 a S 113 -9 -5 S 114 -26 -3. 4 -2. 6 S 114 -1 -4. 3 S 113 -8 -5 -3 S 64 -3 AP 00 -4. 3 -2. 7 AP 00 -2. 9 S 113 -9 -3 -2. 3 S 114 -14 -3. 2 S 114 -16 -3. 1 -3. 8 S 107 -3. 8 S 114 -1 -5. 2 -13 S 64 -4. 7 -13
 Type II: MT-t. RNAs +")
CRC tumor fingerprint based on T/N PRKM ratio (2) Type II: MT-t. RNAs + sno. RNAs T 1 T 2 T 3 T 10 T 13 T 11 T 12 T 9 T 15 T 4 T 14 T 6 T 8 up up up up Mt-TS 1 S 49 A S 77 CTD 26 Mt-TL 1 S 71 D CTD 26 Mt-TL 1 CTD 26 Mt-TY Mt-TQ S 19 B 4. 5 S 98 14 S 19 Mt-TL 1 4. 5 S 77 17 13 Mt-TL 1 3 4 S 19 B 10 Mt-TE 10 7. 9 S 12 B 3. 5 Mt-TF 9. 4 5. 5 S 71 D Mt-TL 1 5. 7 S 19 B 2. 8 8. 7 4 Mt-TS 2 5. 4 20 S 15 A 8. 5 CTD 26 2. 7 20 Mt-TE 5. 9 Mt-TF 6. 2 3. 7 Mt-TE 9. 8 Mt-TY 5. 7 5. 1 Mt-TS 1 3. 7 RNY 4 9. 1 5. 1 S 19 B 4. 5 Mt-TF 2. 7 9. 1 Mt-TS 1 4. 8 Mt-TE 3. 8 8. 6 Mt-TL 1 4. 3 7. 9 down down down down S 114 -26 S 71 VTRNA 1 S 93 S 107 AP 00 S 116 -7 S 116 -29 VTRNA 1 S 116 -7 S 64 -3. 3 S 114 -23 3. 3 S 114 -14 -3. 8 S 114 -1 -4. 7 -2. 1 SC 18 -2. 2 mi 3607 -4. 5 AP 00 -7. 1 -2. 2 S 125 -3. 8 AP 00 SC 18 -3. 8 SC 18 -2. 3 -2. 5 S 64 -6. 2 Supplementary Table S 3 a (to be continued 1) -4. 7 SC 18 S 114 -14 -5. 5 VTRNA 1 -2. 7 -2. 4 -9 -5. 2 S 116 -7 -2. 6 S 49 B -3. 4 -3 S 64 -6. 6 S 64 S 107 -3. 7 AP 00 -9 -6. 6 S 123 -9 S 65 -5 -2. 5 S 116 -29 -3. 4 S 64 -16 -25 S 116 -7 -7. 6 -25
 Type II: MT-t. RNAs +")
CRC tumor fingerprint based on T/N PRKM ratio (3) Type II: MT-t. RNAs + sno. RNAs T 17 T 18 T 21 T 23 T 24 T 25 T 26 T 28 T 29 T 32 T 33 T 34 up up up S 19 S 71 D S 77 CTD 26 Mt-TL 1 S 71 D S 19. 2 Mt-TL 1 3. 1 CTD 26 4. 8 CTD 26 S 78 1. 3 Mt-TL 1 5. 2 Mt-TY 3 Mt-TS 1 1. 6 6. 7 4 Mt-TS 2 9. 4 3 S 19 4. 5 Mt-TE 4 6. 6 Mt-TE 1. 8 Mt-TL 1 3. 5 13 Mt-TE 4. 1 Mt-TF 5. 7 5. 1 Mt-TH 5 Mt-TF 2. 5 3 Mt-TL 1 4. 5 Mt-TE 4 17 S 78 Mt-TF 2. 6 Mt-TY 3. 8 5. 5 Mt-TY 10 Mt-TF 2 5. 5 3 MT-TS 2 9. 4 3. 6 Mt-TE 2. 6 3 down down down S 114 -12 AP 00 S 114 -14 VTRNA 1 S 49 B S 116 -29 S 123 S 114 -14 AP 00 S 107 S 14 -26 -1. 6 S 114 -3 -1. 6 S 116 -17 -1. 6 S 123 S 114 -1 -1. 6 S 28 -2. 7 -4 S 49 B -5 AP 00 -2 -2 S 116 -29 -2. 6 AP 00 -25 -5 -5 S 107 -4 -2. 6 S 49 B -3. 7 AP 00 -5 -3. 7 Supplementary Table. S 3 a (to be continued 2) -3. 2 S 107 -4. 5 S 114 -26 -3. 2 AP 00 -5 S 114 -23 -4 -5 -3. 5 S 113 -9 -3. 3 mir 3607 -3. 7 S 114 -14 -5 -3. 3 AP 00 -3. 7 S 64 -3. 3 S 64 -3. 8 -2. 5 S 114 -1 -2. 6 AP 00 -3. 7 -3. 8
 Type I: sno. RNAs only")
CRC tumor fingerprint based on T-N PRKM difference (1) Type I: sno. RNAs only Supplementary Table. S 3 b
 Type II: MT-t. RNAs +")
CRC tumor fingerprint based on T-N PRKM difference (2) Type II: MT-t. RNAs + snord. RNAs Supplementary Table. S 3 b (to be continued 1) Supplementary Table. S 3. (a) Ratio tumor fingerprint. (b) Subtractive tumor fingerprint. Ratio (T/N) and subtractive differences (T-N)) between each tumor pair were calculated and sorted from high to low. Three top up/downregulated genes were selected from each tumor. Two subtypes of tumors were identified based on sno. RNAs only (type I) and MT-t. RNAs/sno. RNAs (type II).

Supplementary Fig S 5 a Supplementary Fig S 5 b Fig. S 5. snord 1114 cluster (a) and MEG 3 (b) were plotted by their RPKM in 14 CRC pairs. There had strong positive correlation between MEG 3 and snord 114 cluster (r> 0. 8).
6add5a6da822a8bd9b27bcc3d8936d89.ppt