105a9bcb8a2717b80e2396bba2e6bb70.ppt
- Количество слайдов: 54


Strike The Spike! Strategies for Combatting After-Meal Highs Gary Scheiner MS, CDE

Overview • • Definitions Risks Detection Management

After-Meal Peaks Defined The net rise that occurs from before eating to the highest point after eating. • ADA Goal: <10 mmol 1 -2 hrs after start of meal • AACE Target: <7. 8 mmol at peak • European Diabetes Policy Group: <9 mmol (to prevent complications) • International Diabetes Federation: < 7. 8 mmol 2 hrs after meal

After-Meal Goals for Children • Under 5 Years: <14 @ 1 hr. post-meal (<6. 7 mmol Rise) • 5 -11 Years: <12. 5 @ 1 hr. post-meal (<5. 5 mmol Rise) • 12 Years + < 11 @ 1 hr. post-meal (<4. 4 mmol Rise)

After-Meal Peaks: Reality for children Source: Boland et al, Diabetes Care 24: 1858, 2001

After-Meal Peaks: Reality in Children Source: Boland et al, Diabetes Care 24: 1858, 2001

After-Meal Highs: Immediate Problems • Tiredness • Difficulty Concentrating • Impaired Athletic Performance • Decreased desire to move • Mood Shifts • Enhanced Hunger

After-Meal Highs: Immediate Problems Australian Study of Children w/Type 1. Parents & children reported BG > 15 had negative impact on: – Thinking (68%) – Mood/Emotions (75%) – Coordination (53%) J Pediatr Endocrinol Metab. 2006 Jul; 19(7); 927 -36

Long-Term Problems Relative Influence on Hb. A 1 c Source: Monnier et al, Diabetes Care, 26, 3/03, 881 -885
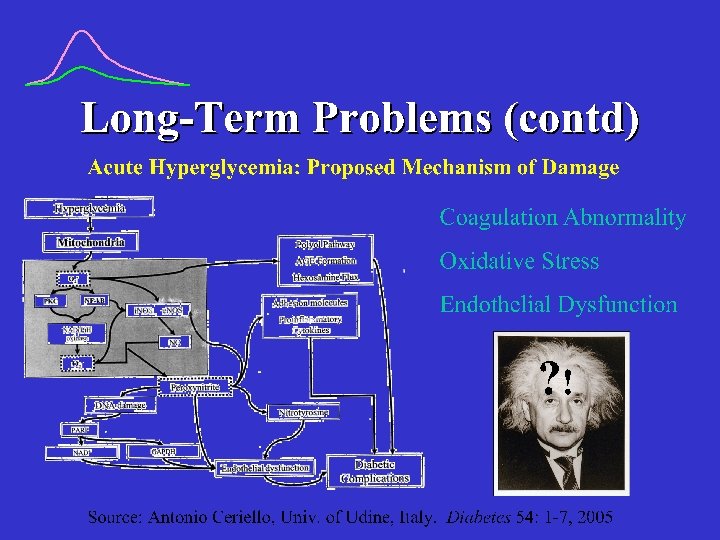
 52 Type 1’s, similar BP between groups Post-prandial glucose Range Time")
Long-Term Problems (contd) 52 Type 1’s, similar BP between groups Post-prandial glucose Range Time to onset of proteinuria Persistent <11 6. 1 -11. 0 23 yrs Intermittent >11 6. 6 -12. 7 Persistent > 11 >11 19 yrs 14 yrs Source: Kidney Intl. 1987; 32 (supp 22): S 53 -S 56
 22 -yr CVD Mortality Risk by Baseline post-challenge glucose Source: Chicago")
Long-Term Problems (contd) 22 -yr CVD Mortality Risk by Baseline post-challenge glucose Source: Chicago Heart Study, Lowe et al, Diabetes Care, 1997; 20: 163 -170.
 Rates of eye and kidney disease based on glucose variability (using")
Long-Term Problems (contd) Rates of eye and kidney disease based on glucose variability (using CGM) in Type-2 Diabetes Source: Liu et al, American Diabetes Association 71 st Scientific Sessions 2011, Abstract 2205 -PO.
 test – After completion of")
Measurement of After-Meal Peaks • SMBG – Capillary (finger) test – After completion of meal – Check BG 1 Hr PP – (or) every 15, 20 or 30 min until 2 consecutive BG drops occur – No addl. Food/insulin until test is completed

Meter Test Example Breakfast Pre 1 h Post 6. 1 15. 2 5. 0 16. 1 7. 5 14. 7 Lunch Pre 1 h Post 5. 5 9. 2 2. 9 13. 1 4. 0 8. 8 Dinner Pre 1 h Post 10. 7 11. 2 5. 4 7. 9 13. 3 13. 1 Interpretation: Excessive after-meal peak following breakfast; not after lunch or dinner

Meter Test Example Time pp BG Value Interpretation: Premeal : 20 : 40 1: 00 1: 20 1: 40 2: 00 6. 8 6. 9 8. 2 11. 3 11. 7 10. 4 9. 9 Peak occurred at 1 hr, 20 min pp; rise from premeal to peak was approx. 5 mmol
 – Worn for 72 hrs,")
Measurement of After-Meal Peaks • i. Pro CGM (Medtronic) – Worn for 72 hrs, then data is downloaded for analysis

Measurement of After-Meal Peaks • Real-Time Continuous Glucose Monitors – Allow tracking of postmeal trends – Produce BG estimates every 1 -5 minutes

CGMS Case Study 37 year old man

CGMS Case Study 8 year old girl

CGMS Case Studies 12 year old boy

Spike Measurement 1, 5 – anhydroglucitol “Glyco. Mark” • Laboratory Blood Test • Measures Duration & Magnitude of High BG Excursions for past 10 -14 days • “Normal” is >14 g/ml

After-Meal Spike Reduction • Lifestyle Approaches • Medicinal Approaches
 convert to blood glucose eventually • G.")
Glycemic Index • All carbs (except fiber) convert to blood glucose eventually • G. I. Reflects the magnitude of blood glucose rise for the first 2 hours following ingestion • G. I. Number is % or rise relative to pure glucose (100% of glucose is in bloodstream within 2 hours)
 Example: Spaghetti GI = 37 • Only 37% of spaghetti’s")
Glycemic Index (contd. ) Example: Spaghetti GI = 37 • Only 37% of spaghetti’s carbs turn into blood glucose in the first 2 hours. • The rest will convert to blood glucose over the next several hours.
 Parillo M et al. Effects of meals with different glycaemic index")
Glycemic Index (contd) Parillo M et al. Effects of meals with different glycaemic index on postprandial blood glucose response in patients with Type 1 diabetes treated with continuous subcutaneous insulin infusion. Diabet Med; 2011 Feb; 28(2): 227 -9

Dietary Intervention • Use of Glycemic Index – Lower GI foods digest & convert to glucose more slowly – High-fiber slower than low – Hi-fat slower than low – Solids slower than liquids – Cold foods slower than hot – Type of sugar/starch affects GI
 Slow Stuff Average Stuff Fast Stuff Pasta Legumes Salad Veggies")
Glycemic Index (contd. ) Slow Stuff Average Stuff Fast Stuff Pasta Legumes Salad Veggies Dairy Chocolate Fruit Juice Pizza Soup Cake Breads/Crackers Salty Snacks Potatoes Rice Cereals Sugary Candies

Examples: Use of GI Meal High-GI Options Low-GI Options Breakfast Cereal, Bagel, Waffle, Pancakes, Muffins Oatmeal, Milk, Whole Fruit Lunch White Bread, Fries, Tortillas, Cupcake Sourdough/Pumpernickel, Yogurt, Corn, Carrots Snacks Pretzels, Chips, Crackers, Doughnuts Fruit, Popcorn, Nuts, Ice Cream, Chocolate Dinner Rice, Mashed or Baked Potatoes, Rolls Pasta, Peas, Beans, Sweet Potato, Salad Veggies
 *Journal")
Add Some Acidity 60 -min glucose response 55%* Tomatoes Sourdough Vinegar (Salad Dressing/Condiments) *Journal of the American Dietetic Association, 2005: v 7 no 12.

Split The Meal Part at the usual mealtime Part 60 -90 minutes later

Meal Sequences Eat veggies before starch when having mixed meals Make lunch the “higher carb” meal (less at breakast & dinner) Presented at the American Diabetes Associaion Scientific Sessions, 2012, symposium on minimizing glucose variability.

Choice of Bolus Insulin Humalog Novorapid or Apidra • 1 -hr. peak • 3 -4 hr. effective duration Vs. Regular Insulin • 2 -3 hr. peak • 4 -6 hr. effective duration

Timing of Bolus Insulin
 High GI Moderate GI Low GI BG Above Target")
Timing of Bolus Insulin (humalog/novolog) High GI Moderate GI Low GI BG Above Target Range 30 -40 min. prior 15 -20 min. prior 0 -5 min. prior BG Within Target Range 15 -20 min. prior 0 -5 min. prior 15 -20 min. after BG Below Target Range 0 -5 min. prior 15 -20 min. after 30 -40 min. after

Does Timing Matter? Note: Carbs estimated w/pre-meal insulin. Carbs known with post-meal insulin. Source: Clinical Therapeutics 2004; 26: 1492 -7.

Does Timing Matter? • Bolus w/meal • Bolus pre-meal

Does Timing Matter? Insulin taken with meal Insulin taken 15 -30 min Pre-Meal (if >150) A 1 c Duran-Valdez, et al (U of New Mexico). Insulin Timing—A Beneficial Addition to Intensive Insulin Therapy in Type-1 Diabetes. Presented at the American Diabetes Association Scientific Sessions 2012, poster 964 -P.

Insulin Delivery Method Jet Injection • • 31 Minutes to Peak conc. 108 m. U/L Same total absorption Same total action Vs. Needle Injection • • 105 Minutes to Peak conc. 79 m. U/L Same total absorption Same total action Engwerda et al, Diabetes Care, 2011
 • Heating element in pump infusion site •")
Warming The Injection/Infusion Site “Insupatch” (experimental) • Heating element in pump infusion site • Warms site to 38 -40 C • 30 -40 minute earlier insulin peak

Warming The Injection/Infusion Site

Choice of Insulin Program Lantus & MDI • Meal/snack boluses Vs. Daytime isophane • Prolonged peak covers midday meals/snacks
 Acts on CNS l Appetite l Slows gastric emptying l")
Injectible Symlin (Amylin Pharmaceuticals) Acts on CNS l Appetite l Slows gastric emptying l Inhibits glucagon secretion Really flattens postprandial BGs
 Issues l Nausea l Must be injected*, cannot mix w/insulin")
Injectible Symlin (Amylin Pharmaceuticals) Issues l Nausea l Must be injected*, cannot mix w/insulin l Insulin doses must be adjusted, delayed l Not yet FDA approved for children * pumped? ? ?

Effect of Pramlintide on Gastric Emptying in Type 1 Diabetes Breakfast Insulin + Placebo Insulin + Pramlintide 4 * * 3 Mean Half-Emptying Time (h) 2 1 0 Placebo Single SC pramlintide doses: n = 11, crossover; *P<0. 004; 99 m Tc labelled pancake; solid component measured Data from Kong MF, et al. Diabetologia 1998; 41: 577 -583 30 µg 60 µg ~1 -h delay

Pramlintide Reduces Postprandial Glucagon Type 2 Diabetes, Late Stage Insulin Sustacal® 50 40 30 Placebo or 100 µg/h pramlintide infusion 0 1 2 3 Time (h) 4 20 10 0 -10 Placebo or 25 µg/h pramlintide infusion -20 5 Placebo Pramlintide Insulin Sustacal® 30 Plasma Glucagon (pg/m. L) 60 Plasma Glucagon (pg/m. L) Type 1 Diabetes 0 1 2 3 Time (h) Type 2 diabetes, n = 12; AUC 1 -4 h: P = 0. 005 Type 1 diabetes, n = 9; AUC 1 -5 h: P<0. 001; Data from: Fineman M, et al. Metabolism 2002; 51: 636 -641; Fineman M, et al. Horm Metab Res 2002; 34: 504 -508 4 5
 P <0.")
Pramlintide Reduces Caloric Intake in Type 2 Diabetes 1250 -202 kcal (-23%) P <0. 01 1000 Placebo Pramlintide 750 Ad-Libitum Caloric Intake (kcal) CHO 500 Fat 250 Protein 0 n = 11; subjects given buffet meal Pramlintide (single SC injection, 120 g) Data from Chapman I, et al. Diabetologia 2005; 48: 838 -848 Protein

Pre-Meal Hypoglycemia “Sieve Effect” Accelerates gastric emptying of liquids and solids Produces more rapid BG rise after meal J Clin Endo Metab 2005; 90: 4489 -95 Avoid Pre–Meal Lows!

Physical Activity Intervention Muscle Use Soon After Eating Accelerated Insulin Absorption Delayed Digestion Glucose Uptake/ Utilization Improved After-Meal Control

Effects of Post-Meal Walking 30 Minutes of casual stop & go walking after meals Avg. 30 mg/dl (1. 75 mmol/L) BG reduction Peak post-meal glucose 45% higher when not walking Kudva, et al. Diabetes Care, published online Aug 8, 2012

Examples: After-Meal/Snack Activity • • • Walking Pets Household Chores Planned Exercise Yard Work Gym Class? ? ? • • • Shooting Hoops Dancing Bowling Mini Golf Skating

Examples: After-Meal/Snack Activity “Free Time With Siblings”

Summary After-Meal Blood Sugar Levels Are: • Important to Control • Measurable • Manageable
 877 -735 -3648")
For More Information: Gary Scheiner MS, CDE Integrated Diabetes Services (USA) 877 -735 -3648 (USA) (877 -SELF-MGT) Website: www. integrateddiabetes. com E-mail: gary@integrateddiabetes. com
105a9bcb8a2717b80e2396bba2e6bb70.ppt