

1f2b0fb96125d17be53087483165349e.ppt
- Количество слайдов: 42
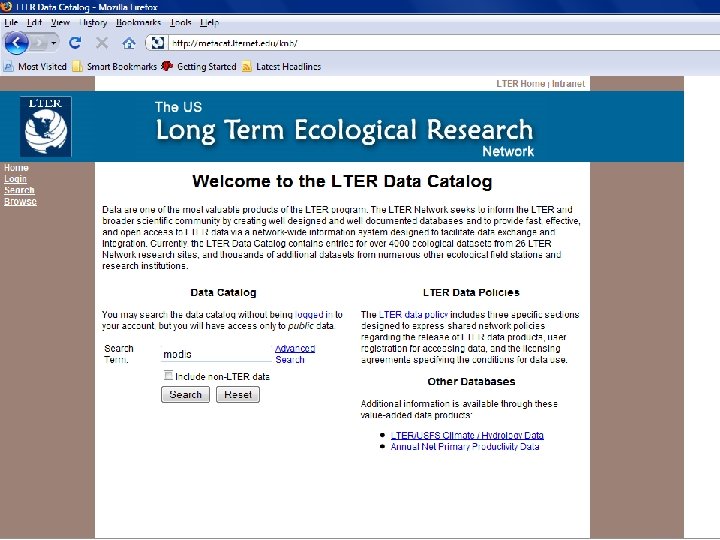
 Streaming Sensor Data from Space: Acquiring and Managing Direct Broadcast Satellite Data for Sites of the Long Term Ecological Research Network John Vande Castle and Mark Servilla Long Term Ecological Research Network Office, Department of Biology, University of New Mexico MSC 03 2020, Albuquerque, NM 87131 -0001 jvc@lternet. edu mservilla@lternet. edu
 CREATE Hardware & Facilities Receiving station: UNM Research Park: • 4. 5 meter X-Band automated 3 -axis satellite tracking antenna (MODIS) • 1. 5 meter L-Band automated satellite tracking antenna (AVHRR) • X-band L-band automated acquisition processors, raw data backup storage (30 days)
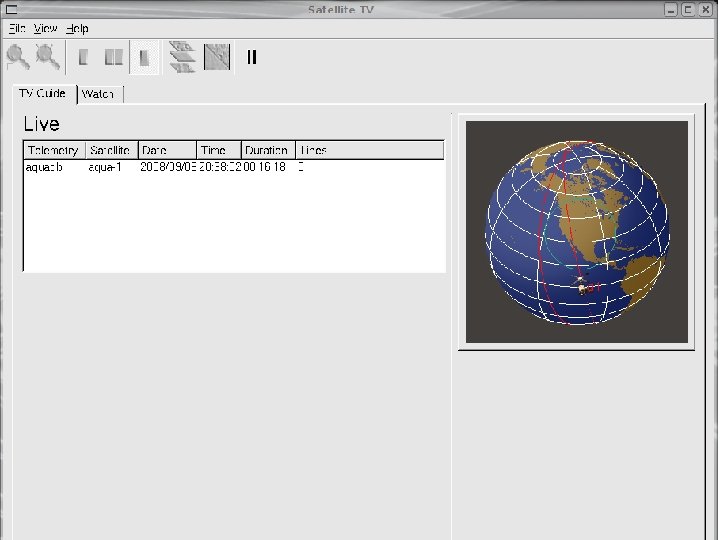
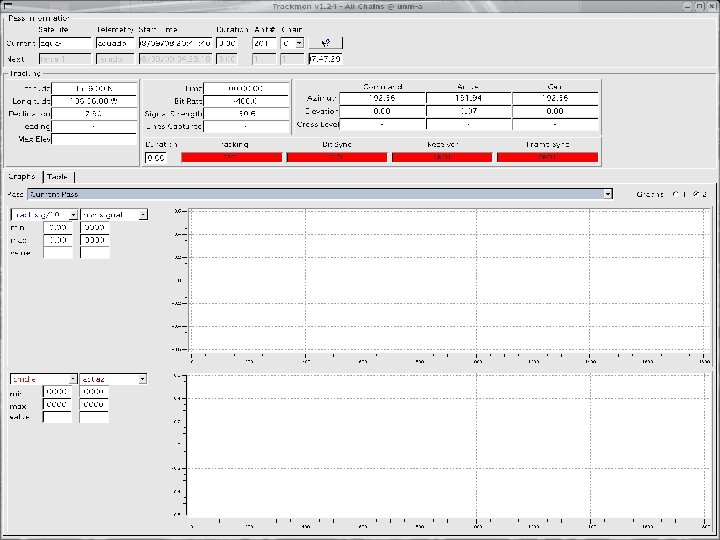
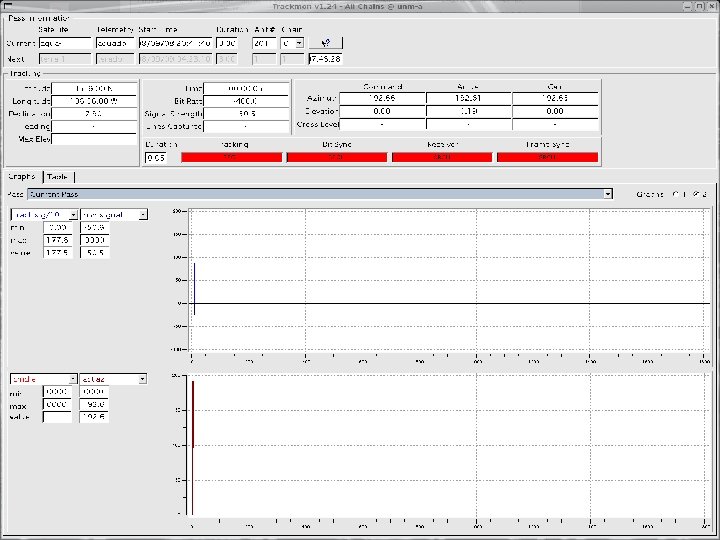

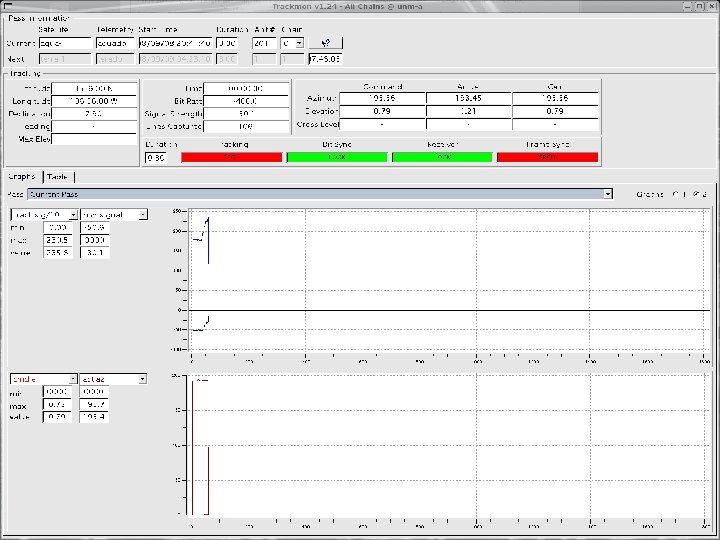

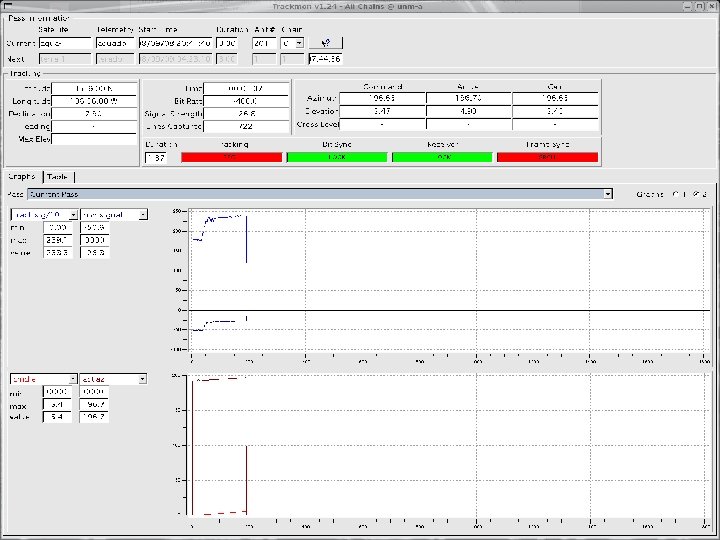

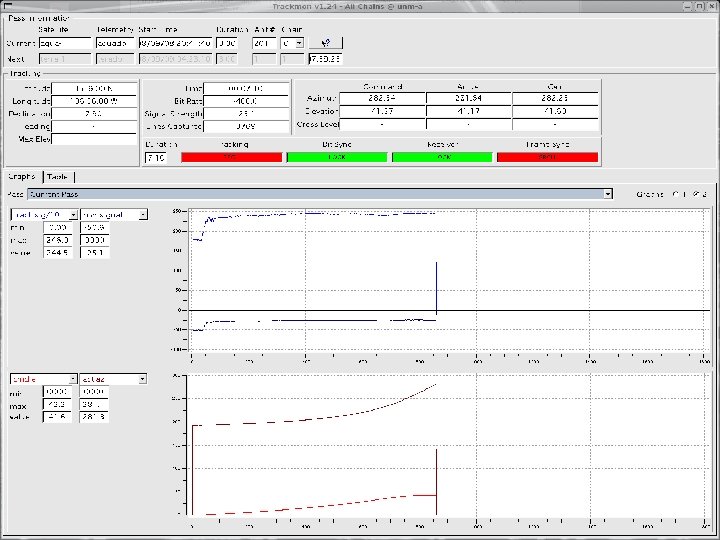
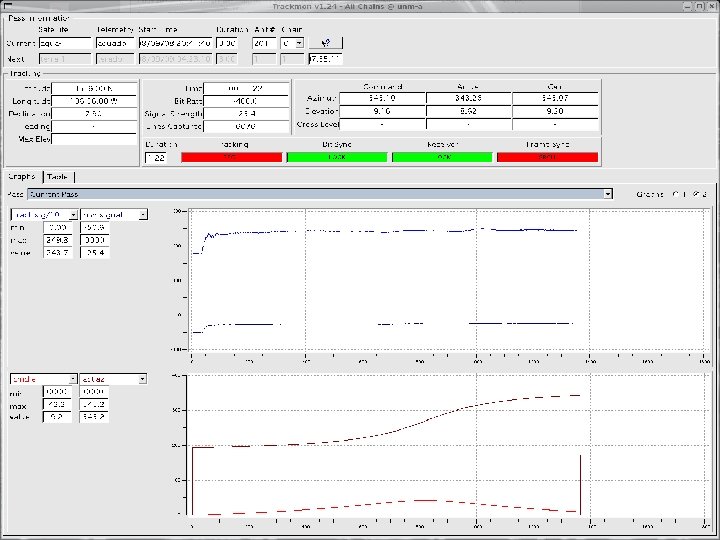
 11 minutes 30 seconds data acquisition 6171 lines ~1 gb raw data
:") CREATE Hardware & Facilities CREATE at the UNM Center for High Performance Computing (HPC): • • • High speed data transfer from UNM research park 5 Node (2 CPU) Terascan Linux processing cluster, 20 Tb of storage Dual quad-core 32 gb Linux NASA IPOPP processing server 4/7 Tb storage Linux data distribution server (create. hpc. unm. edu): 7 Tb of storage Create processing and research laboratory: Linux, MAC, Windows processing servers, image processing software Processing and Distribution Servers CREATE Research Lab Automated processing cluster
CREATE Hardware & Facilities CREATE at the UNM Center for High Performance Computing (HPC): • • • High speed data transfer from UNM research park 5 Node (2 CPU) Terascan Linux processing cluster, 20 Tb of storage Dual quad-core 32 gb Linux NASA IPOPP processing server 4/7 Tb storage Linux data distribution server (create. hpc. unm. edu): 7 Tb of storage Create processing and research laboratory: Linux, MAC, Windows processing servers, image processing software Processing and Distribution Servers CREATE Research Lab Automated processing cluster
 Processing Flow Level 0 Level 1 and Geocorrection") Tera. Scan MODIS (“NASA DAAC”) Processing Flow Level 0 Level 1 and Geocorrection
Tera. Scan MODIS (“NASA DAAC”) Processing Flow Level 0 Level 1 and Geocorrection
 CREATE - Alpha Test Site Transition MODIS VIIRS
 MODIS DATA Processing System Process-bound -waiting for single large product generation Generation of Level 1 Data (1 km, hkm, qkm radiance data products etc. ) Generation of MODIS Level 0 PDS Data, secondary transfer to RAID archive Data transfer to processing sever 10 Minutes System Processor-bound -queue waiting for large number of individual product generation Generation of Level 2 data - hdf, (tdf) and Geo. Tiff data products NDVI/EVI Data Processing Generation of secondary cloud products Data clean-up, transfer and archive Retrieval of ancillary data from GSFC, SSEC etc.
 09 September 2008 16: 32 UTC Corrected Reflectance MODIS Bands 1, 4, 3 = R, G, B With Fire Probability Hurricane Ike
 09 September 2008 16: 32 UTC Cloud Properties and Mask
") 09 September 2008 Day 16: 32 UTC Normalized Difference Vegetation Index (NDVI)
09 September 2008 Day 16: 32 UTC Normalized Difference Vegetation Index (NDVI)
 09 September 2008 16: 32 UTC Land Surface Temperature
 09 September 2008 16: 32 UTC Sea Surface Temperature
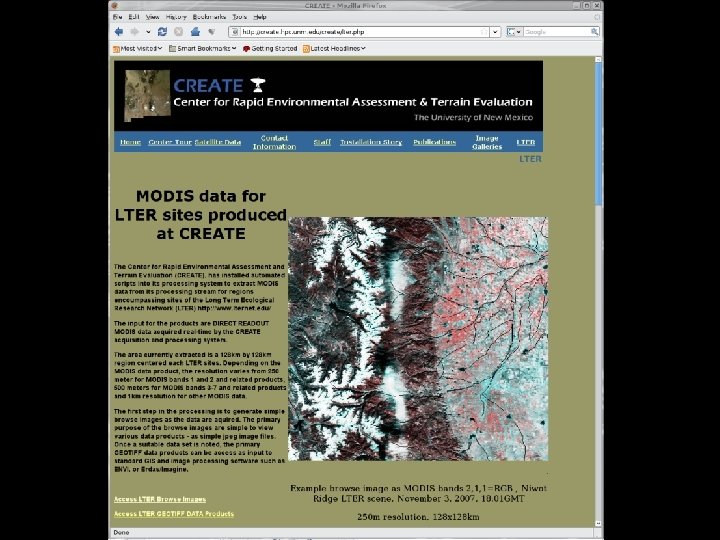
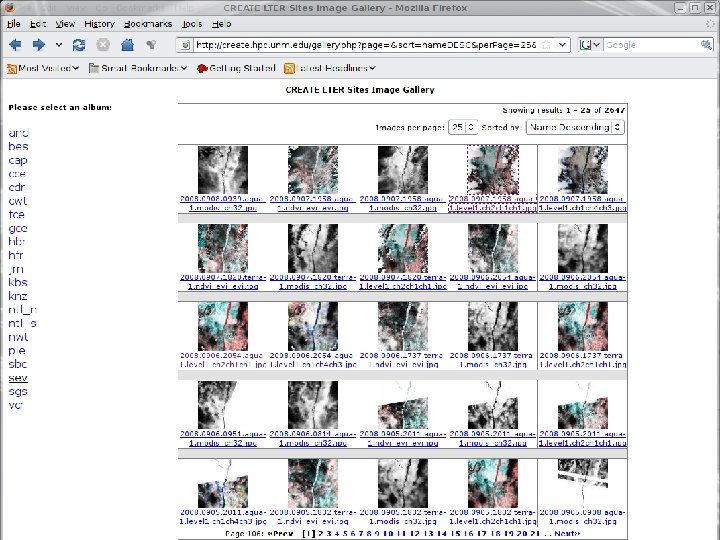
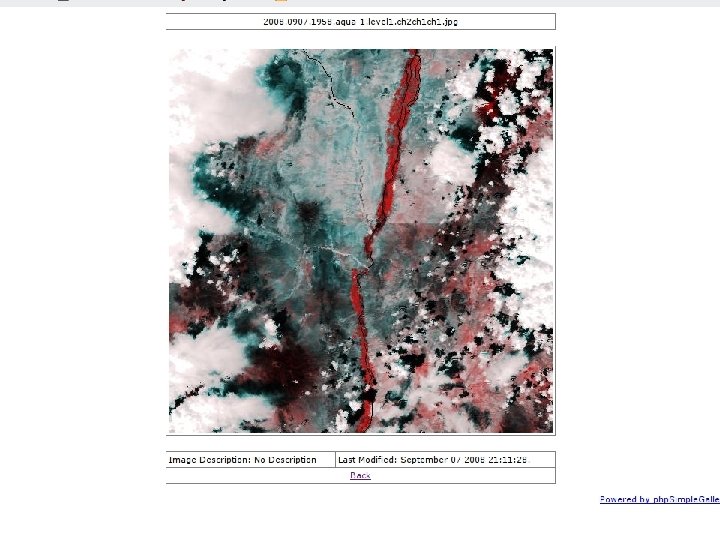
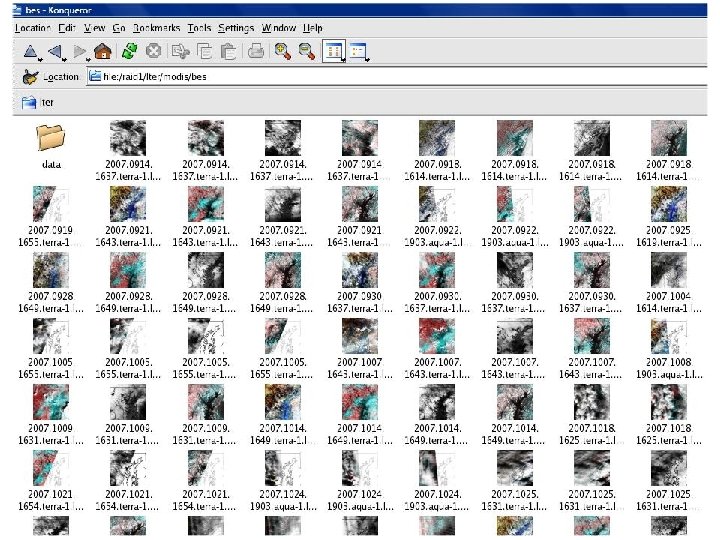
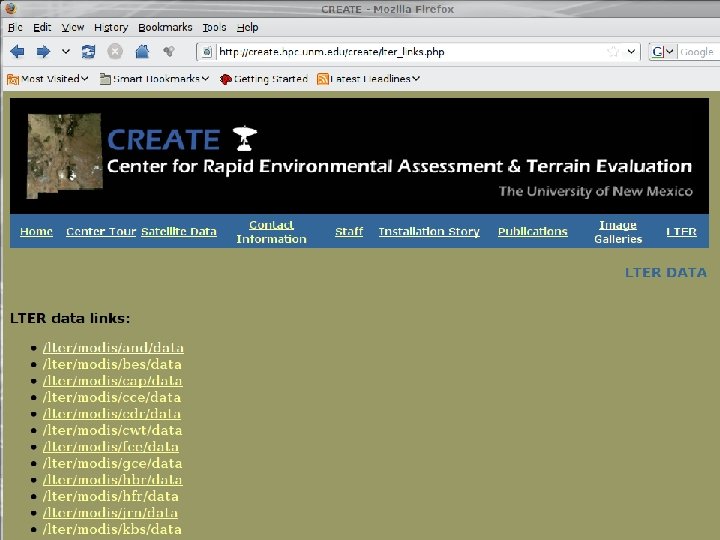
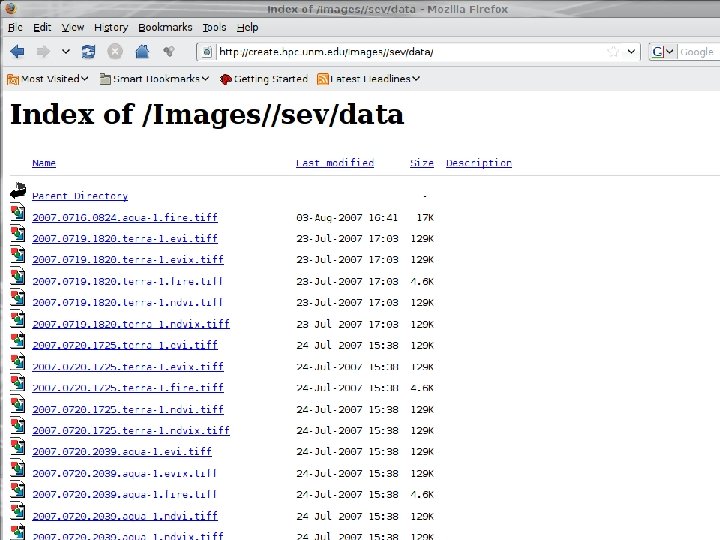
 Real-time data for NSF LTER research sites
 H. J Andrews LTER Parameter file (boundary, projection Ignore script if < 40% data Remove all files aged 40 days Wait for input data here Output name template Store data in consistent place

 False Color Raw NDVI Processed NDVI with Cloud Mask July 23, 2007 AQUA MODIS 128 x 128 km x 250 m centered on Sevilleta LTER
 False-Color Validated SST SBC - July 24, 2007 18: 53 GMT
 New Mexico Department of Health: Tracking Health outcome data: State employee absenteeism, asthma, heat related ER visits, mortalities linkage Air quality data: pollen counts, ozone, temperature Satellite data: NDVI, Land surface temperature linkage
 Prototype NM Health Tracking Website To Link Environmental Data with Indices of Lost Work Days, Asthma Occurrence and Hospitalizations
 Total Pollen Count 3, 000 Mulberry Juniper Ash January December
 Comparison of Urban and Reference Regions Daily MODIS NDVI Estimates
 New Mexico Wildfire Smoke Plume
 NOAA 18 AVHRR September 10, 2008 07: 16 UTC
 http: //create. unm. edu