

9ca527151de853234873829d1efa4ba2.ppt
- Количество слайдов: 32
 Storm Damage Assessment Protocol Developers 1997 -2006 n USDA FS, Northeastern Area, Center for Urban & Community Forestry n Davey Resource Group
 Overview Quick Shot Sampling Protocol Estimating Engine Report Means Data Collection
 Quick shot
 What’s this all about? Easy and accurate estimate üTree storm damage üCosts for recovery Data quality and integrity Simple method Quick reporting
 Context of use Planning üFramed by overall natural disaster plan n FEMA funding: Pre-Disaster Mitigation Program n Tree Emergency Plan Worksheet (Burban) Recovery üFirst 24 hours üResponse to state emergency agency
 Pre-storm setup üCreate random sample n Before emergency! n Use electronic or manual means üMeasure tree density and size class n Within ROW n Also 50’ back from ROW edge üTake final steps n Pre-Storm report form: useful estimate n Storage for future use
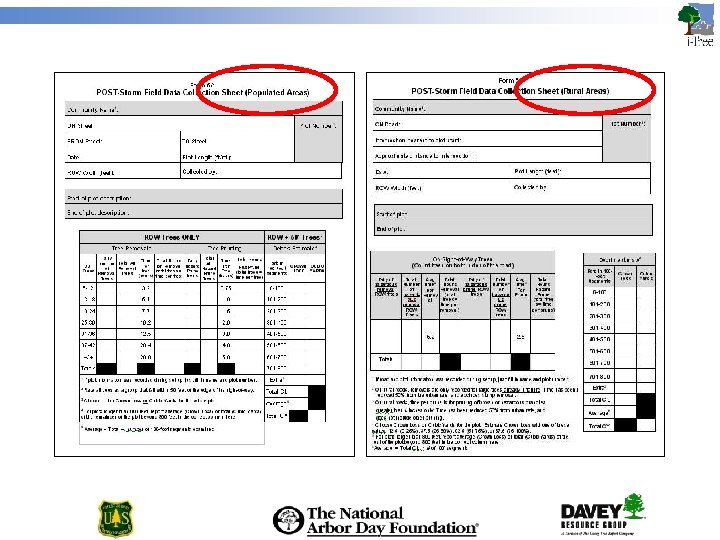
 Post-storm work Revisit sample segments ü Record for all trees within 50’ of ROW n Choose method of estimating debris (by segment) ¨ ¨ Indirect by average crown loss class § 0 -25%, 26 -50%, etc. § Historical records form basis § Loss category images available from FS Direct as CY of debris n Hazard pruning by size class n Hazard removal by size class ü Paper or PDAs Enter data, report results
 Sampling protocol
 Based on random sampling General discussion earlier Storm type üTested for ice storms n Low variance n 2% sample got within 5% of true value in field test üNot tested for wind storms n Larger variance n May affect required sample size Area of ongoing i-Tree research
 Estimating Engine
 Spreadsheet Estimator built as Excel® spreadsheet ü 6 worksheets n Home/Read. Me – navigation, help n Pre. Storm Data – setup data n Pre. Storm Analysis – preliminary analysis n Post. Storm Data – damage data n Post. Storm Analysis – report form n Codes, lookup tables – functional elements Use of Excel® based on user survey
 Hyperlinks for easy navigation
 Report Means
 Procedure Estimation üStarts with field data üUses local costs üScales up with simple formulas Calculation page = report üCredibility üEase, speed
 Validation Sampling indicated on report üMeans of random sampling üPercent of street miles sampled Numbers derived right on sheet üDebris üPruning, removal Local costs shown
 These values can be adjusted by end user
 Data Collection
 Data collection Means üPaper forms üPDAs
 Paper forms

 Manual data entry Easiest to use Excel’s entry form ü Highlight top row of headers ü On menu, click Data Form ü Ignore any error message! Can also just start typing at cell A 1
 Paper advantages Low cost No technical training No batteries Tough Always have backup to electronic Currently only way to record nonlinear plots
 Paper disadvantages Error-prone üDecipherment üQA harder Can be slower in field Much slower in office
 PDAs
PDAs
 Hardware i-Tree only supports Pocket PC operating system Cost ü $200 -400 or more Making the choice ü Online n Search “PDA review” n CNET. com, PCMAG. com, etc. ü Local merchant
 Software: handheld Installed on handheld through Start menu Data uploaded automatically during synchronization Details in Manual
 Software: desktop Management of data and applications Simple, intuitive Details in Manual
 Desktop interface Installs with single double-click Requires user input üCommunity name üStreet mileage üRandom selection file location üNew Interface makes this automatic Places field data into spreadsheet
 PDA Advantages Fast data collection Low error rate No data entry Many processes automated
 PDA Disadvantages Up-front equipment expense Training required Low battery life in cold üSome PDAs have battery packs available Units not protected üPlastic freezer bag often sufficient üWaterproof cases (e. g. , Otter) available
 Exercise!