73993bf34d7671db23fd61fe0327d3a1.ppt
- Количество слайдов: 38


Steps towards a Web Data Laboratory: data analysis for the 21 st Century M. Benno Blumenthal International Research Institute for Climate and Society Columbia University http: //iridl. ldeo. columbia. edu/

Data Analysis as a Service • The Data Library's open data model and ability to create networks of virtual web pages and other web resources leads to some powerful applications • As datasets become more complicated and difficult to handle, systems that hide that complexity and facilitate analysis become more essential • Metadata and its transforms are essential • Archived but accessible data are ever more important
")
Complexity pervades (*)

Overview URL/URI for data, calculations, figs, etc

IRI Data Collection Ocean/Atm “geolocated by lat/lon” multidimensional spectral harmonics equal-area grids GRIB grid codes climate divisions GIS “geolocation by vector object or projection metadata”

IRI Data Collection

IRI Data Collection

IRI General Data Tools Data Page

IRI General Data Tools Data Viewer
 (link: svd results dataset) (link: svd")
IRI General Data Tools Calculations: svd (link: svdview) (link: svd results dataset) (link: svd documentation)

svd program
 (link: cluster results dataset)")
IRI General Data Tools Calculations: Cluster Analysis (link: cluster view) (link: cluster results dataset) (link: k-means fn)
")
IRI General Data Tools WMS and KML: land cover (link: figure page)
")
IRI General Data Tools WMS and KML: precipitation (link: figure page)

IRI Map Room

IRI Map Room Malaria Early Warning System • Front page illustrates most recent dekadal rainfall estimates (FEWS RFE) • Administrative and epidemiological overlays available • Change dates to view different time periods • Click and drag box across map to zoom

IRI Map Room MEWS Time Series Analyses STEP 1: Select size of domain for analysis Administrative District OR Box – 11 km, 33 km, 55 km, 111 km STEP 2: Select location for which analysis will be created

IRI Map Room MEWS Time Series Analyses
 District")
MEWS tool transparently interrelates the three geospatial models Dekadal precipitation (longitude, latitude, time) District outlines Time series for districts (generated on-the-fly) from first two
")
Faceted Search (link)

Models, Crosswalks, and Objects in a single RDF/OWL framework

RDF Data Model Exchange Standard metadata schema RDF

IRI RDF Architecture MMI Data Servers Ontologies JPL bibliography Start Point Standards Organizations RDF/XML-Schema Crawler XSLT/GRDDL ingest XML Schema to OWL translation Owl Semantics SWRL Rules Se. RQL CONSTRUCT Sesame Search Queries Search Interface Location Canonicalizer Time Canonicalizer

Semantic Crosswalk for metadata translation

Semantic metadata translation: maproom to GCMD DIF

Sample GCMD DIF-CD Record

Open. DAP CF to WCS Service
")
Function Documentation (*)

Function Semantics Used to generate function documentation Basis for more extensive function semantics Eventually would like to use to generate workflows Currently working with SSWAP to insure that it can describe these workflow steps: e. g. variable to transformed variable and variable to figure to image file.

SSWAP Simple Semantic Web Architecture and Protocol A way of providing a service that semantically describes its domain and range to advertise it. To invoke it, both domain and range are restricted. Traditionally we specify of chain of processing steps, and provenance documents that effort. SSWAP specifies an object by constraining it – you could specify its provenance to get it “traditionally”, or some other quality.

Multiplicity of Data Representations RDF provides a unifying framework to simultaneous hold and deliver dataset metadata according to multiple standards Models, Crosswalks, and Objects organizes that framework clarifying the semantic distance spanned bidirectional XML Schema to OWL translation enables delivery of inferred metadata to existing XML-based systems Persistence with inference/transform is the underlying technology Semantic Service Framework could extend this framework to semantically-informed workflow generation

Data Flow based Analysis with explicit semantics data analysis data

21 st Century data analysis • Definitive web-accessible data archives • Cloud data analysis services based on those archives • Semantic descriptions of datasets • Semantic descriptions of analysis steps • Semantic assembly of workflow pipelines Science is about reproducibility, as are virtual dataset services. This means access to the data, access to the analysis methods, and commitment to archives.

Other Maproom Examples

I. Food Security: Application At the request of the UN FAO, a web-based tool was created to support Desert Locust management and control • Eliminates NDVI-based error for identification of locust habitat • Adds daily and 10 -day CMORPH rainfall estimates for identification of potential breeding areas Michael Bell, Benno Blumenthal

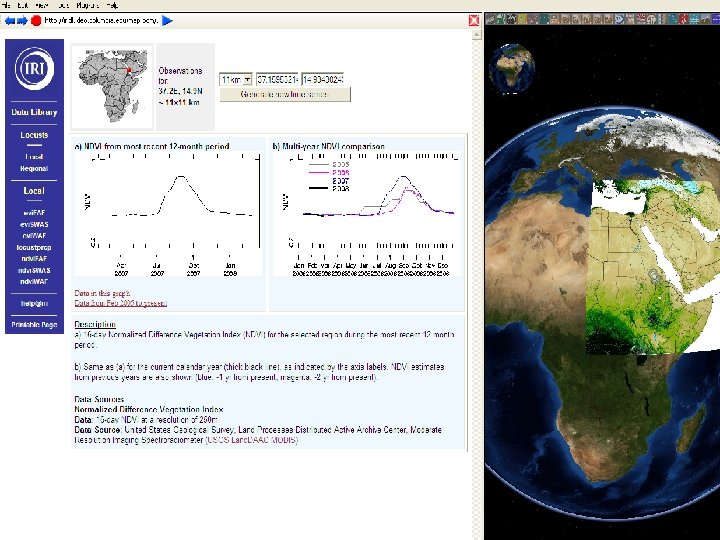
I. Human Health: Application MODIS images: composite and NDVI are now available through IRI Health Maproom Ministry of Health in Eritrea follows NDVI indices on regular basis and provides warnings to the sub-districts Michael Bell, Benno Blumenthal, John del Corral, Emily Grover-Kopec

Fire Management Michael Bell, Benno Blumenthal, Joshua Qian, Andy Robertson, Michael Tippett Presentation of the tool to CARE and Ministry of Environment (Indonesia). Improvement and publications are in progress
73993bf34d7671db23fd61fe0327d3a1.ppt