
STAT 6202 Chapter 3 2012/2013 1 ICA

- Размер: 850.5 Кб
- Количество слайдов: 26
Описание презентации STAT 6202 Chapter 3 2012/2013 1 ICA по слайдам
STAT 6202 Chapter 3 2012/2013 1 ICA WHEN: 14 Nov 2012 : 45 minutes in in “normal” lecture period WHERE: A -… : : WHAT: o Tutorial exercises: 1, 2, 3, 4, 5 o Course notes: chapters 1, 2, 3, 4, 5 and sections 6. 1 — 6. 5 o Lectures: all lectures concerning the above FORMAT: open book (any written material) CALCULATORS: only college approved calculators! NOTE: not only final (numerical) answer important but also clarity of answer! o Make sure to include reasoning, and o if applicable: formula – substitutions – final numerical outcome IF YOU NEED EXTRA TIME EMAIL VERA@STATS. UCL. AC. UK AND F. GILLOWAY@UCL. AC. UK ASAP
STAT 6202 Chapter 3 2012/2013 2 CHAPTER 3 The Normal Distribution POPULATION VERSUS SAMPLE — NOTATION NORMAL DISTRIBUTION — THE IDEA DEFINITION AND PARAMETERS PROBABILITIES AND VARIABLES THREE PROBABILITY RULES PERCENTAGE POINTS
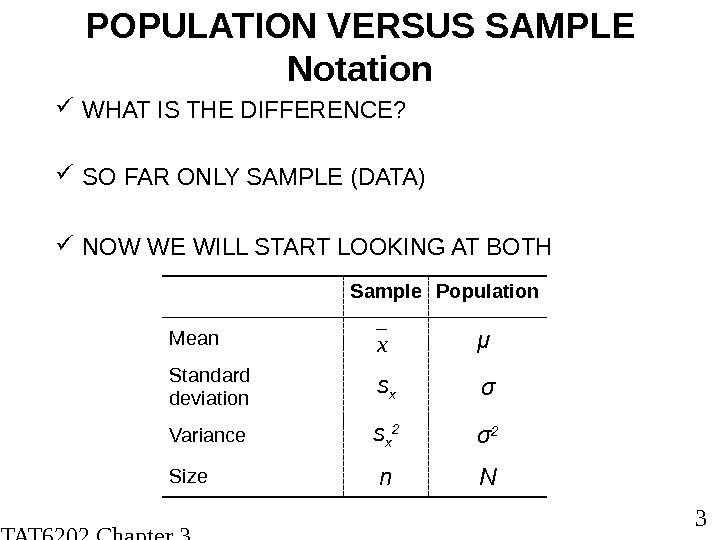
STAT 6202 Chapter 3 2012/2013 3 POPULATION VERSUS SAMPLE Notation WHAT IS THE DIFFERENCE? SO FAR ONLY SAMPLE (DATA) NOW WE WILL START LOOKING AT BOTH Sample Population Mean μ Standard deviation s x σ Variance s x 2 σ 2 Size n Nx
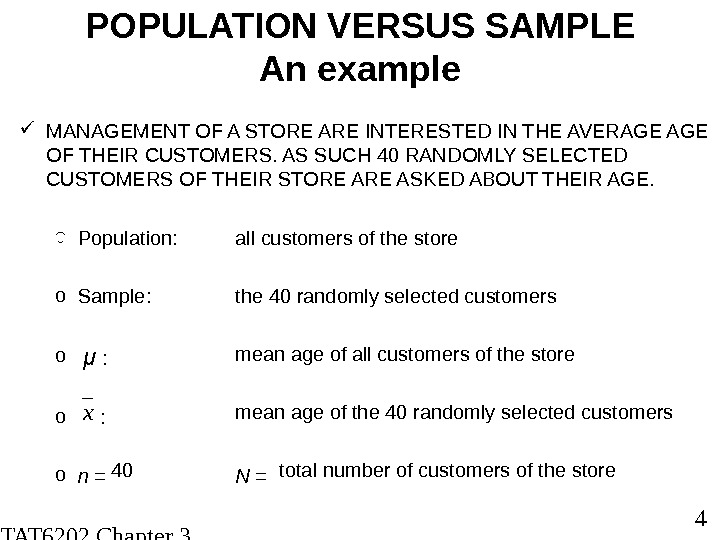
STAT 6202 Chapter 3 2012/2013 4 POPULATION VERSUS SAMPLE An example MANAGEMENT OF A STORE ARE INTERESTED IN THE AVERAGE OF THEIR CUSTOMERS. AS SUCH 40 RANDOMLY SELECTED CUSTOMERS OF THEIR STORE ASKED ABOUT THEIR AGE. o Population: o Sample: o μ : o n = N =xo all customers of the store o the 40 randomly selected customers mean age of all customers of the store : mean age of the 40 randomly selected customers 40 total number of customers of the store
STAT 6202 Chapter 3 2012/2013 5 CHAPTER 3 The Normal Distribution POPULATION VERSUS SAMPLE — NOTATION NORMAL DISTRIBUTION — THE IDEA DEFINITION AND PARAMETERS PROBABILITIES AND VARIABLES THREE PROBABILITY RULES PERCENTAGE POINTS
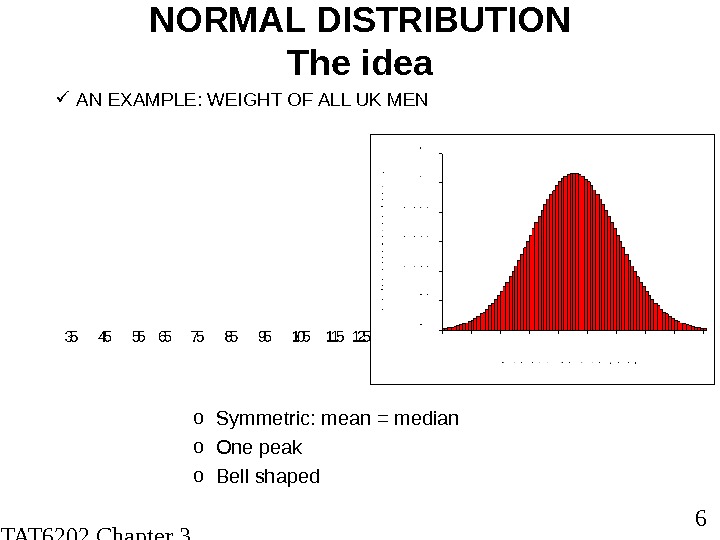
STAT 6202 Chapter 3 2012/2013 6 NORMAL DISTRIBUTION The idea AN EXAMPLE: WEIGHT OF ALL UK MEN o Symmetric: mean = median o One peak o Bell shaped
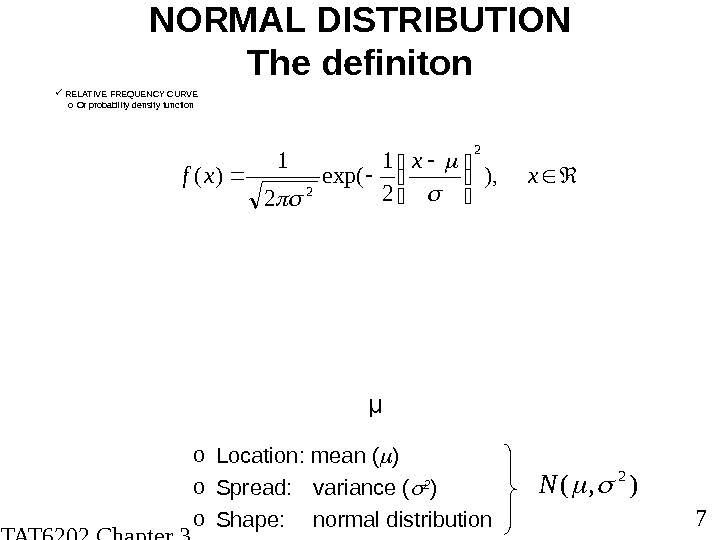
STAT 6202 Chapter 3 2012/2013 7 NORMAL DISTRIBUTION The definiton o Location: mean ( ) o Spread: variance ( 2 ) o Shape: normal distribution RELATIVE FREQUENCY CURVE o Or probability density function), ( 2 N xx xf ), 21 exp( 2 1 )(
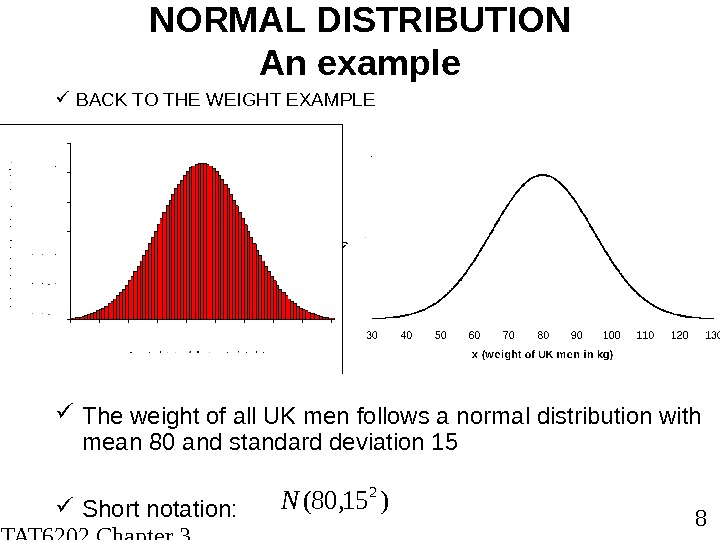
STAT 6202 Chapter 3 2012/2013 8 The weight of all UK men follows a normal distribution with mean 80 and standard deviation 15 Short notation: NORMAL DISTRIBUTION An example BACK TO THE WEIGHT EXAMPLE)15, 80( 2 N
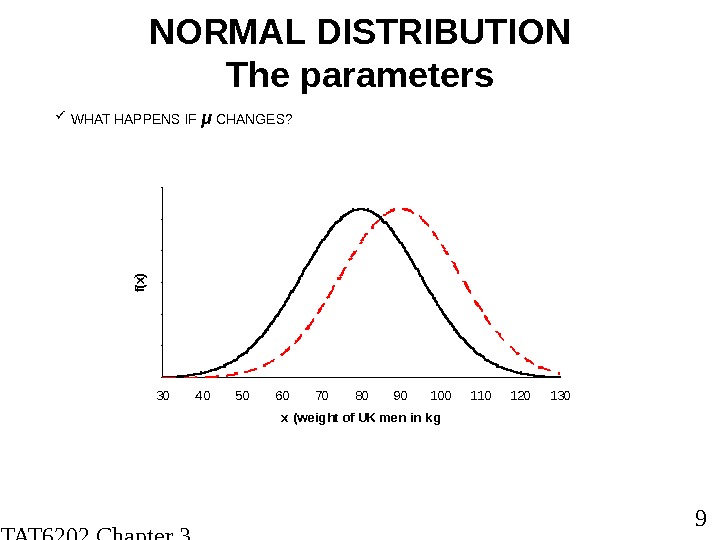
STAT 6202 Chapter 3 2012/2013 9 NORMAL DISTRIBUTION The parameters WHAT HAPPENS IF μ CHANGES ? 00. 0 0 5 0. 0 1 5 0. 0 2 5 0. 0 330405060708090100110120130 x (weight of UK men in kg f(x)
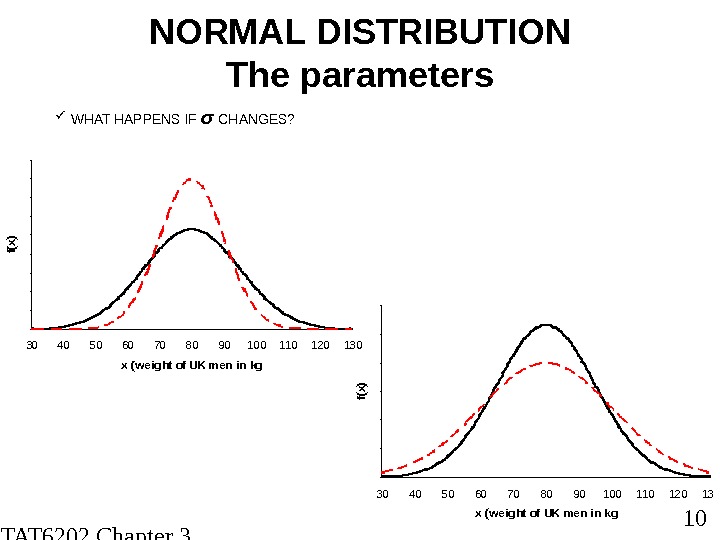
STAT 6202 Chapter 3 2012/2013 10 NORMAL DISTRIBUTION The parameters WHAT HAPPENS IF σ CHANGES ? 00. 0 0 5 0. 0 1 5 0. 0 2 5 0. 0 3 5 0. 0 4 530405060708090100110120130 x (weight of UK men in kg f(x) 0 0 5 0. 0 1 5 0. 0 2 5 0. 0 3 30405060708090100110120130 x (weight of UK men in kg f(x)
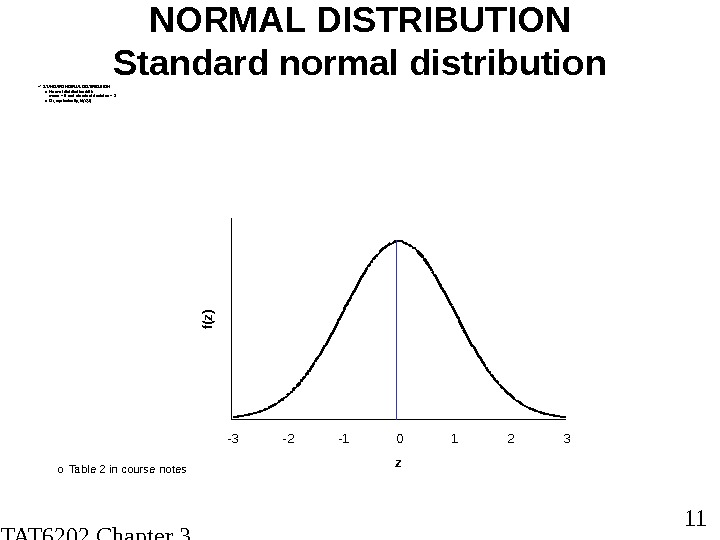
STAT 6202 Chapter 3 2012/2013 11 NORMAL DISTRIBUTION Standard normal distribution STANDARD NORM AL DISTRIBUTION o Normal distribution with mean = 0 and standard deviaton = 1 o Or, equivalently, N(0, 1) 05 E -0 4 0 , 0 0 10 , 0 0 20 , 0 0 30 , 0 0 40 , 0 0 5 -3 -2 -1 0 1 2 3 zf(z) o Table 2 in course notes
STAT 6202 Chapter 3 2012/2013 12 CHAPTER 3 The Normal Distribution POPULATION VERSUS SAMPLE — NOTATION NORMAL DISTRIBUTION — THE IDEA DEFINITION AND PARAMETERS PROBABILITIES AND VARIABLES THREE PROBABILITY RULES PERCENTAGE POINTS
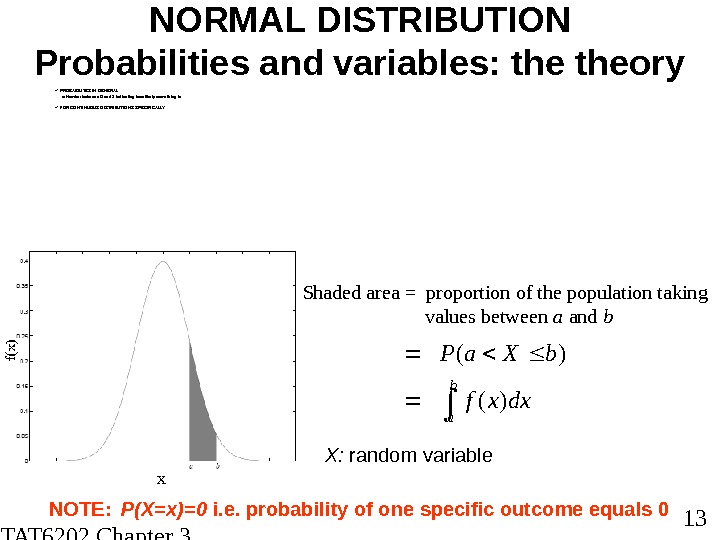
STAT 6202 Chapter 3 2012/2013 13 NORMAL DISTRIBUTION Probabilities and variables: theory PROBABILITES IN GENERAL o Number between 0 and 1 indicating how likely something is FOR CONTINUOUS DISTRIBUTIONS SPECIFICALLY b a dxxf b. Xa. P )( )( Shaded area = proportion of the population taking values between a and b xf(x) X: random variable NOTE: P(X=x)=0 i. e. probability of one specific outcome equals
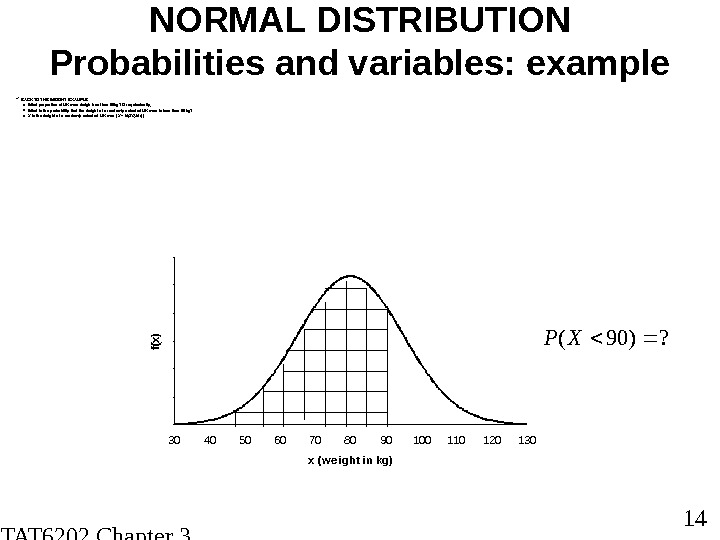
STAT 6202 Chapter 3 2012/2013 14 NORMAL DISTRIBUTION Probabilities and variables: example BACK TO THE WEIGHT EXAMPLE o What proport ion of UK men weigh less t han 90 kg? Or equivalently, o What is the probability that t he weight of a randomly selected UK man is less t han 90 kg? o X is the weight of a randomly selected UK man ( X ~ N(80, 15 2 )) 00 , 0 0 5 0 , 0 1 5 0 , 0 2 5 0 , 0 3 30 40 50 60 70 80 90 100 110 120 130 x (w eight in kg)f(x)00 , 0 0 5 0 , 0 1 5 0 , 0 2 5 0 , 0 3 30 40 50 60 70 80 90 100 110 120 130 x (w eight in kg) f(x)? )90(XP
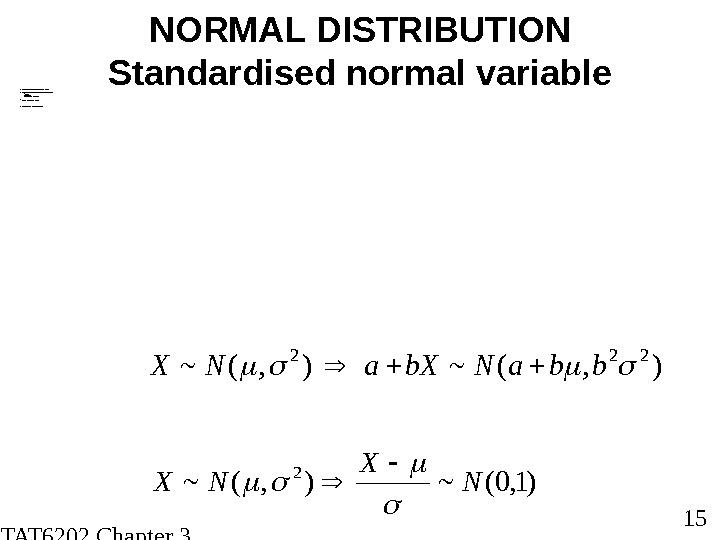
STAT 6202 Chapter 3 2012/2013 15 NORMAL DISTRIBUTION Standardised normal variable S TAN DA RD N OR M AL DI ST RI BUT I ONS : N(0, 1) R EM EM BER LI N EAR T RA NS FOR M AT I ON S? a + b x i M eans? Var ian ces? St andar di sed vari abl es? LI N EAR T RA N SFOR M AT I ONS S TAN DA RDIS ED N OR MA L VAR IA BLE)1, 0(~), (~ 2 N X NX ), (~ 222 bba. Nb. Xa. NX
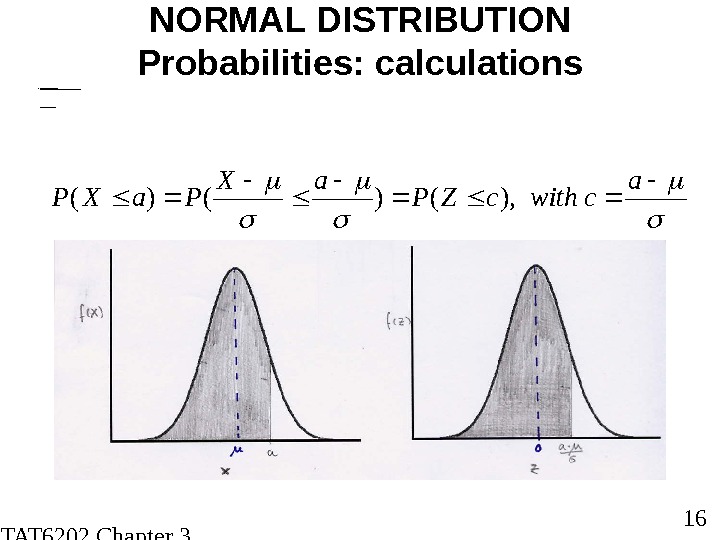
STAT 6202 Chapter 3 2012/2013 16 NORMAL DISTRIBUTION Probabilities: calculations FOR NOR MA L DIS T R IBUT IONS o Tr ansl at e pr ob ab il it y in t er ms of st andar d nor m all y d ist r ibu ted var i able o T hen use stat i st i cal t ab le 2 a cwithc. ZP a. X Pa. XP), ()()(
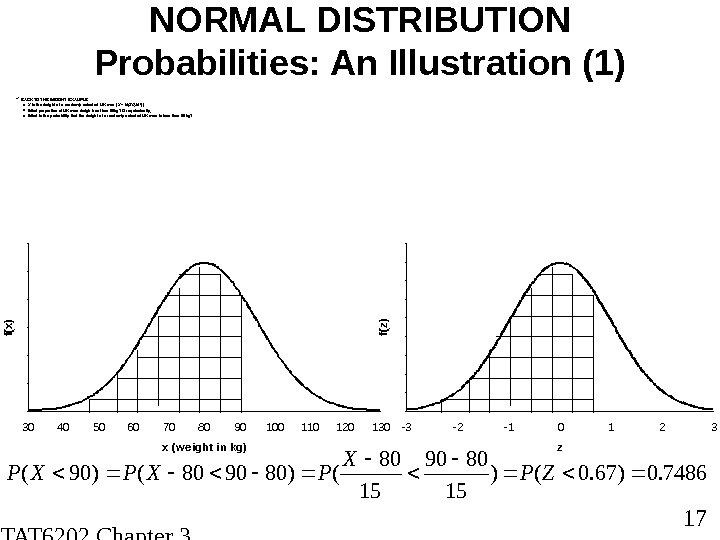
STAT 6202 Chapter 3 2012/2013 17 NORMAL DISTRIBUTION Probabilities: An Illustration (1) BACK TO THE WEIGHT EXAMPLE o X is the weight of a randomly selected UK man ( X ~ N(80, 15 2 )) o What proport ion of UK men weigh less t han 90 kg? Or equivalently, o What is the probability that t he weight of a randomly selected UK man is less t han 90 kg? 7486. 0)67. 0() 15 8090 15 80 ()809080()90( ZP X PXPXP 00 , 0 0 5 0 , 0 10 , 0 1 5 0 , 0 20 , 0 2 5 0 , 0 3 30 40 50 60 70 80 90 100 110 120 130 x (w e ight in kg) f(x) 05 E -0 4 0 , 0 0 10 , 0 0 20 , 0 0 30 , 0 0 40 , 0 0 5 -3 -2 -1 0 1 2 3 z f(z)
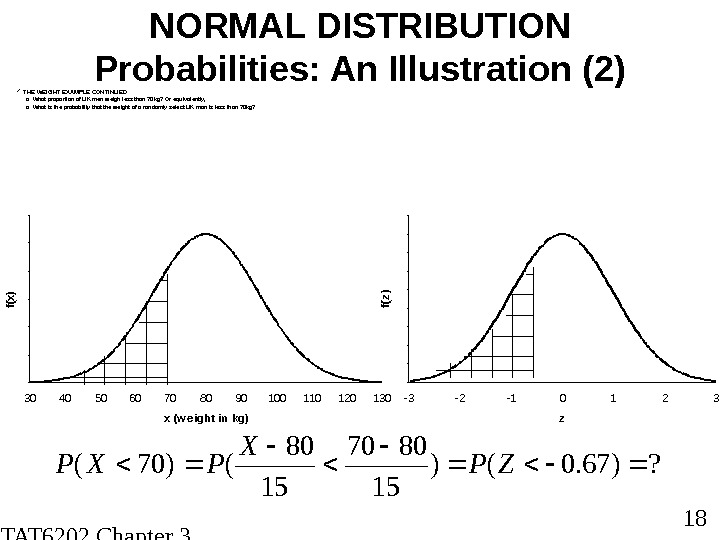
STAT 6202 Chapter 3 2012/2013 18 NORMAL DISTRIBUTION Probabilities: An Illustration (2) THE WEIGHT EXAMPLE CONTINUED o What proportion of UK men weigh less than 70 kg? Or equivalently, o What is the probability that the weight of a randomly select UK man is less than 70 kg? 00 , 0 0 5 0 , 0 1 5 0 , 0 2 5 0 , 0 3 30 40 50 60 70 80 90 100 110 120 130 x (w e ight in kg)f(x) 05 E -0 4 0 , 0 0 10 , 0 0 20 , 0 0 30 , 0 0 40 , 0 0 5 -3 -2 -1 0 1 2 3 z f(z) ? )67. 0() 15 8070 15 80 ()70( ZP X PXP
STAT 6202 Chapter 3 2012/2013 19 CHAPTER 3 The Normal Distribution POPULATION VERSUS SAMPLE — NOTATION NORMAL DISTRIBUTION — THE IDEA DEFINITION AND PARAMETERS PROBABILITIES AND VARIABLES THREE PROBABILITY RULES PERCENTAGE POINTS
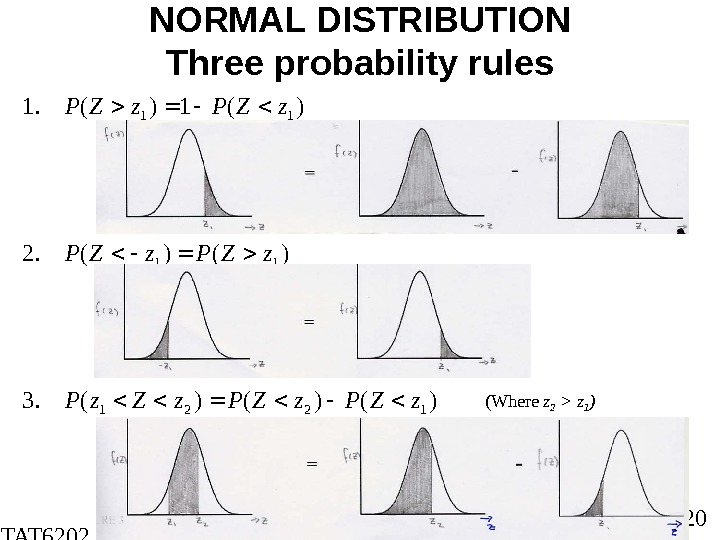
STAT 6202 Chapter 3 2012/2013 20 NORMAL DISTRIBUTION Three probability rules)()()(. 3 )()(. 2 )(1)(. 1 1221 11 11 z. ZPz. Zz. P z. ZPz. ZP (Where z 2 > z 1 )
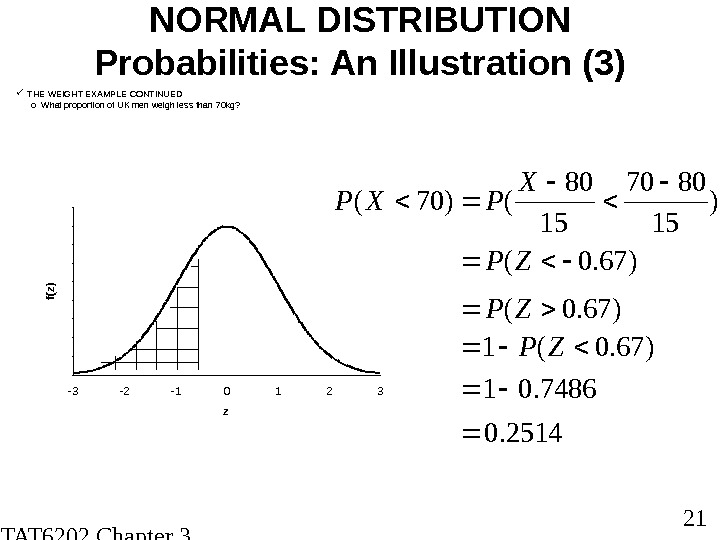
STAT 6202 Chapter 3 2012/2013 21 NORMAL DISTRIBUTION Probabilities: An Illustration (3) THE WEIGHT EXAMPLE CONTINUED o What proportion of UK men weigh less than 70 kg? 05 E -0 4 0 , 0 0 10 , 0 0 20 , 0 0 30 , 0 0 40 , 0 0 5 -3 -2 -1 0 1 2 3 zf(z)05 E -0 4 0 , 0 0 10 , 0 0 20 , 0 0 30 , 0 0 40 , 0 0 5 -3 -2 -1 0 1 2 3 z f(z) )67. 0( ) 15 8070 15 80 ()70( ZP X PXP )67. 0(ZP )67. 0(1 ZP 2514. 0 7486.
STAT 6202 Chapter 3 2012/2013 22 CHAPTER 3 The Normal Distribution POPULATION VERSUS SAMPLE — NOTATION NORMAL DISTRIBUTION — THE IDEA DEFINITION AND PARAMETERS PROBABILITIES AND VARIABLES THREE PROBABILITY RULES PERCENTAGE POINTS
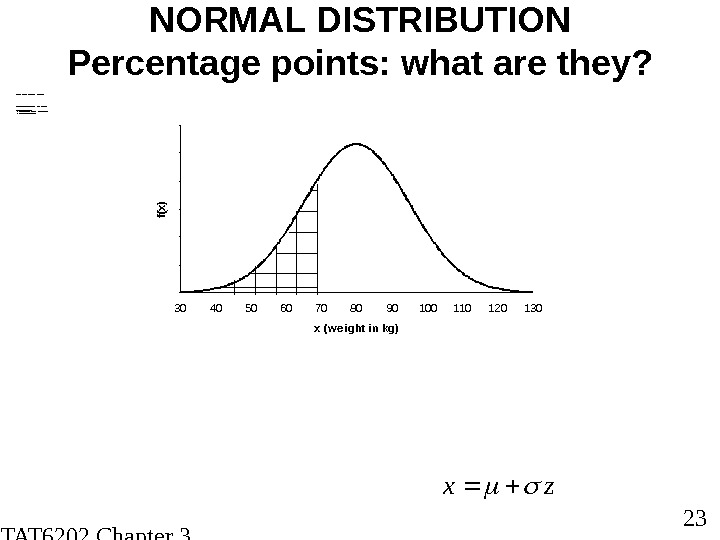
STAT 6202 Chapter 3 2012/2013 23 NORMAL DISTRIBUTION Percentage points: what are they? SO FA R WE HAVE LOOKE D AT: P (X <70) = ? N OW T HE OPPOS IT E PR OBLE M : P (X < ? ) = 0. 25 14 H OW TO G O ABOUT T H IS ? o Cal cul ate th e z -val ue f or which: P (Z < ? ) = 0. 2514 o Fi nd th e cor r espon ding x-value : 00 , 0 0 5 0 , 0 1 5 0 , 0 2 5 0 , 0 3 30 40 50 60 70 80 90 100 110 120 130 x (w e ight in kg)f(x) zx
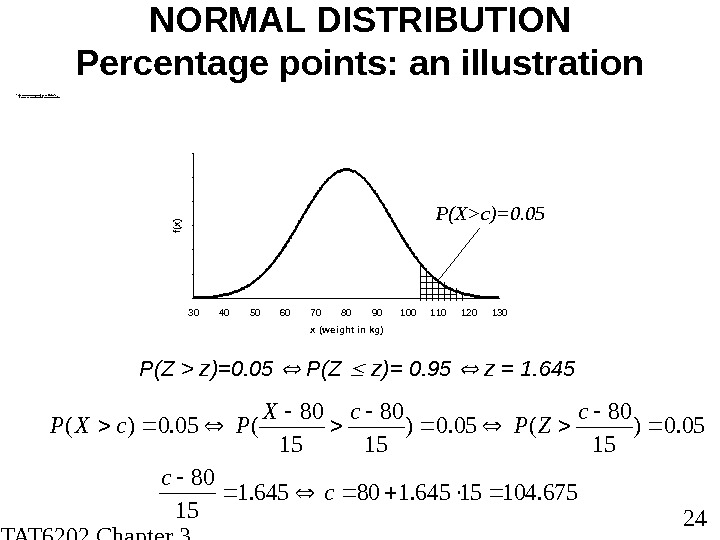
STAT 6202 Chapter 3 2012/2013 24 NORMAL DISTRIBUTION Percentage points: an illustration B ACK TO T H E WEI GHT EXAM P L E: N (80, 15 2 ) o Weight c such t hat 5% of men weigh more 675. 10415645. 180645. 1 15 80 c c 05. 0) 15 80 (05. 0)( c ZP c. X Pc. XP P(Z > z)=0. 05 P(Z z)= 0. 95 z = 1. 64500 , 0 0 5 0 , 0 10 , 0 1 5 0 , 0 20 , 0 2 5 0 , 0 3 30 40 50 60 70 80 90 100 110 120 130 x (w e ight in kg) f(x)00 , 0 0 5 0 , 0 10 , 0 1 5 0 , 0 20 , 0 2 5 0 , 0 3 30 40 50 60 70 80 90 100 110 120 130 x (w e ight in kg) f(x) Pr(X >x 1 )=0. 05 P(X>c)=0.
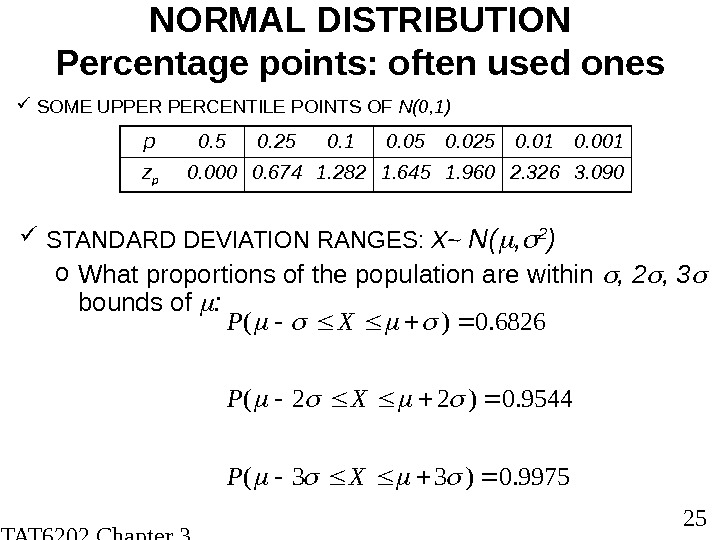
STAT 6202 Chapter 3 2012/2013 25 NORMAL DISTRIBUTION Percentage points: often used ones SOME UPPER PERCENTILE POINTS OF N(0, 1) p 0. 5 0. 25 0. 1 0. 05 0. 025 0. 01 0. 001 z p 0. 000 0. 674 1. 282 1. 645 1. 960 2. 326 3. 0909975. 0)33( 9544. 0)22( 6826. 0)( XP XP XP STANDARD DEVIATION RANGES: X~ N( , 2 ) o What proportions of the population are within , 2 , 3 bounds of :
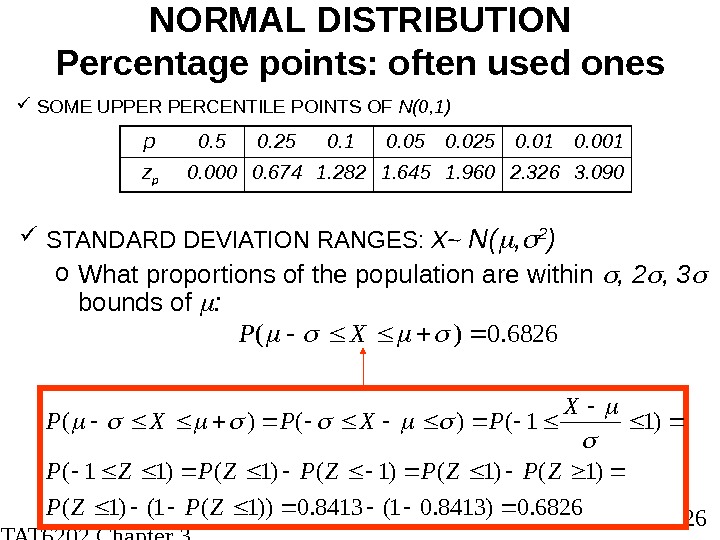
STAT 6202 Chapter 3 2012/2013 26 NORMAL DISTRIBUTION Percentage points: often used ones SOME UPPER PERCENTILE POINTS OF N(0, 1) p 0. 5 0. 25 0. 1 0. 05 0. 025 0. 01 0. 001 z p 0. 000 0. 674 1. 282 1. 645 1. 960 2. 326 3. 0906826. 0)(XP STANDARD DEVIATION RANGES: X~ N( , 2 ) o What proportions of the population are within , 2 , 3 bounds of : 6826. 0)8413. 01(8413. 0))1(1()1( )1()1()11()()( ZPZPZPZPZP X PXPXP