
Starter • In the back of your


- Размер: 1.1 Mегабайта
- Количество слайдов: 13
Описание презентации Starter • In the back of your по слайдам
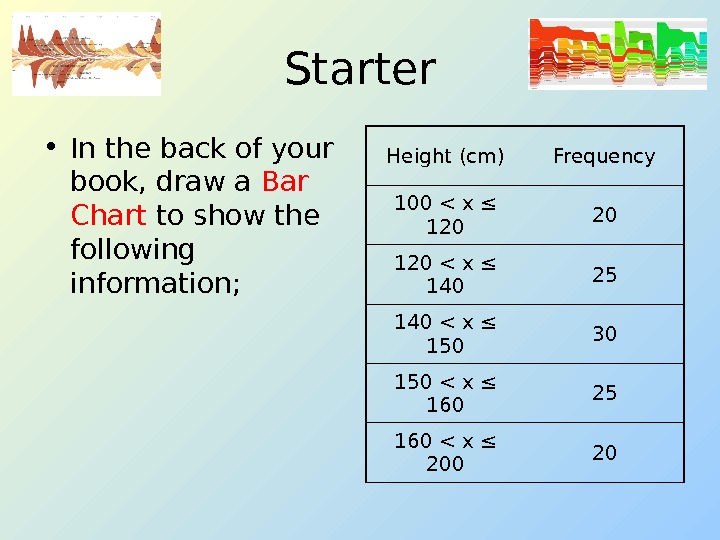
Starter • In the back of your book, draw a Bar Chart to show the following information; Height (cm) Frequency 100 < x ≤ 120 20 120 < x ≤ 140 25 140 < x ≤ 150 30 150 < x ≤ 160 25 160 < x ≤
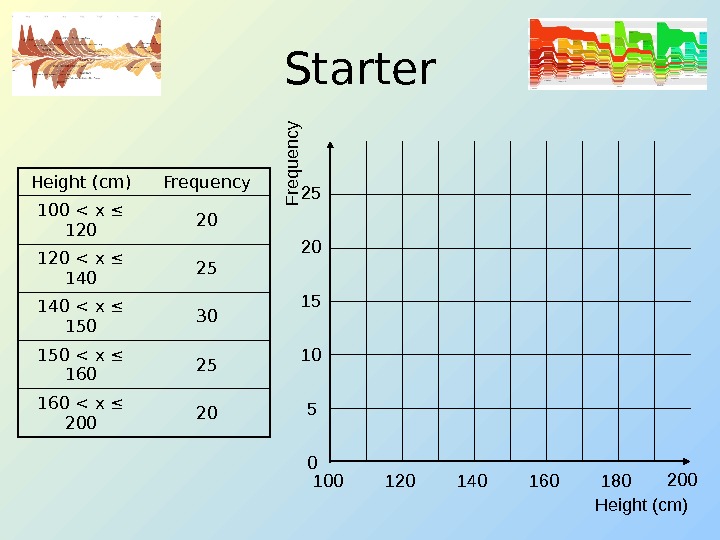
Starter Height (cm) Frequency 100 < x ≤ 120 20 120 < x ≤ 140 25 140 < x ≤ 150 30 150 < x ≤ 160 25 160 < x ≤ 200 20 Height (cm)F requ ency
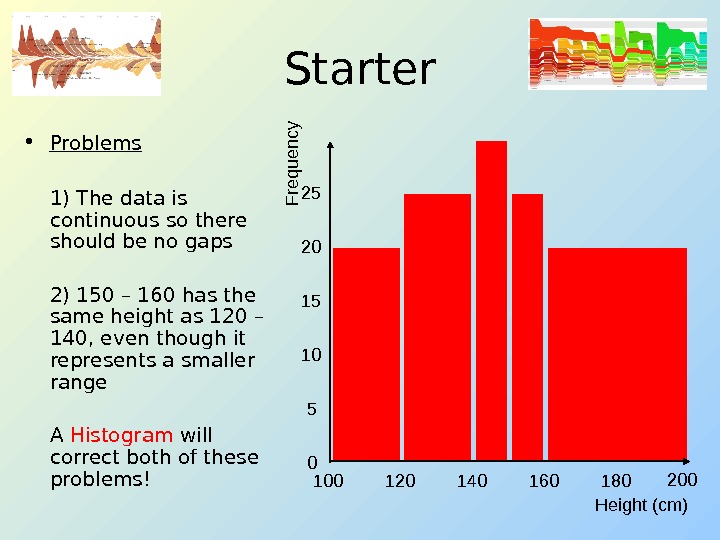
Starter • Problems 1) The data is continuous so there should be no gaps 2) 150 – 160 has the same height as 120 – 140, even though it represents a smaller range A Histogram will correct both of these problems! Height (cm)F requ ency
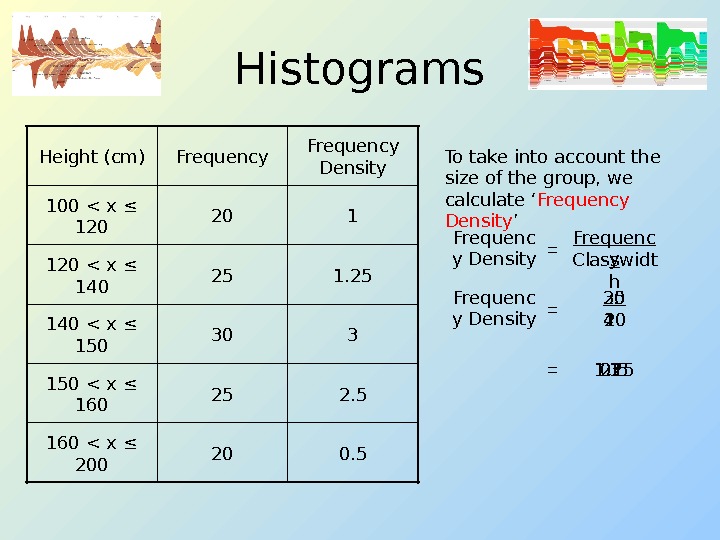
Histograms 2025302520 Frequency 0. 5160 < x ≤ 200 2. 5150 < x ≤ 160 3140 < x ≤ 150 1. 25120 < x ≤ 140 1100 < x ≤ 120 Frequency Density. Height (cm) To take into account the size of the group, we calculate ‘ Frequency Density ’ Frequenc y Density Frequenc y Classwidt h= Frequenc y Density 20 20= 1= 30 10 3= 25 20 1. 25= 20 40 0. 5= 25 10 2. 5=
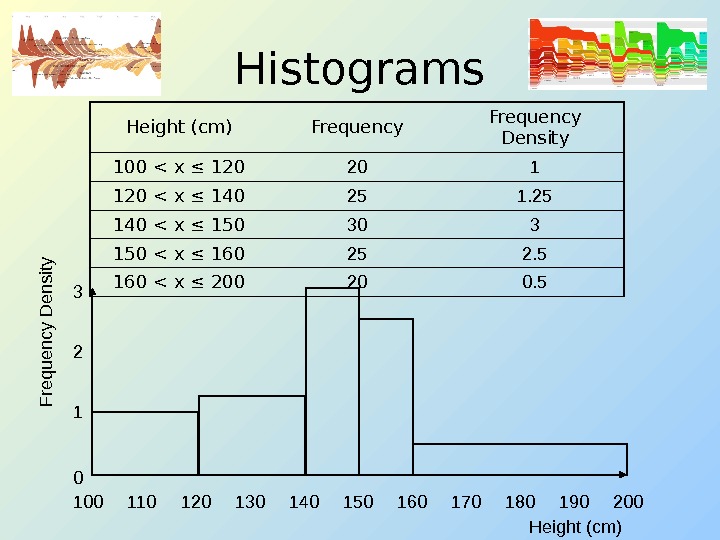
Histograms Height (cm) Frequency Density 100 < x ≤ 120 20 1 120 < x ≤ 140 25 140 < x ≤ 150 30 3 150 < x ≤ 160 25 2. 5 160 < x ≤ 200 20 0. 5 100 140130120 150 160 180170110 200190123 0 F requ ency D en sity Height (cm)
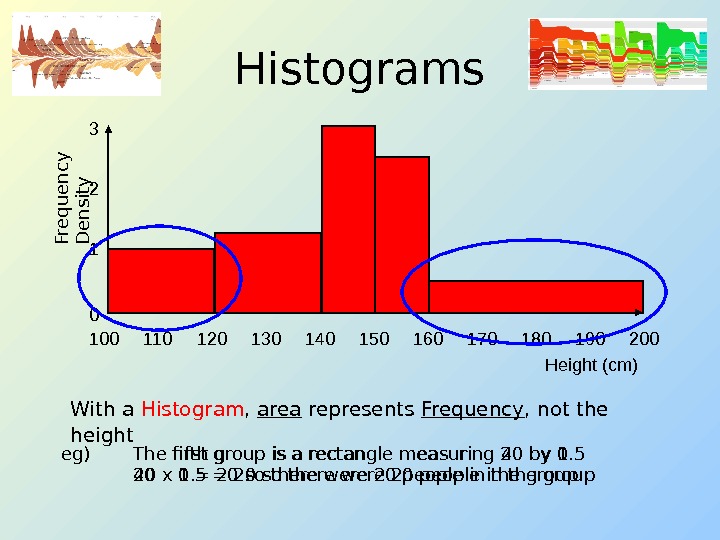
Histograms With a Histogram , area represents Frequency , not the height 100 140130120 150 160 180170110 200190123 0 Fre q u e n cy D e n sity Height (cm) eg) The first group is a rectangle measuring 20 by 1 20 x 1 = 20 so there were 20 people in the groupeg) The fifth group is a rectangle measuring 40 by 0. 5 40 x 0. 5 = 20 so there were 20 people in the group
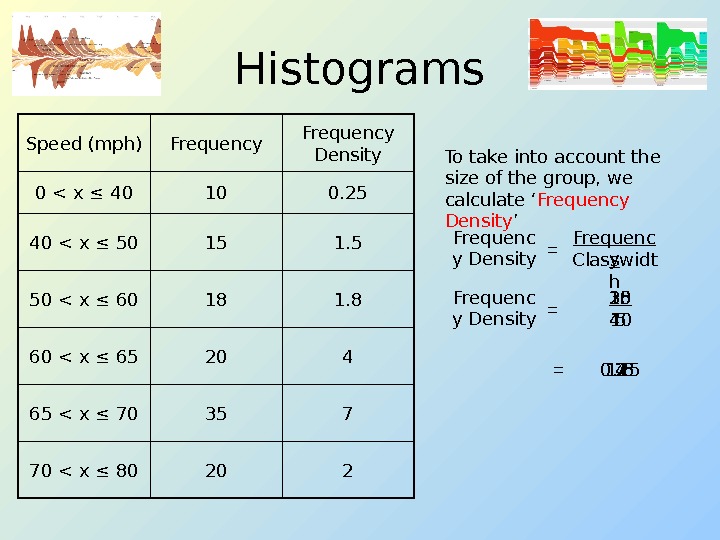
Histograms To take into account the size of the group, we calculate ‘ Frequency Density ’ Frequenc y Density Frequenc y Classwidt h= Frequenc y Density = 10 40 0. 25= 22070 < x ≤ 80 73565 < x ≤ 70 42060 < x ≤ 65 1. 81850 < x ≤ 60 1. 51540 < x ≤ 50 0. 25100 < x ≤ 40 Frequency Density. Frequency. Speed (mph) 18 10 1. 8= 35 5 7= 20 5 4= 15 10 1. 5= 20 10 2=
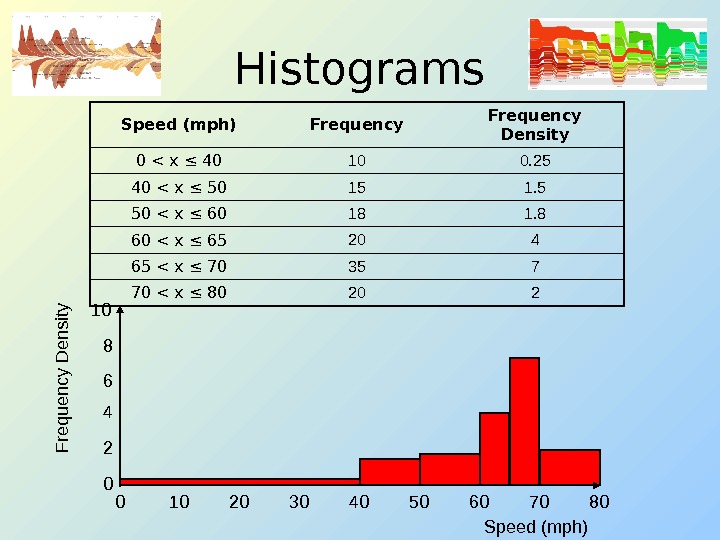
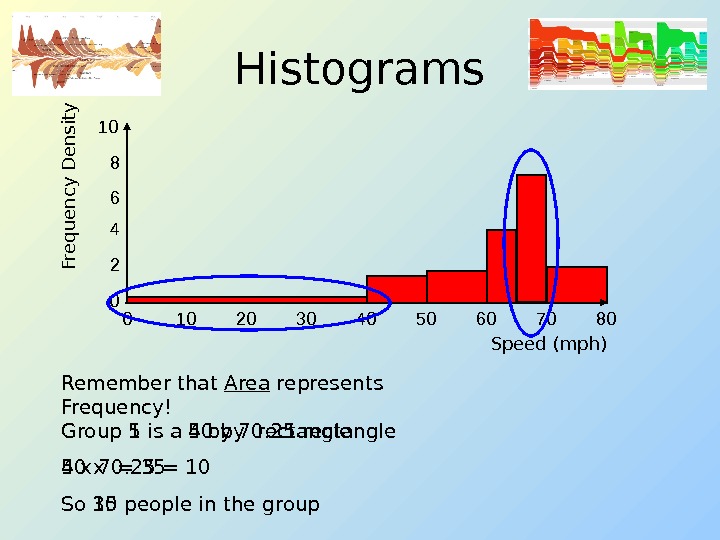
Histograms Speed (mph) Frequency Density 0 < x ≤ 40 10 0. 25 40 < x ≤ 50 15 1. 5 50 < x ≤ 60 18 1. 8 60 < x ≤ 65 20 4 65 < x ≤ 70 35 7 70 < x ≤ 80 20 2 0 8040302010 6050 7010 28 6 4 0 F requen cy D ensity Speed (mph)
Histograms 0 8040302010 6050 7010 28 6 4 0 Fre q u e n cy D e n sity Speed (mph) Group 1 is a 40 by 0. 25 rectangle 40 x 0. 25 = 10 So 10 people in the group. Remember that Area represents Frequency! Group 5 is a 5 by 7 rectangle 5 x 7 = 35 So 35 people in the group
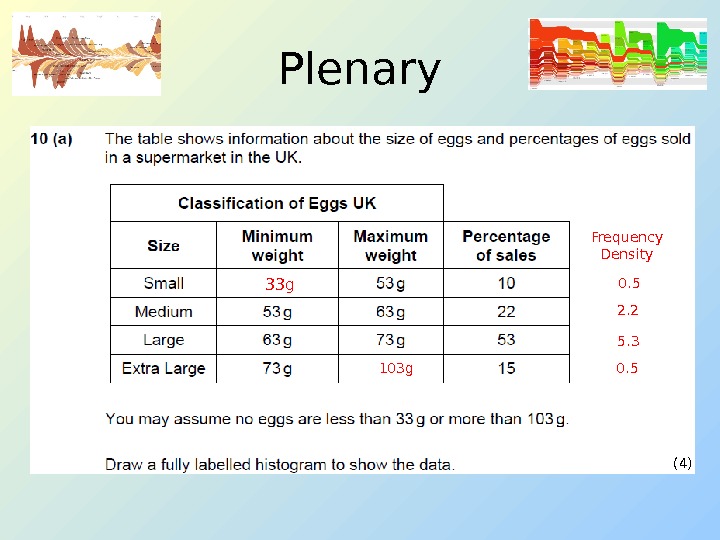
Plenary (4)33 g 103 g Frequency Density 0. 5 2. 2 5. 3 0.
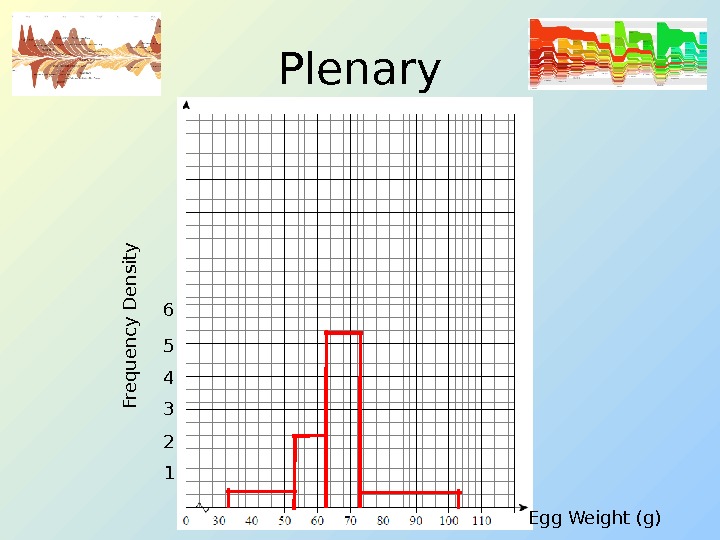
Plenary 1 Fre q u e n cy D e n sity 6 5 4 3 2 Egg Weight (g)
Summary • We have learnt how to plot Histograms of sets of data • We have seen how they are different to Bar Charts • We have learnt what is meant by ‘ Frequency Density ’ • We have shown that on a Histogram , area represents Frequency , not height!