 SQL Server Performance Audit and Tuning Jason Pack
 Overview n n n n Using Performance Monitor Hardware and Operating System Performance SQL Server Configuration Settings Database Configuration Settings Index Performance Tuning Application Tuning SQL Profiler on Queries
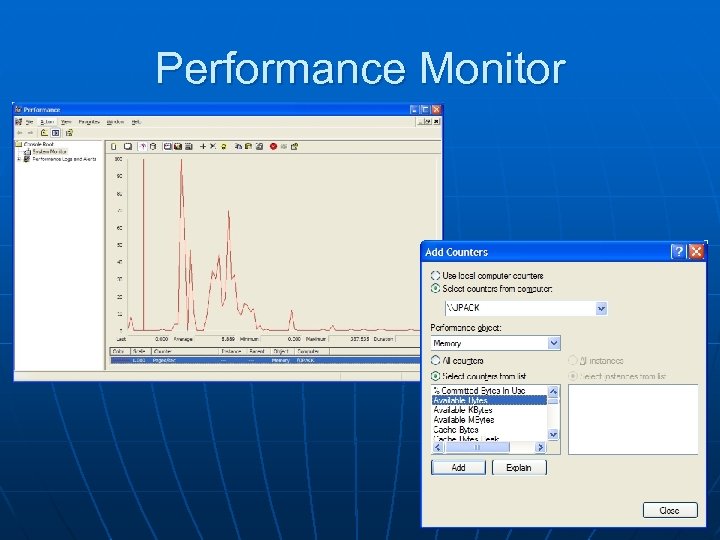 Performance Monitor
 Performance Monitor (2) n Typical counters to monitor: • Pages per second (memory) n Want to average less than 20 • Available bytes (memory) n Should be over 5 MB (on dedicated machine) • Percent disk time (physical disk) n Over 55% for 10+ minutes indicates a bottleneck • Percent processor time n Over 80% for 10+ minutes indicates a bottleneck
 Tuning Hardware and Operating System Performance n n n More RAM = Good Check disk fragmentation Separate operating system files and SQL Server data files Be sure OS has newest SP Server should be configured as stand -alone server Turn off unnecessary services
 SQL Server Configuration Settings n n In general, no need to modify If you have to • SP_CONFIGURE, will show your settings • SP_CONFIGURE ['configuration name'], [configuration setting value] GO RECONFIGURE WITH OVERRIDE GO, to change the settings
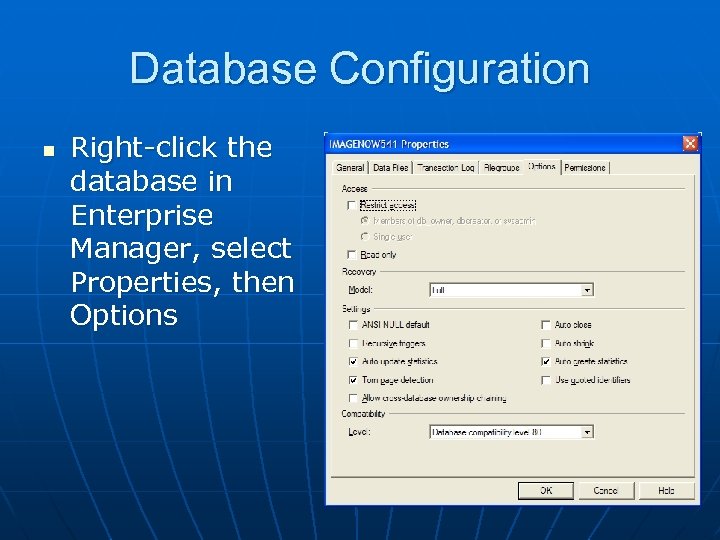 Database Configuration n Right-click the database in Enterprise Manager, select Properties, then Options
 Database Configuration (2) n For reporting databases, set to Readonly n Database auto-grow n Transaction log auto-grow • Estimate well, auto-grow creates virtual files, increasing recovery time
 Index Performance Tuning n Run the Index Tuning Wizard • Only available in Enterprise edition n n Start with busiest database, and largest tables Every table, in every database, should have a clustered index on the PK • Allows the data to be stored, physically, in order
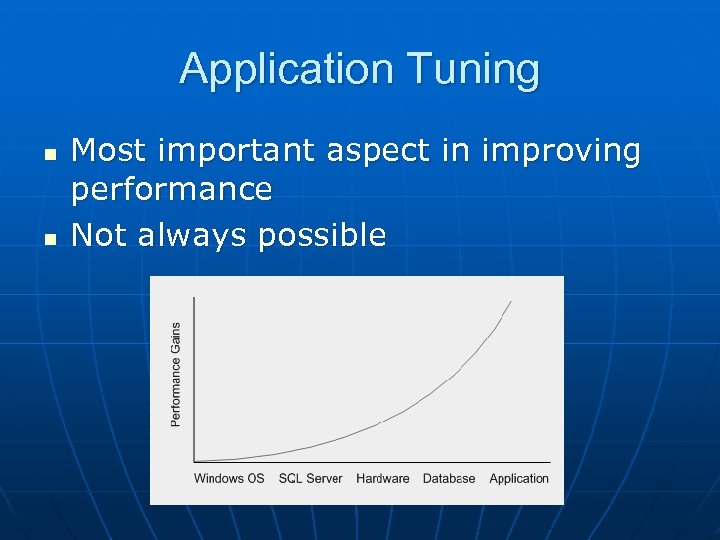 Application Tuning n n Most important aspect in improving performance Not always possible
 Application Tuning (2) n Use stored procedures whenever possible • Include SET NOCOUNT ON in stored procedure n n n Keep transactions as short as possible Choose OLE DB over ODBC, as it is generally faster Don’t return more data than you need
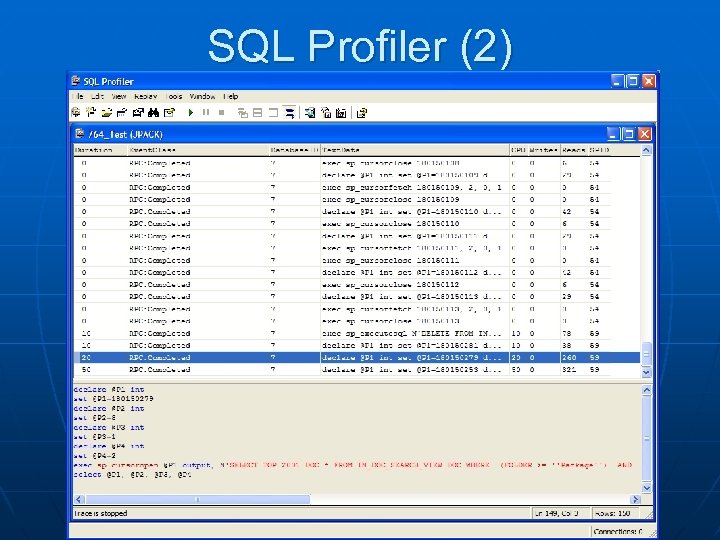
 SQL Profiler n Events • Stored Procedures n RPC: Completed • TSQL n n SQL: Batch. Completed Filters • Duration > 5000 ms • No system events n Data Columns • • Duration (group by) Event Class Database Identifier Text. Data CPU Writes Reads SPID
 SQL Profiler (2)
 References n SQL-Server-Performance. Com, Brad Mc. Gehee, February 2005 • http: //www. sql-server-performance. com/sql_server_performance_audit 10. asp n Microsoft MSDN, Meier, J. D. , Vasireddy, S. , Babbar, A. , et al. , May 2004 • http: //msdn. microsoft. com/library/default. asp? url=/library/enus/dnpag/html/scalenetchapt 14. asp n SQL-Server-Performance. Com, Geert Vanhove, June 2005 • http: //www. sql-server-performance. com/gv_monitoring_8_steps. asp n Microsoft MSDN • http: //msdn. microsoft. com/library/default. asp? url=/library/enus/createdb/cm_8_des_05_2 ri 0. asp