

13acc6260f367a6ac33ba9cae0dfa661.ppt
- Количество слайдов: 57
 Source #4 An Efficient Capital Market To realize its potential, a nation must have a mechanism that channels capital into wealthcreating projects.
 Capital Investment and Its Role in Growth • Capital is anything used to produce something else and helps us produce more goods and services in the future. – Machines, buildings, computers, tools • Capital investment requires consumption sacrifices today. It requires savings. The payoff is increased production and consumption in the future. • A mechanism is needed to channel savings into productive investments. Capital markets perform this function. 2 Common. Sense. Economics. com
 Capital Markets, Broadly Defined, Include • Loanable funds (mortgages, equity lines of credit, commercial loans, personal loans) • Real estate (residential and nonresidential) • Financial markets (mutual funds, bonds, and the stock market)
 But, Not All Investment Projects Are Productive… • Investment involves risk. Unprofitable and unproductive investments will occur in a world of uncertainty. • Failures play an important role. Losses will lead to business failure and bring unproductive investments to a halt. • Market forces hold investors accountable for their mistakes. This provides a strong incentive to search for and undertake productive projects and avoid ones that are unproductive. • Productive investments promote economic growth.
 Notable Dot. Companies • Google • Pets. com – Most famous • Webvan – largest
 Capital Markets and Government Intervention • Governments can and do intervene in capital markets by restricting capital movements, setting interest rates, and using taxes and budgets to allocate capital. • These actions: – Distort market incentives. – Increase the importance of political rather than economic considerations. – Make unproductive investments more likely.
 Former Soviet Union and Eastern Blcok Countries
 •") Fannie Mae and Freddie Mac • Federal National Mortgage Association (Fannie Mae 1968) • Federal Home Loan Mortgage Corporation (Freddie Mac 1970) • Purpose
Fannie Mae and Freddie Mac • Federal National Mortgage Association (Fannie Mae 1968) • Federal Home Loan Mortgage Corporation (Freddie Mac 1970) • Purpose
 Fannie Mae and Freddie Mac • Business – – Did not originate mortgages Strictly secondary market Mid 1990’s— 40% of market Prior to 2008— 80%
 Fannie Mae and Freddie Mac • How did this happen? – HUD • 1996— 40% • 2000— 50% • 2008— 56% • Subprime Mortgages – No Down Payment – No or Poor Credit History – Incomplete Paper Work
 Fannie Mae and Freddie Mac • Incentive to originators of mortgages: – Can pass these risky loans off to FM and FM • Housing Boom—unsustainable • Bust later in 2006 • $400 Billion in bad debt
 Federal Reserve’s Part • “Political allocation of credit and the regulatory erosion of lending standards channeled a lot of financial capital into projects that should never have been undertaken. ” (page 65)
 Property Rights • Clearly defined • Enforced • Government allocation of capital
 Capital Markets Make a Difference
 Source #5 Monetary Stability A stable monetary policy is essential for the control of inflation, efficient allocation of investment, and achievement of economic stability.
 Money “Money is to an economy what language is to communication. ”
 Why Do We Need Money? • Barter systems made money necessary. • To barter effectively, both parties must experience a double coincidence of wants. • Barter is awkward and money helps facilitate trade between people.
 History of Money • Throughout history many things have been used as money – Salt – Cigarettes – Tea
 History of Money “The gold and silver money, which circulates in any country, may very properly be compared to a highway, which, while it circulates and carries to market all the grass and corn of the country, produces itself not a single pile of either. ” -The Wealth of Nations
 History of Money • There were problems with these items as money – Easy to duplicate and counterfeit • Gold became preferred
 Why Gold? • Limited in quantity and difficult to duplicate • Often used as coins or for large purchases gold bars • The problem is it is heavy to carry
 History of Money • It is dangerous to carry gold so people would give it to blacksmiths to keep in a safe – This led to paper money and banks • Blacksmiths to Bankers – early on banks were just safety deposit boxes • Later governments started issuing paper money that could be redeemed for gold
 History of Money • What makes these things money? – They were accepted in exchange for goods and services which represent real wealth • Money does not create wealth, it is just a way to transfer wealth or encourage people to create wealth
 Two Types of Money • Commodity Money : something that performs the function of money and has alternative, nonmonetary uses. – Examples: Gold, silver, cigarettes • Fiat Money : something that serves as money but has no other important uses. – Examples: Coins, currency, check deposits
 The Functions of Money 1. Medium of exchange …it can be used to purchase goods & services. 2. Unit of account …it is a yardstick people use to compare the relative value of goods & record debts. 3. Store of value …it can be used to transfer purchasing power from the present to the future.
 Characteristics of Money • Portable – easy to transfer from person to person • Uniform – are they all of equality • Generally accepted – will people accept it • Durable – will it last • Stable in value – is it limited in quantity
 The Value of Money • The value of money is determined by supply and demand. • The value of money is steady when the supply of money grows slowly (e. g. at approximately the same rate as goods and services).
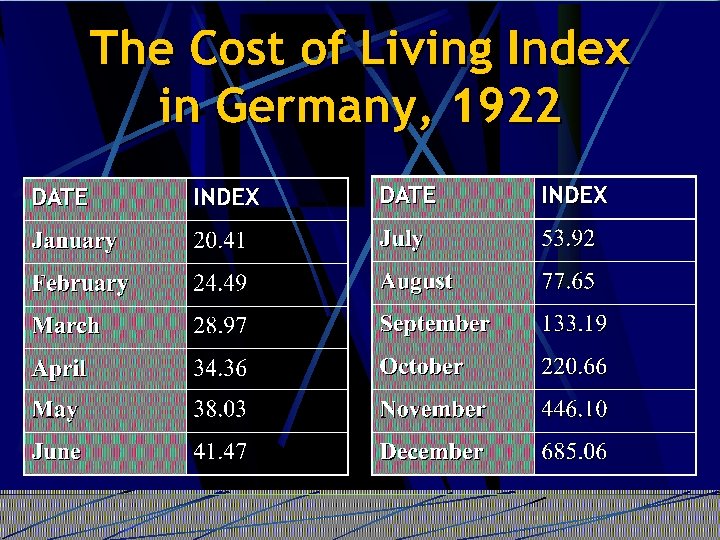
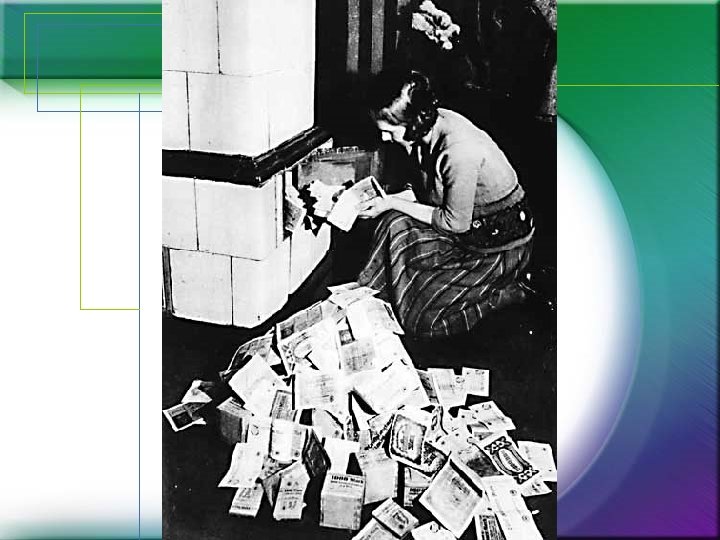
 The Value of Money • When a central bank expands the money supply rapidly relative to the production of goods and services, inflation results because there are too many dollars chasing too few goods and services. • Inflation generates uncertainty, reduces the gains from trade, and thereby retards economic growth.
 What is Inflation? • Inflation is about the value of money, not the value of goods • The inflation rate is reported monthly at an annual rate • Important for measuring the Cost of Living
 Current Inflation Rates January -. 09% February -. 03% March -. 07% April -. 20% May -. 04% June . 12% July . 17% August . 20%
 Real versus Nominal • An accurate view of the economy requires adjusting nominal prices to real prices in order to make comparisons over time • Nominal is the value at current prices • Real is the value at constant prices – adjusted for inflation
 Example: Gas Prices
 – measure of price changes over a") Measuring Inflation • Consumer Price Index (CPI) – measure of price changes over a period of time – attempts to measure the price changes in about 400 goods and services
Measuring Inflation • Consumer Price Index (CPI) – measure of price changes over a period of time – attempts to measure the price changes in about 400 goods and services
 Measuring the Cost of Living • In determining the cost of living, the Bureau of Labor Statistics (BLS) first identifies a “market basket” of goods and services the typical consumer buys • Annually, the BLS surveys consumers to determine what they buy and the overall cost of the goods and services they buy
 Calculating the Consumer Price Index and the Inflation Rate § Fix the Basket - Determine what goods are most important to the typical consumer § Items are weighted based on consumption
 What’s in the CPI’s Basket?
 Calculating the Consumer Price Index and the Inflation Rate § Find the Prices - Find the prices of each of the goods and services in the basket for each point in time
 Calculating the Consumer Price Index and the Inflation Rate § Compute the Basket’s Cost - Use the data on prices to calculate the cost of the basket of goods and services at different times
 Calculating the Consumer Price Index and the Inflation Rate § Choose a Base Year - Designate one year as the base year and compare all other years to it § 1982 -1984 = 100
 Uses of Consumer Price Index • Compute "real" values for items with dollar values • Cost of living (income) • As one measure of economy's price performance
 Other Price Indexes • Other Price Indexes are computed for: – Specific regions within the country (e. g. Boston, New York, Los Angeles) – Narrow categories of goods and services (e. g. food, clothing, etc. ) – Producer costs of resources (i. e. producer price index) – Core CPI – CPI without food and energy
 Correcting Economic Variables for the Effects of Inflation • Price indexes are used to correct for the effects of inflation when comparing dollar figures from different times
 Comparing Prices over Time Rank Title Lifetime Gross Year 1 Avatar $760, 339, 004 2009 2 Titanic $658, 672, 302 1997 3 The Avengers $623, 279, 547 2012 4 The Dark Knight $533, 184, 219 2008 5 Star Wars $460, 935, 665 1977 6 The Dark Knight Rises $445, 369, 641 2012 7 Shrek 2 $436, 471, 036 2004 8 E. T. : The Extra Terrestrial $434, 979, 459 1982 9 Star Wars: Episode I $431, 065, 444 1999 10 Pirates of the Caribbean: Dead Man’s Chest $423, 032, 628 2006
 current") Comparing Prices over Time • To compare today with the past, convert (deflate) current wages and prices into past year terms: Value in Past Year Dollars = Current Year Value X Price index in past year Price index in current year
Comparing Prices over Time • To compare today with the past, convert (deflate) current wages and prices into past year terms: Value in Past Year Dollars = Current Year Value X Price index in past year Price index in current year
 Comparing Prices over Time • For example, how much money would Titanic have made in 1939: Value in Past Year Dollars = Current Year Value X Price index in past year (1939) Price index in current year (1997) $658, 672, 302 x 13. 9/160. 5 = $57, 043, 894
 past") Comparing Prices over Time • To compare the past with today, convert (inflate) past wages and prices into current terms: Current Year Dollars = Past Year Nominal Value X Price index in current year Price index in past year
Comparing Prices over Time • To compare the past with today, convert (inflate) past wages and prices into current terms: Current Year Dollars = Past Year Nominal Value X Price index in current year Price index in past year
 Comparing Prices over Time • For example, how much money would Babe Ruth make today: Current Year Dollars = Past Year Nominal Value X Price index in current year (2013) Price index in past year $80, 000 was highest salary in 1930 $80, 000 x 231. 2/16. 7 = $1, 107, 545
 Comparing Prices over Time Rank Title Adjusted Gross Unadjusted Gross Year 1 Gone with the Wind $3, 065, 577, 762 $198, 676, 459 1939 2 Snow White and the Seven Dwarfs $2, 755, 389, 741 $184, 925, 486 1937 3 Star Wars $1, 631, 932, 944 $460, 998, 007 1977 4 The Exorcist $1, 123, 800, 983 $232, 671, 011 1973 5 The Sound of Music $1, 082, 595, 016 $158, 671, 368 1965 6 Jaws $1, 037, 400, 000 $260, 000 1975 7 E. T. : The Extra Terrestrial $965, 945, 429 $435, 110, 554 1982 8 Titanic $880, 433, 518 $658, 672, 302 1997 9 Doctor Zhivago $760, 826, 207 $111, 721, 910 1965 10 Avatar $760, 339, 004 2009


 Inflation in the US
 Conclusion • When comparing dollar values from different times, it is necessary to keep in mind that a dollar today is not the same as a dollar in the past