8e1c5c015c4a8a0eecb13ffb8911a485.ppt
- Количество слайдов: 20
 Some early results for Si. Cortex machines John F. Mucci Founder and CEO, Si. Cortex, Inc. Lattice 2008
 The Company Computer Systems company building complete, high processor count, richly interconnected, low power Linux computers Strong belief (and now some proof) that a more efficient HPC computer can be built from the silicon up. Around 80 or so really bright people, plus me. Venture funded, based in Maynard, Massachusetts, USA http: //www. sicortex. com, for whitepapers and tech. info
 What We Are Building A family of fully-integrated HPC Linux systems delivering best-of-breed: Total Cost of Ownership Delivered Performance: Per Watt Per Square Foot Per Dollar Per Byte/IO Usability and deployability Reliability
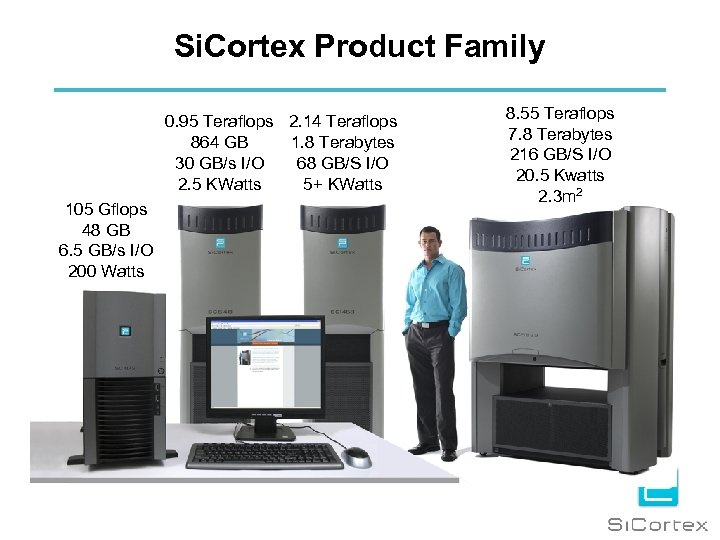 Si. Cortex Product Family 0. 95 Teraflops 2. 14 Teraflops 864 GB 1. 8 Terabytes 30 GB/s I/O 68 GB/S I/O 2. 5 KWatts 5+ KWatts 105 Gflops 48 GB 6. 5 GB/s I/O 200 Watts 8. 55 Teraflops 7. 8 Terabytes 216 GB/S I/O 20. 5 Kwatts 2. 3 m 2
 Make it Green, Don't Paint it Green Through increasing component density and integration ~= Performance ~= Reliability ~= 1/Power Innovate where it counts! Single core performance and architecture Scalability Memory, Network, I/O Reliability Network, on-chip and off-chip ECC, software to recover Software usability Buy, borrow, the rest. . .
 The Si. Cortex Node Chip 6
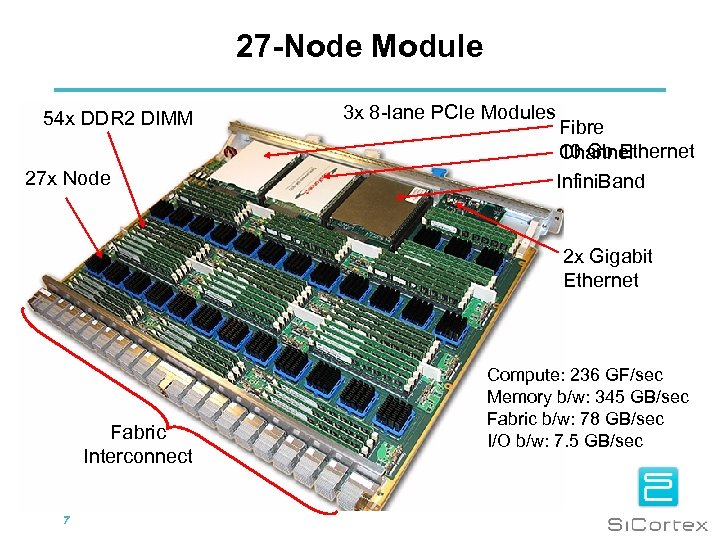 27 -Node Module 54 x DDR 2 DIMM 27 x Node 3 x 8 -lane PCIe Modules Fibre 10 Gb Ethernet Channel Infini. Band 2 x Gigabit Ethernet Fabric Interconnect 7 Compute: 236 GF/sec Memory b/w: 345 GB/sec Fabric b/w: 78 GB/sec I/O b/w: 7. 5 GB/sec
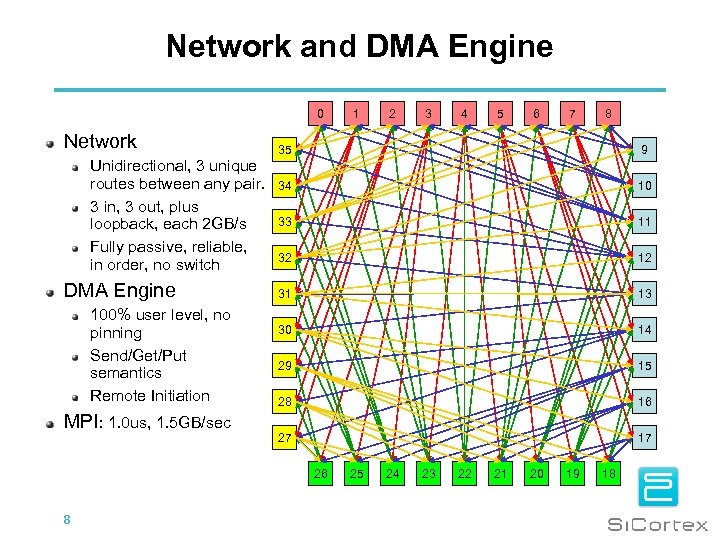 Network and DMA Engine 0 Network Unidirectional, 3 unique routes between any pair. 3 in, 3 out, plus loopback, each 2 GB/s Fully passive, reliable, in order, no switch DMA Engine 100% user level, no pinning Send/Get/Put semantics Remote Initiation MPI: 1. 0 us, 1. 5 GB/sec 2 3 4 5 6 7 8 35 9 34 10 33 11 32 12 31 13 30 14 29 15 28 16 27 17 26 8 1 25 24 23 22 21 20 19 18
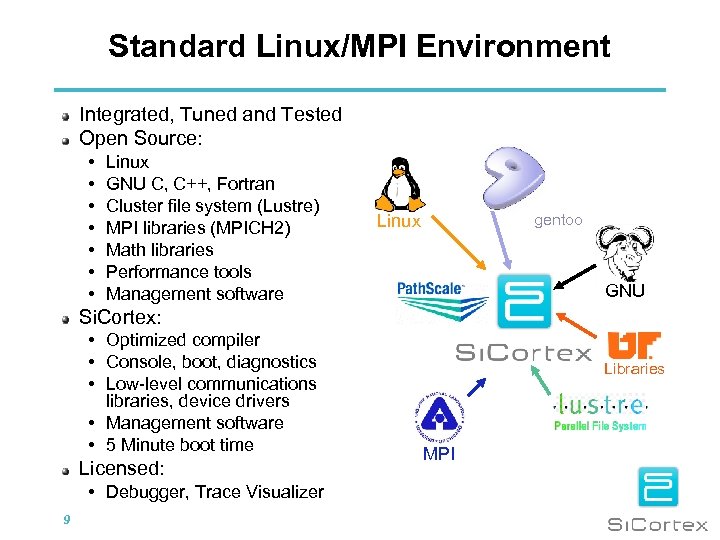 Standard Linux/MPI Environment Integrated, Tuned and Tested Open Source: • • Linux GNU C, C++, Fortran Cluster file system (Lustre) MPI libraries (MPICH 2) Math libraries Performance tools Management software Linux gentoo GNU Si. Cortex: • Optimized compiler • Console, boot, diagnostics • Low-level communications libraries, device drivers • Management software • 5 Minute boot time Licensed: • Debugger, Trace Visualizer 9 Libraries MPI
 QCD: MILC and su 3_rmd A widely used Lattice Gauge Theory QCD simulation for: Molecular dynamics evolution, hadron spectroscopy, matrix elements and charge studies The ks_imp_dyn/su 3_rmd case is a widely studied benchmark. Time tends to be dominated by the Conjugate Gradient http: //physics. indiana. edu/~sg/milc. html http: //faculty. cs. tamu. edu/wuxf/research/tamu-MILC. pdf
 MILC su 3_rmd Scaling (Input-10/12/14)
 Understanding what might be possible Si. Cortex system is new; compared to 10+ years of hacking and optimization So we took a look at a test suite and benchmark provided by Andrew Pochinsky @ MIT Looks at the problem in three phases What performance do you get running from L 1 cache What performance do you get running from L 2 And from main memory Very useful to see where cycles and time are spent. And gives hints about what compilers might do and how to restructure codes. 12
 So what did we see? By select hand coding of Andrews code we have seen: Out of L 1 cache 1097 Mflops Out of L 2 cache 703 Mflops Out of Memory 367 Mflops Compiler is improving each time we dive deeper into the code. But we’re not experts on QCD, could use some help. 13
 What conclusion might we draw Good communications makes for excellent scaling (MILC) Working on single node performance tuning (on Pochinsky code) gives direction on performance and insight for compiler. DWF formulations have higher computation/communications ratio. And we do quite well. Will do even better with formulations that have increased communications.
 Si. Cortex and Really Green HPC Come downstairs (at the foot of the stairs) and take a look and give it a try. It’s a 72 processor (100+ Gflop) desktop system using ~200 watts. Totally compatible with its bigger family members. Up to 5832 processor system. More delivered performance per square foot, per dollar, and per watt 15
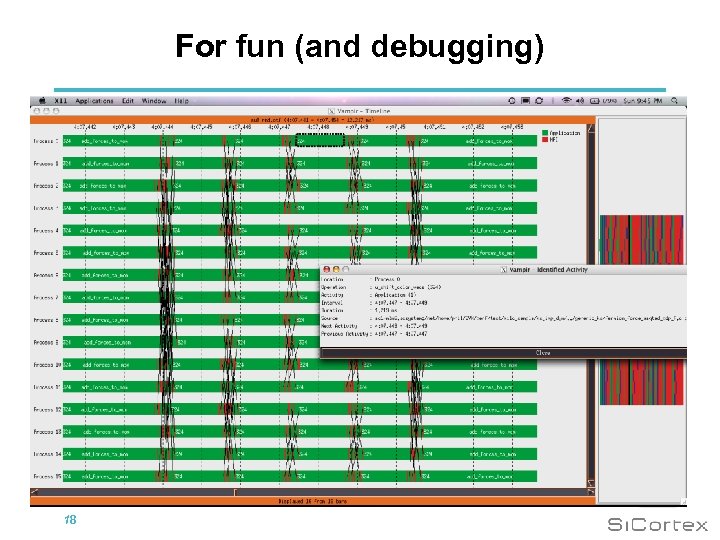
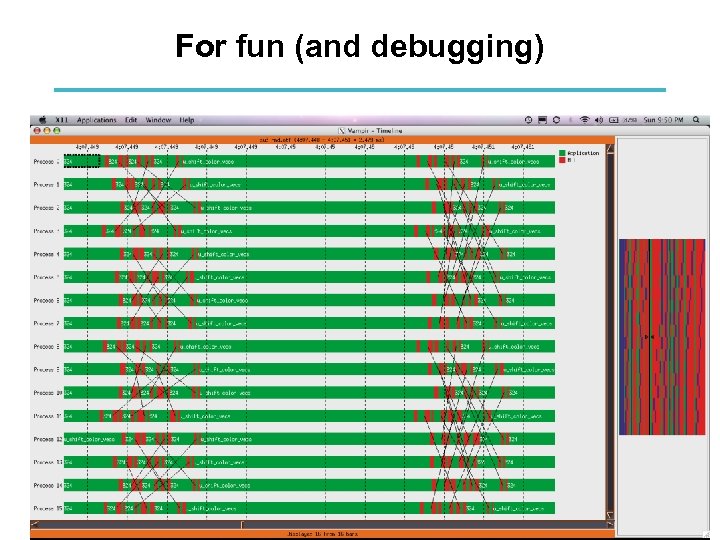
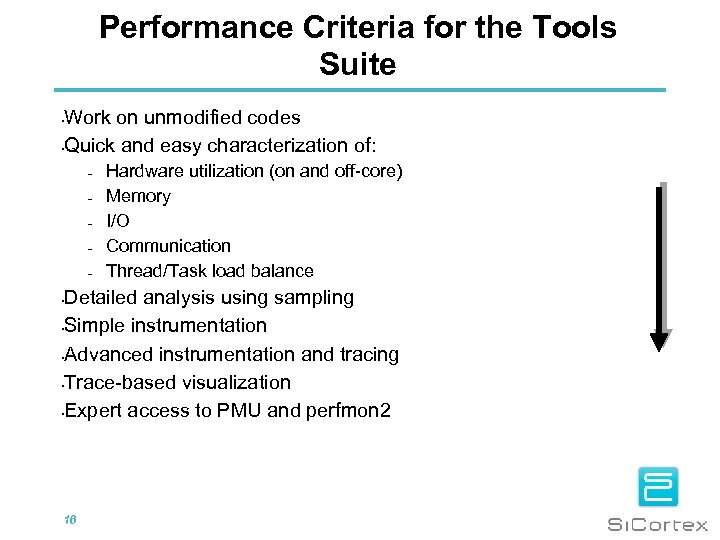 Performance Criteria for the Tools Suite Work on unmodified codes • Quick and easy characterization of: • – – – Hardware utilization (on and off-core) Memory I/O Communication Thread/Task load balance Detailed analysis using sampling • Simple instrumentation • Advanced instrumentation and tracing • Trace-based visualization • Expert access to PMU and perfmon 2 • 16
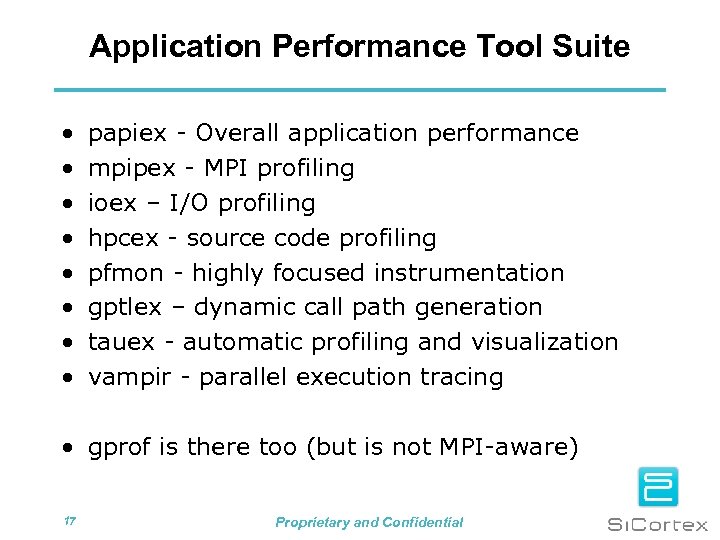 Application Performance Tool Suite • • papiex - Overall application performance mpipex - MPI profiling ioex – I/O profiling hpcex - source code profiling pfmon - highly focused instrumentation gptlex – dynamic call path generation tauex - automatic profiling and visualization vampir - parallel execution tracing • gprof is there too (but is not MPI-aware) 17 Proprietary and Confidential
 For fun (and debugging) 18
 For fun (and debugging) 19
 Thanks 20


