

eea7187cf39c53e26b2698fda3e01c2c.ppt
- Количество слайдов: 76
 Soils Anthony P. Tuggle Extension Agent Rutherford County
 Introduction n What is Soil? n the basic material of the gardener’s art n not “dirt” (dirt is soil out of place)
 The Formation of Soil n Soil is formed over many years by the physical or chemical weathering of rock. n Parent material refers to those rocks or deposits from which a soil develops.
 Soil Profile n Most soils are arranged in 3 distinct layers or horizons. n The principle horizons are collectively called the soil profile. A = Topsoil B = Subsoil C = Parent Matter
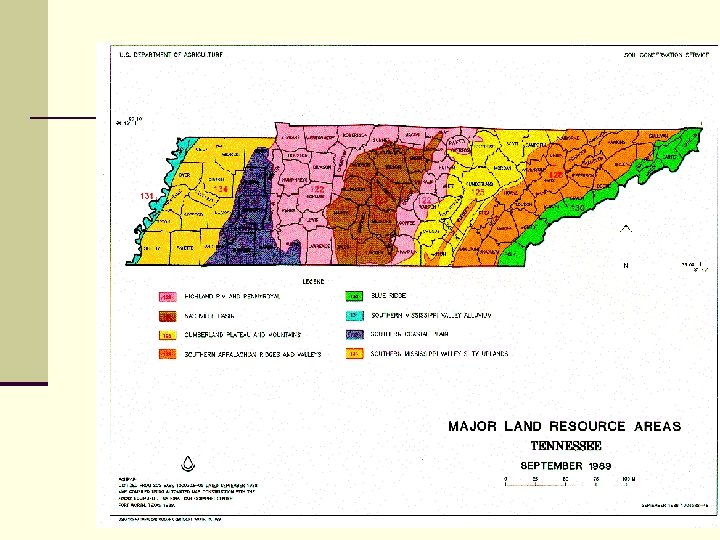
 The Formation of Soil n The USDA Natural Resources Conservation Service lists 8 Major Land Resource Areas in Tennessee n n n n Southern Mississippi Valley Alluvium (MS River Bottoms) S. MS Valley Silty Uplands(The Deep Loess Region) Southern Coastal Plains The Highland Rim and Pennyroyal The Nashville Basin (Central Basin) The Cumberland Plateau and Mountains The Southern Appalachian Ridges and Valleys Blue Ridge (The West Slope of the Appalachian Mountains)
 n Water & Air - 50% n Soil") Soil Composition (Of a Good Soil) n Water & Air - 50% n Soil Mineral Matter - 48. 5% n Living Organisms -. 5% n Organic Matter - 1%
Soil Composition (Of a Good Soil) n Water & Air - 50% n Soil Mineral Matter - 48. 5% n Living Organisms -. 5% n Organic Matter - 1%
 Water & Air Saturation Field Capacity Permanent Wilting Point
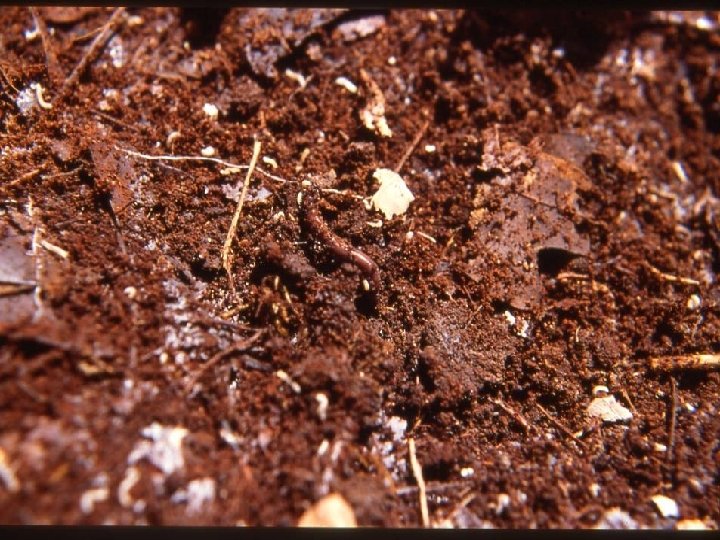
 Living Organisms . 5%
") Organic Matter Enhances development of structure. Stabilizes soil structure. Source of nutrients (nitrogen, sulfur) Large nutrient and water holding capacity 1% Eat More Chicken
Organic Matter Enhances development of structure. Stabilizes soil structure. Source of nutrients (nitrogen, sulfur) Large nutrient and water holding capacity 1% Eat More Chicken
 Soil Physical Properties n Soil Texture n Soil Structure n Landscape Position n Slope n Rooting Depth n Color n Drainage n Presence of Rock Fragments
 Soil Color • Organic Matter • Age • Drainage
 Soil Texture n The Size of Soil Particles Medium Silt Fine Sand Coarse Clay
 100 90 Percent Clay Soil 80 10 Percent 20 Silt 70 30 40 60 Textural 50 50 Triangle 60 40 30 70 80 90 20 10 100 90 80 70 60 50 40 30 Percent Sand 20 10
 Granular Columnar Prismatic Blocky Platy Types of Soil Structure
 Soil Chemical Properties
 Cation Exchange Example: Rainfall results in constant introduction of H ions, forcing calcium and other bases into the soil solution where they are leached away.
 Reversing Cation Exchange • Limestone is added • Calcium ions replace H and other cations • Result – clay becomes higher in exchangable Calcium and lower in H and Al
 Soil Management n To identify your soil type: n Take handful of soil from your garden and rub a little between your finger and thumb. n Clay feels sticky and will roll into a ball that simply changes shape when pressed. n Sand is coarse and gritty. n Silt feels silky. n Limestone has a dry crumbly feel and a grayish-white color. n Peat is black and moist.
 Soil Types n Five main soil types: n Clay n Sand n Silt n Limestone n Peat
 Soil Types: Clay n Clay soils are typically heavy, cold soils which feel sticky when moist and are hard and compacted when dry.
 Soil Types: Sand n Sandy soils are dry and light. n Will feel gritty between the fingers
 Soil Types: Limestone n Calcareous soils are pale “hungry-looking” soils that often contain a high proportion of stones and flints
 Soil Types: Silt n Silty-type soil is neither gritty or sticky. The soil particles are small, making it feel smooth and silky to the touch.
 Soil Types: Peat n Peat is a distinctive dark brown or gray color and has a spongy texture. n It is rich in decomposed matter.
![Essential Plant Nutrients n Three elements n Carbon [C] n Hydrogen (H), and n](https://present5.com/presentation/eea7187cf39c53e26b2698fda3e01c2c/image-28.jpg "Essential Plant Nutrients n Three elements n Carbon [C] n Hydrogen (H), and n") Essential Plant Nutrients n Three elements n Carbon [C] n Hydrogen (H), and n Oxygen (O) n are supplied by air (in the form of carbon dioxide) and water.
Essential Plant Nutrients n Three elements n Carbon [C] n Hydrogen (H), and n Oxygen (O) n are supplied by air (in the form of carbon dioxide) and water.
 Essential Plant Nutrients Non-Mineral: Carbon - C Hydrogen - H Oxygen - O Primary or Macronutrients: Nitrogen - N Phosphorus - P Potassium - K Micronutrients: Zinc - Zn Chlorine - Cl Boron - B Molybdenum - Mo Secondary: Copper - Cu Calcium - Ca Iron - Fe Magnesium - Mg Manganese - Mn Sulfur - S
 Function of Essential Elements n NITROGEN - Vegetative growth n PHOSPHORUS - New root growth, blooms & seeds n POTASSIUM - Vigor & disease resistance, stalk strength, seed quality n CALCIUM - Root formation, straw stiffness n MAGNESIUM - Helps uptake of other elements n SULFUR - Amino acids, vitamins, dark green color
 Soil Mineral Matter 48. 5%
 Four Phases of Soil Management n Analyzing Your Soil n Using Soil Conditioners n Adding General Fertilizer n Using Specific Fertilizers
 Analyzing Your Soil n Don’t Guess, Soil Test! n A basic soil test can be conducted through your county Extension office. n Charge: $6/sample (for basic soil test) n Takes about 2 weeks to receive the results. n A basic soil test will indicate the p. H value, Phosphorus (P) and Potassium (K) content.
 Analyzing Your Soil The Soil Test n Tools Needed: n A soil probe, shovel or spade n Bucket n Soil test form n Soil sample box
 Analyzing Your Soil The Soil Test n When to sample: n Soils can be analyzed at any time of the year, however fall is the most desirable time. n Fields are drier and more accessible and the lab is not as busy. *Soil samples must be dry when submitted to the lab. n Testing in fall allows recommended rates of lime, phosphate and potash to be applied well in advance of spring planting.
 Analyzing Your Soil The Soil Test n How Often: n Before planting a new garden or landscape area then: Lawns/Gardens/Ornamental beds— every 3 – 5 years or if you suspect a problem. n High value crops—test annually n Continuous row crops/double cropping systems—every 2 -3 years. n
 Analyzing Your Soil The Soil Test n Soil test results can be no better than the sample collected. n For large areas, soil portions should be taken from an area not to exceed 10 acres. n For lawns and gardens, soil portions should be collected at random from 8 -10 locations. n Areas of contrasting soils, problem spots or portions of the field where crop response is significantly different should be sampled separately.
 Analyzing Your Soil The Soil Test n Small portions of soil should be gathered from several locations. n Dig at least 6” deep. n Place soil in bucket, then go on to the next area and do the same thing again. n Mix portions together in the bucket, remove all grass, rocks and other debris. Then keep approximately one cup of soil to be submitted to the soil lab for analysis.
 How To Take a Good Soil Sample? n Properly Select the Sampling Area. n The area should not exceed 10 acres. n Areas of contrasting soils, problem spots, etc. should be sampled separately if possible. X
 Collect Adequate Sub-samples
 Collect Good Sub-samples Uniform cores are important!
 Soil p. H and Its Effects of Nutrient Availability n Soil p. H refers to the amount of hydrogen (H) ions or acidity found in soils. n As acid levels (H ion concentration) increase, the p. H of the soil decreases. n The p. H scale ranges from 0 – 14 with most soils in Tennessee ranging in value from 4. 5 to 7. 5.
 Soil p. H and Its Effects of Nutrient Availability n Soils with p. H values greater than 7. 0 are alkaline or sweet. n Soils with p. H values less than 7. 0 are acid or sour. n Nutrient availability is directly affected by p. H. 0 1 2 3 4 5 6 7 8 9 10 11 12 13 14 ____________________ ACID/SOUR ALKALINE/SWEET
 Soil p. H and Its Effects on Nutrient Availability
 Soil p. H and Its Effects of Nutrient Availability n What does lime do? n Lime reduces the amounts of soluble aluminum and manganese to nontoxic levels. n As p. H increases, the availability of manganese and aluminum decreases. This prevents plants from being exposed to toxic amounts of these elements. n Manganese and aluminum toxicities become major problems in many plants when the soil p. H drops near 5. ).
 Soil p. H and Its Effects of Nutrient Availability n Adjusting the Soil p. H n Various lime sources are used to adjust soil p. H upwards (to more alkaline/sweet range) when it falls below the recommended ranges. n Sources such as elemental sulfur, iron sulfate, and aluminum sulfate are used to adjust soil p. H downwards (to more acid/sour range) when it is above the recommended ranges.
 ADJUSTING THE SOIL PH LEVEL n Apply lime to reduce soil acidity. Use no more than 50 lbs. per 1, 000 sq. ft. Expect long adjustment period. n Apply sulfur to increase soil acidity. Use 2 lbs. per 1, 000 sq. ft. for each. 1 unit change in the p. H level. Expect extremely short adjustment period.
 Soil p. H and Its Effects of Nutrient Availability n While the water p. H indicates the need for lime, the buffer p. H determines how much lime to apply. n Buffer p. H is a measure of the amount of acid held by the soil particles and accounts for the total acid that must be neutralized when lime is added.
 Analyzing Your Soil The Soil Test n Filling out the information sheet: n For each sample listed in the left column, you may request up to 3 recommendations. n Use the table on the back of the information sheet to determine the appropriate crop codes to use. n Soil sample boxes should be marked clearly with the sample numbers corresponding to those shown on the information sheet.
 Fertilizer Analysis n A fertilizer bag should list: n n n Percentages of: n N n P 2 O 5 n K 2 O Sources of Nutrients n Urea or Ammonium Nitrate n Triple Super Phosphate n Muriate of Potash Amount (wt. ) of Fertilizer
 Application Methods n Broadcasting n Banding n Fertilization of Planted Area only n Side dressings n Foliar Feeding
 HOW SHOULD FERTILIZER BE SPREAD ? n Gravity Flow n Centrifugal n Hand
 HOW SHOULD FERTILIZER BE SPREAD ? n Spread the material as uniformly as possible. n Calibrate your equip- ment to apply the recommended amount.
 Adding General Fertilizers n Supplies of manure and compost are not always available and the application of organic matter adds more to the soil structure rather than supplying sufficient amounts of nutrients. So, supplements may be needed. n Pay attention to the type of crop you are growing as well as the soil test results.
 Adding General Fertilizers n Organic vs. Inorganic n Organic fertilizers: the nutrients contained in the product are derived solely from the remains of a once-living organism. n n Examples: cotton-seed meal, blood meal, bone meal Inorganic or synthetic fertilizers: nutrients contained in the product are derived from inorganic materials. n Examples: urea, osmocote etc.
 Adding General Fertilizers n Fertilizer Materials: n The fertilizer analysis on the bag refers to how much of an element there is in a material, based on the % in weight. n All fertilizers are labeled with 3 numbers that give the % by weight of Nitrogen (N), Phosphorus (expressed as P 2 O 5) and Potassium (K 20). n Simply put, the numbers represent N, P, K
 Adding General Fertilizers n Special Purpose Fertilizers: n Some fertilizers are packaged for certain uses such as “tomato food” or “azalea food” n They may be formulated to release a higher amount of nutrient needed by a specific plant. n They may be formulated to empty your pocket book! n Slow Release Fertilizers: n Contain one or more essential nutrients which are released over a an extended time. n Advantages include: fewer applications, low burn potential and slow release rates.
 Fertilizer Materials n Complete Versus Incomplete Fertilizer n Special Purpose Fertilizers n Slow Release Fertilizers n Organic Fertilizer
 Adding General Fertilizers n Complete Fertilizers: n A fertilizer which contains N, P & K (the primary nutrients) n Common examples are: 6 -12 -12, 10 -10 -10, 12 -12 -12, 15 -15 -15 etc. n Incomplete Fertilizers: n Will be missing one or more of the primary nutrients. n Examples: 34 -0 -0 (Ammonium Nitrate), 46 -0 -0 (Urea), 18 -46 -0 (diammonium phosphate), 0 -060 (muriate of potash) etc.
 Using Specific Fertilizers n Some crops will always need special treatment even when the manure and fertilizer levels are sufficient to start with. n n n Green-house tomatoes will benefit from extra feeding and a potash fertilizer to encourage fruit and flower formation. Leafy plants that remain in the ground for a long time such as cabbage may benefit from extra Nitrogen toward the end of the growing season. Raspberries, blueberries and other acid loving plants are prone to iron deficiencies when grown in alkaline soil requiring fertilizer treatment.
 PCU") Release Times for N Sources Type Ammonium sulfate Urea SCU (sulfur coated urea) PCU and PCSCU Andersons (Scotts) Poly-S Pursell Poly-On Lesco Poly Plus n MU (Methylene Urea) Contec, Nutralene n UF (Ureaformaldahyde) Nitroform, Bluechip n IBDU 3 days n n Begin Release Residual minutes 1 day 2 days 7+ days 20 days years 2 months+ 4 days 4 months 7 days 12 months+ 4 months
Release Times for N Sources Type Ammonium sulfate Urea SCU (sulfur coated urea) PCU and PCSCU Andersons (Scotts) Poly-S Pursell Poly-On Lesco Poly Plus n MU (Methylene Urea) Contec, Nutralene n UF (Ureaformaldahyde) Nitroform, Bluechip n IBDU 3 days n n Begin Release Residual minutes 1 day 2 days 7+ days 20 days years 2 months+ 4 days 4 months 7 days 12 months+ 4 months
 Using Soil Conditioners n The best materials to add to your soil are compost and manure. n The addition of this organic matter will: Improve overall soil texture/structure n Improve drainage n Improve water holding capacity n Provide some nutrients (actually makes nutrients more readily available to plants) n
 Using Soil Conditioners n Well-rotted animal manure is the very best material to use, but it can be difficult to obtain. n Compost is the ideal way to return as much organic matter as possible back to the soil, following natures example. n All amendments should be well-rotted and dug into the top layer of soil. If the organic matter is “hot” (like fresh mulch, sawdust, or fresh manure) this material will burn your plants.
 Using Soil Conditioners n Horse Manure n Pig Manure n Sheep Manure n Chicken Manure n Alternatives include: n Spent mushroom compost, seaweed, spent hops, wool shoddy, composted pine bark, cotton-seed hull, peat…
 Using Soil Conditioners n Green Manure Crops n Are grown specifically to add organic matter to beds that are empty for a period of time. n It is sown with the intention of digging it into the soil to provide organic matter and plant food. n Turn the crops under about 6 weeks before planting to allow the organic material to breakdown.
 Using Soil Conditioners n Green Manure Crops that act as Nitrogen fixers: n Alfalfa, broad or fava bean, red clover, lupin, winter vetch n Green Manure Crops that do not fix Nitrogen: n Buckwheat, rye, mustard, Italian ryegrass
 Typical Composition of Organic Fertilizing Materials The nitrogen in organic fertilizing materials becomes slowly available to plants. There is considerable variation between samples. The guarantee on the bag should be read carefully. This data is taken from official reports of state control departments. Percentage on a Dry-Weight Basis Organic Materials Total Available Phosphoric Water-Soluble Nitrogen, N Acid, P 2 O 5 Potash, K 2 O Bat guano 10. 0 4. 0 2. 0 Blood 13. 0 2. 0 1. 0 Blood and bone 6. 5 7. 0. . . Bone black 1. 3 15. 0. . . Bone meal, raw 3. 0 15. 0. . . Steamed 2. 0 15. 0. . . Castor bean meal 5. 5 2. 0 1. 0 Cotton seed meal 6. 0 3. 0 1. 0 Fish meal 10. 0 4. 0. . . Fish solution 10. 0 3. 0 1. 0 5. 0 2. 0 Garbage tankage 1. 5 2. 0 0. 7 Horn and hoof meal 12. 0. . . Sewerage sludge 1. 5 1. 3 0. 4 Activated 6. 0 3. 0 0. 1 Tankage 9. 0 6. 0. . .
 Typical Composition of Manures: Manures vary greatly in their content of fertilizing nutrients. The kind of feed used, the percentage and type of litter or bedding, the moisture content, and the age and degree of rotting or drying can all modify the composition. In the case of the commercially dried pulverized manures, some nitrogen is lost in the process. The following data is representative of typical analyses from widely scattered reports. Approximate Composition, Per Cent Pounds per Ton Moisture Nitrogen Phosphoric Acid Potash Fresh Manure with Normal Quality of Bedding or Litter Cow 86 11 3 10 Duck 61 22 29 10 Goose 67 22 11 10 Hen 73 22 18 10 Hog 87 11 6 9 Horse 80 13 5 10 Sheep 68 20 15 8 Steer or feed yard 75 12 7 11 Turkey 74 26 14 10 Dried Commercial Products Cow, East 10 42 63 61 West 16 18 15 31 Hen, East (with litter) 16 56 57 30 West (droppings) 8 83 63 31 (with litter) 13 41 37 23 Hog, West 10 45 42 20 Rabbit, West 6 45 27 16 Sheep, East 10 38 30 40 West 9 27 19 41 Stockyard, East 8 41 32 36 West 15 41 11 38
 Commonly Available Fertilizer Materials
 For County Rutherford Date: 12/05/2002 Customer ID: 57909 Lab Number: 218686 SOIL TEST RESULTS and RATINGS* Sample Number Water p. H Buffer Value 01 5. 9 7. 5 (Pounds per Acre) P K Ca Mg Zn Cu Fe Mn Phosphorus Potassium Calcium Magnesium Zinc Copper Iron Manganese 120+ V 320+ V Organic Matter % Soluble Salts PPM** RECOMMENDATIONS Fertilizer/Lime Application Rate and Timing Summer Bulbs Fertilizer: Limestone: Note (5): Apply 1 level tablespoon full of ammonium nitrate(34 -0 -0) in March, June, and August to each 10 square feet of bed area. 1 pounds per 10 square feet If lime is recommended, use dolomitic limestone. *Ratings: Indicates relative availability of nutrients to plants. (Click Here for detailed explanation. ) (L) = Low; (M) = Medium; (H) = High; (V) or (VH) = Very High; (D) = Deficient; (S) = Sufficient **PPM = Parts per Million If you have questions about these recommendations, contact your County Extension office.
 For County Rutherford Date: 12/05/2002 Customer ID: 57909 Lab Number: 2 SOIL TEST RESULTS and RATINGS* Water p. H Buffer Value 02 7. 1 Organic Matter % P K Ca Mg Zn Cu Fe Phosphorus Potassium Calcium Magnesium Zinc Copper Iron Manganese 120+ V Limestone: Note (13): Soluble Salts PPM** Mn 149 M RECOMMENDATIONS - Fertilizer/Lime Application Rate and Timing Fertilizer: (Pounds per Acre) Sample Number Shrub, Acid Loving Per 100 square feet of bed, broadcast evenly over mulch 1/4 lb (1/2 cup) of 40 -0 -0 sulfur coated urea, nitroform, ureaformaldehyde, or other slow release nitrogen fertilizer in early April. Then in mid-May and again in late June, broadcast 1/2 lb (1 cup) of 16 -0 -16 or equivalent amount of low phosphorus fertilizer. Test again next autumn Lime is not recommended at this time If soil p. H is above 5. 5, apply two-tenth (0. 2) pound of elemental sulfur per 100 square feet (for mediumtextured, silt-loam soils) for each one-tenth (1/10) unit the p. H is above 5. 5. Use 1/3 more sulfur for finetextured (clay) soils or 1/3 less sulfur for course-textured (sandy) soils than the amount required for medium textured soils. When more than three (3. 0) pounds of sulfur per 100 square feet is required, it would be advisable to split the application. Apply two-thirds of the recommended amount and after 2 or 3 months re-test the soil. If the p. H has not been sufficiently reduced apply the remainder of the material. *Ratings: Indicates relative availability of nutrients to plants. (Click Here for detailed explanation. ) (L) = Low; (M) = Medium; (H) = High; (V) or (VH) = Very High; (D) = Deficient; (S) = Sufficient **PPM = Parts per Million If you have questions about these recommendations, contact your County Extension office
 Summary—What have we learned? n To produce healthy crops, we must feed the soil and continually improve its texture by the addition of organic matter. n To manage your soil successfully, learn the soil type and its characteristics. n Know the essential plant nutrients PRIMARY (N, P, K) n SECONDARY (CA, MG, S) n
 Summary—What have we learned? n Soil Management Phases Soil test n Addition of soil conditioners n General fertilizer use n Specialized fertilizer use n
 Plant-Nutrient Deficiency Symptoms n Chlorosis n Necrosis n Rosetting n Pigment accumulation n Stunting
 Visual Diagnosis of Plant Nutrient Deficiencies Iron Posassium Zinc Boron
 The End Questions? ? ? ? ? ? Special Thanks to: n Dewayne Trail-Rutherford County Director n Dewayne Perry – Williamson County Director n Karla Kean – Clarksville City Forester