

be08d2ca8bd398ac9a4eec232db12898.ppt
- Количество слайдов: 88
 Soil Water At the end of class, student are expected to have ability to: 1. Discuss and describe soil-water-plant relationship. 2. Analyze hydraulic properties of soils and flow of water into and through soil. 3. Assess the equipment for soil water technique
 Outline • Water and Plant Growth • Flow of water in soil • Permeability • Hydraulic conductivity • Capillarity • Soil Moisture Capacity • Field capacity • Permanent Wilting Point • Available Water • Soil Water Measurement
 Roles of Water in Plant Growth • Tissue composition 50– 90% water • Photosynthesis • Transpiration • Nutrient availability • Nutrient transport within plants • Chemical reactions – as solvent • Ease of root growth • Microbe growth • Water shortage causes plant growth inhibition and wilting. • Excess water causes oxygen and nutrient deficiencies, susceptibility to fungi, toxin build-up, and root damage.
 Flow of Water in Soil • Soil’s characteristics & engineering behaviour are greatly influenced by its water content • Cohesive soils tend to shrink when dry & swell when wet • Fine-grained soils are significantly weakened at high water contents • Such factors must be taken into considerations during geotechnical designs. • Effects of water movement within soil are also very important.
 Permeability • The facility with which water flows through soil is an engineering property known as permeability or hydraulic conductivity. • As water movement within soil is through interconnected voids. • In general, the larger the void spaces, the greater the permeability.
 Permeability water Loose soil - easy to flow - high permeability Dense soil - difficult to flow - low permeability
 Permeability and drainage characteristics of soils
 Permeability • Flow of water in soil between 2 points occurs as a result of a pressure (or hydraulic head) difference between 2 points. • Flows from higher to lower pressure • Velocity of flows varies directly with: • magnitude of the difference between the hydraulic heads • Permeability of soil
 Permeability • Flow of water in soil can be analyzed quantitatively by Darcy’s Law:
 Illustration of Darcy’s Experiment
 Permeability • If a constant of proportionality, k, is supplied, the preceding proportionality becomes: • k is known as coefficient of permeability • Hydraulic gradient, i = h/L • Eqn 5. 1 can be written as
 Permeability • If the velocity of flow, v, is required as q = Av • The velocity is an average velocity because it represents flow rate divided by gross cross-sectional area of the soil (includes both solid & voids) • As water only travels through voids the actual velocity is
 Permeability
 Example 5 -1 • Water flows through the sand filter as shown in Figure 5 -1 • The cross-sectional area & length of the soil mass are 0. 250 m 2 & 2. 00 m, respectively. • The hydraulic head difference is 0. 160 m • The coefficient of permeability is 6. 90 x 10 -4 m/s • Question: Determine the flow rate of water through the soil
 Example 5 -1 Solution • From Eq. 5. 2
 Example 5 -2 • In a soil test, it took 16. 0 min for 1508 cm 3 of water to flow through a sand sample • The cross-sectional area was 50. 3 cm 3 • The void ratio of the soil sample was 0. 68. • Determine • The velocity of water through the soil • Actual velocity
 Example 5 -2 Solution
 Empirical relationships for k • For uniform sands in a loose state: • For dense or compacted sands
 Coefficient of Permeability, k • If silts or clays are present in sandy soils, even in small amounts, k may change significantly. • k varies greatly among the types of soils encountered in practice, below table gives a broad classification of soils according to k.
 High Over 10") Empirical relationships for k Degree of permeability Value of k (m/s) High Over 10 -3 Medium 10 -3 to 10 -5 Low 10 -5 to 10 -7 Very low 10 -7 to 10 -9 Practically impermeable Less than 10 -9
Empirical relationships for k Degree of permeability Value of k (m/s) High Over 10 -3 Medium 10 -3 to 10 -5 Low 10 -5 to 10 -7 Very low 10 -7 to 10 -9 Practically impermeable Less than 10 -9
 Permeability in stratified soils • In the preceding discussion, soil was assumed to be homogeneous • In reality, natural soil deposits are often non-homogeneous, value of k varies • The general procedure is to find & use an average value of k • Value of k is different vertically & horizontally
 Permeability in stratified soils • Consider the case where flow is in the y-direction • The water must travel successively through layers 1, 2, 3, … , n • Flow rate & velocity through each layer must be equal
 Permeability in stratified soils
 Permeability in stratified soils • Similarly the flow in the horizontal direction, kx can be determined • In stratified soils, average kx is greater than average ky
 Example 5 -3 • A non-homogeneous soil consisting of layers of soil with different permeabilities as shown in figure below • Estimate kx & ky
 Example 5 -3 Solution
") Example 5 -3 Solution (cont’d)
Example 5 -3 Solution (cont’d)
 Laboratory determination of permeability • For coarse grained soil can be determined by a constant head permeability test, and • In a fine grained soil, falling head permeability test works the best.
 Constant-head method • Suitable for granular soil • Utilises a constant-head permeameter as shown • To allow water to move through the soil specimen under a stable-head condition
 Constant-head method • The coefficient of permeability, k, can be determined by measuring & recording the following • Volume (quantity) of water discharged, Q • Length of specimen, L • Cross-sectional area of specimen, A • Time required for Q to be discharged, t • Head, h
 Constant-head method
 Falling-head method • Suitable for fine-grained & coarsegrained soils & granular soils • Utilises a permeameter as shown in diagram • Testing procedure is similar to constanthead • The specimen is first saturated with water • Water is then allowed to move through the soil specimen under falling-head condition
 Falling-head method • The coefficient of permeability can be derived by measuring & recording • Time required for a certain quantity of water to pass through the specimen, t • Cross-sectional area of burette, A • Hydraulic heads at the beginning & end of test, h 1 & h 2 • As shown in figure, the velocity of fall in the burette is given by • V = dh/dt (-ve sign to indicate a falling head) • Flow of water into the specimen • Flow of water through & out the specimen
 Falling-head method
 Capillarity • Refers to the rise of water in a small-diameter tube inserted into water, the rise being caused by both surface tension & adhesion of the water to the tube’s wall • Amount of rise of water above the surrounding water level is inversely proportional to the tube’s diameter
 Capillarity • With soils, this occurs at the water table • Height of capillary rise is associated with mean diameter of soil’s voids, in turn, related to average grain size • The figure illustrates the capillary rise of water in a tube • In equilibrium • Weight of H 2 O = adhesion
 when water") Capillarity • With soils, capillarity occurs at the ground water table (GWT) when water rises from saturated soil below into dry or partially saturated soil above the GWT • Because the voids interconnect in varying directions & irregular in size & shape, accurate calculation of the height of capillary rise is impossible
Capillarity • With soils, capillarity occurs at the ground water table (GWT) when water rises from saturated soil below into dry or partially saturated soil above the GWT • Because the voids interconnect in varying directions & irregular in size & shape, accurate calculation of the height of capillary rise is impossible
 Capillarity
 Capillarity • Eq 5 -39 is applicable only to the rise of pure water in clean glass
 Example 5 -4 • A clean glass capillary tube with a diameter of 0. 5 mm is inserted into water with a surface tension of 0. 073 N/m • Determine the height of capillary rise in the tube.
 What is Water Table? • the level beneath the soil which the soil is saturated with water • marshes develop where the water table is just below the ground surface • if the water table is not too low, dryness tends to correct itself through capillary movement
 Soil Water Holding Capacity 1. Analyze the soil water holding capacity 2. Determine methods of soil water measurements and their advantages and limitations,
 Soil Moisture Capacity • Water in the soil is held by the forces of cohesion and adhesion in which surface tension, capillarity, and osmotic pressure play a significant role. • There are two types of forces acting on soil moisture. • Positive forces are those that enhance soil’s affinity for water (e. g. , forces of cohesion and adhesion). • In contrast, some negative forces that take water away from soil include gravity, actively growing plant roots, and evaporative demand of the atmosphere. • At any given point in time, soil’s moisture content is the net result of these positive and negative forces.
 Hygroscopic Water is held so strongly by the") How is soil water classified? 1) Hygroscopic Water is held so strongly by the soil particles (adhesion), that it is not available to the plants 2) Capillary Water is held by cohesive forces greater than gravity and is available to plants 3) Gravitational Water is that water which cannot be held against gravity as water is pulled down through the soil, nutrients are "leached" out of the soil (nitrogen)
How is soil water classified? 1) Hygroscopic Water is held so strongly by the soil particles (adhesion), that it is not available to the plants 2) Capillary Water is held by cohesive forces greater than gravity and is available to plants 3) Gravitational Water is that water which cannot be held against gravity as water is pulled down through the soil, nutrients are "leached" out of the soil (nitrogen)
 • Gravitational water is the water that fills macropores. This water drains quickly. • Capillary water fills the micropores and drains slowly. This makes it available to plants between precipitation events. • Hygroscopic water is water that forms a thin film around individual particles. These particles hold it tightly in place, so much of this water is not available to plants. Source: Kaufmann, Robert K. and Cleveland, Cutler J. 2007. Environmental Science (Mc. Graw-Hill, Dubuque, IA).
 Field Capacity and Wilting Point
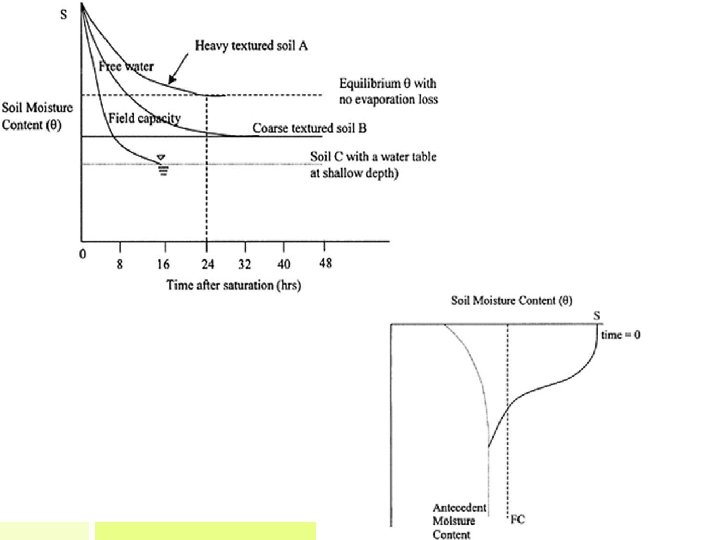
 Field Capacity • Field Capacity is greatest amount of water the soil can hold under drainage. • For most soils, it is obtained after two days of drainage after the soil was saturated by heavy rain or irrigation. • It is the optimum amount of water needed for agriculture. • After the drainage has stopped, the large soil pores are filled with both air and water while the smaller pores are still full of water. • At this stage, the soil is said to be at field capacity. • At field capacity, the water and air contents of the soil are considered to be ideal for crop growth
 Permanent Wilting Point and Available Water • Below Field capacity, the plant finds it more and more difficult to extract water until the suction or tension reaches 15 atmospheres permanent wilting point is obtained, which is the maximum tension the plant can exert on the soil to extract water. • Available water is the difference between the moisture contents at field capacity and permanent wilting point. • Clay holds more water but the plants exert more tension to extract water more than sand. • Little by little, the water stored in the soil is taken up by the plant roots or evaporated from the topsoil into the atmosphere. • If no additional water is supplied to the soil, it gradually dries out.
 Permanent Wilting Point • The dryer the soil becomes, the more tightly the remaining water is retained and the more difficult it is for the plant roots to extract it. • At a certain stage, the uptake of water is not sufficient to meet the plant's needs. The plant looses freshness and wilts; the leaves change colour from green to yellow. Finally the plant dies. • The soil water content at the stage where the plant dies, is called permanent wilting point. • The soil still contains some water, but it is too difficult for the roots to suck it from the soil
 Available water content • Plant available water, AW, may be defined as the difference between field capacity, FC, and wilting point, WP. The formula is: AWC = FC − PWP • The soil can be compared to a water reservoir for the plants. • When the soil is saturated, the reservoir is full. • However, some water drains rapidly below the rootzone before the plant can use it.
 The available soil moisture or water content Available water content = water content at field capacity water content at permanent wilting point
 Available water • The available water content depends greatly on the soil texture and structure. A range of values for different types of soil is given in the following table. Soil Available water content in mm water depth per m soil depth (mm/m) sand 25 to 100 loam 100 to 175 clay 175 to 250
 and available water content are") • The field capacity, permanent wilting point (PWP) and available water content are called the soil moisture characteristics. • They are constant for a given soil, but vary widely from one type of soil to another.
• The field capacity, permanent wilting point (PWP) and available water content are called the soil moisture characteristics. • They are constant for a given soil, but vary widely from one type of soil to another.
 RAW and AW • RAW is Readily Available Water, that is the water available to a plant’s roots stored in the soil within the plant’s root zone. • It is often referred to as AW, Available Water. • By knowing your soil types and the water requirements of your crops, in different climatic conditions, irrigation becomes accurate with none or very little wastage.
 • Using the table provided below, the RAW stored within the effective root zone for a soil can be calculated by measuring the thickness of each soil layer (in meters or parts of a meter) determining the soil texture of each layer, and then multiplying the thickness by the appropriate RAW Value.
 What affect does soil particle size have on its water holding ability? • The smaller the individual particles are, the more surface area there is, thus it will hold more water
 General relationship between soil water characteristics and soil texture. Note that the wilting coefficient increases as the texture becomes finer. The field capacity increases until we reach the silt loams, then levels off. Remember these are representative curves; individual soils would probably have values different from those shown.
 Water Holding Capacity
 of main texture groups. Figures are averages") Water holding capacity (mm/cm depth of soil) of main texture groups. Figures are averages and vary with structure and organic matter differences. Texture Field Capacity Wilting point Available water Coarse sand 0. 6 0. 2 0. 4 Fine sand 1. 0 0. 4 0. 6 Loamy sand 1. 4 0. 6 0. 8 Sandy loam 2. 0 0. 8 1. 2 Light sandy clay loam 2. 3 1. 0 1. 3 Loam 2. 7 1. 2 1. 5 Sandy clay loam 2. 8 1. 3 1. 5 Clay loam 3. 2 1. 4 1. 8 Clay 4. 0 2. 5 1. 5 Self-mulching clay 4. 5 2. 0 Source: Department of Agriculture Bulletin 462, 1960
Water holding capacity (mm/cm depth of soil) of main texture groups. Figures are averages and vary with structure and organic matter differences. Texture Field Capacity Wilting point Available water Coarse sand 0. 6 0. 2 0. 4 Fine sand 1. 0 0. 4 0. 6 Loamy sand 1. 4 0. 6 0. 8 Sandy loam 2. 0 0. 8 1. 2 Light sandy clay loam 2. 3 1. 0 1. 3 Loam 2. 7 1. 2 1. 5 Sandy clay loam 2. 8 1. 3 1. 5 Clay loam 3. 2 1. 4 1. 8 Clay 4. 0 2. 5 1. 5 Self-mulching clay 4. 5 2. 0 Source: Department of Agriculture Bulletin 462, 1960
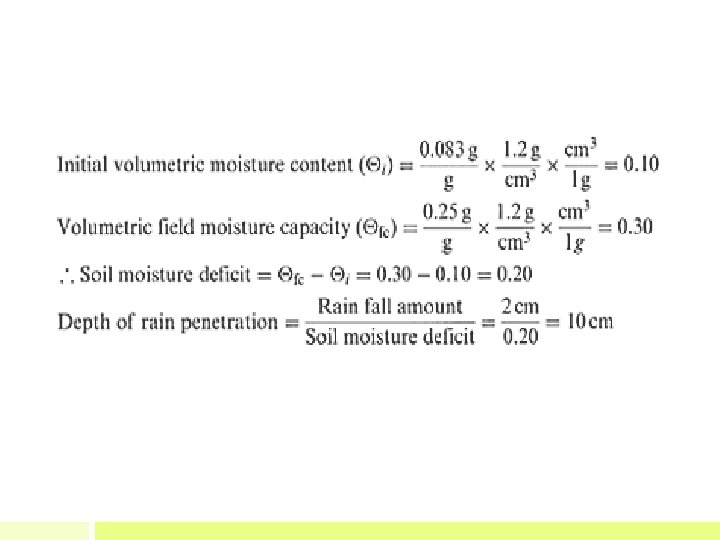
 Example 5. 1 • A soil with a bulk density of 1. 2 g/cm 3 has an initial gravimetric moisture content of 0. 083. If its field moisture capacity is 0. 25 (g/g), how deep will 2 cm of rain penetrate into the soil? Assume density of water (ρw) is 10 g/cm 3.
 Example 5. 2 • Consider that soil in the previous example is to be irrigated to field moisture capacity to 50 cm depth. How much of irrigation water is needed for 10 ha?
 Solution
 Example 5. 3 • From the data presented in Table 3. 1, calculate the available water capacity of the profile to 1 -m depth.
 into") Solution • Follow the steps shown below: 1. Convert gravimetric moisture content (w) into the volumetric moisture content (Θ) by multiplying with soil bulk density (ρb) and dividing by the density of water. 2. Compute actual AWCactual=(Θa–PWPΘ)d cm where Θa is the antecedent or actual field moisture content, PWPΘ is the volumetric moisture content at the PWP, d is depth of the corresponding horizon. Obtain the sum total of AWCactual for all horizons. 3. Compute potential AWCpotential=(FCΘ–PWPΘ)d cm where FCΘ and PWPΘ represent volumetric field capacity and permanent wilting point, and d is depth of the horizon. Obtain sum total of AWCpotential for all horizons.
Solution • Follow the steps shown below: 1. Convert gravimetric moisture content (w) into the volumetric moisture content (Θ) by multiplying with soil bulk density (ρb) and dividing by the density of water. 2. Compute actual AWCactual=(Θa–PWPΘ)d cm where Θa is the antecedent or actual field moisture content, PWPΘ is the volumetric moisture content at the PWP, d is depth of the corresponding horizon. Obtain the sum total of AWCactual for all horizons. 3. Compute potential AWCpotential=(FCΘ–PWPΘ)d cm where FCΘ and PWPΘ represent volumetric field capacity and permanent wilting point, and d is depth of the horizon. Obtain sum total of AWCpotential for all horizons.
 Example 5. 4 • Calculate potential and actual available water capacity from the data shown in Table 4. 10 1. How deep will 7 cm of rain penetrate? 2. How much irrigation is needed to bring the soil profile of 100 ha farm to Θfc?
 Measurement of Soil Water Measuring Soil Water Content Measuring Soil Water Potential
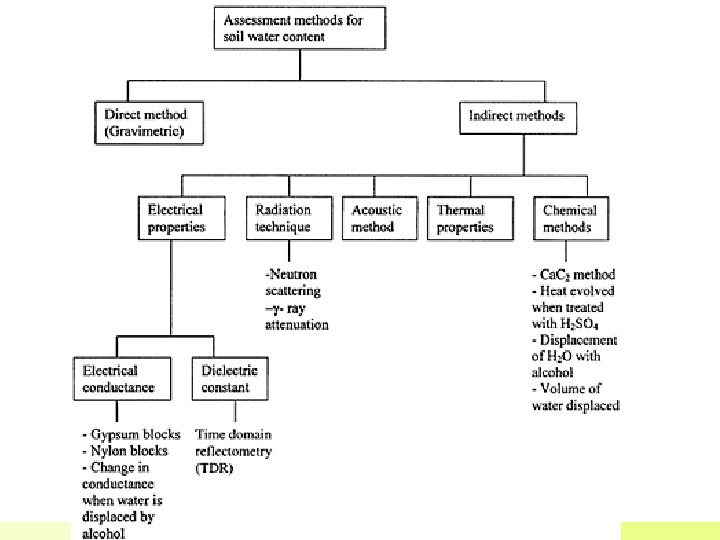
 Measuring Soil Water Content 1. Gravimetric Method 2. Neutron Scattering 3. Electromagnetic Methods 4. Capacitance Method
 Measuring Soil Water Content Gravimetric measurements include: • Weight basis • Volume basis • Soil depth basis • The physical technique of removing water from a sample of soil involves drying operation in an oven at 105°C about 24 hours. The different of weight before and after drying (the weight loss) represent the soil water
 Gravimetric measurements • Disadvantages: • Destructive method (a sample of soil must be removed for each measurement) • Cannot be automated • Temperature in the oven may not be uniform for different shelves, and/or the temperature control may not be accurate. • Because of the soil heterogeneity and spatial variability, large number of samples are required to obtain a representative value of soil moisture content.
 probe") Indirect method – neutron scattering • Neutron moisture meters comprise two parts: (i) probe and (ii) scalar or rate meter (Fig. 3. 6). The probe contains two components: a source of fast neutrons and a detector of slow or thermalized neutrons. • The scalar or rate meter is usually powered by a rechargeable battery, and is designed to monitor the flux of slow neutrons.
Indirect method – neutron scattering • Neutron moisture meters comprise two parts: (i) probe and (ii) scalar or rate meter (Fig. 3. 6). The probe contains two components: a source of fast neutrons and a detector of slow or thermalized neutrons. • The scalar or rate meter is usually powered by a rechargeable battery, and is designed to monitor the flux of slow neutrons.
 Advantages & Disadvantages • It is nondestructive, facilitates monitoring soil moisture content for the same site overtime, covers a large soil volume, and monitors volume of soil moisture (Fig. 10. 9). • However, there are numerous limitations of the technique. It is expensive, poses health hazards, requires specialized maintenance and repair, and there are specific problems with calibration. • The equipment calibration is influenced by texture, gravel content, stoniness, clay mineralogy, and soil’s chemical constituents. • Some elements present in the soil can capture neutrons. These include gadolinium, cadmium, boron, chlorine, manganese, and iron. • The measurements are also not very accurate for surface horizons, and in soils with high organic matter content (e. g. , organic soils).
 Capacitance Method • A capacitor is a device that can store electric charge. • It consists of two conducting objects placed near each other but not touching. • A typical capacitor consists of parallel plates of area A separated by small distance. • When voltage is applied, the capacitor becomes charged. • The amount of charge acquired by each plate is proportional to the potential difference V (Q=CV). • The constant of proportionality C is called capacitance. • The capacitance method involves using the moist soil as a part of the dielectric of a capacitor. • Measurement of the capacitance gives the dielectric constant, which changes with the soil’s moisture content.
 Advantages and Limitation • The capacitance method has numerous advantages. • It is economic, safe, without legal constraint, stable, and rapid by manual operations. • Because it involves the use of an access tube, the operation is similar to that of the neutron probe but is much safer and free from legal/policy constraints. • However, the techniques require calibration which may be influenced by the composition and density of soils. • This method is also not sensitive to the water held by surface adsorption forces or in chemical association with humus.
. • High-energy electromagnetic") Electromagnetic Methods • A widely used electromagnetic method is time-domainreflectometry (TDR). • High-energy electromagnetic pulse is fed into the soil between two metal rods. • A part of the pulse is reflected back up through the soil from the bottom of the rods and the time interval for the pulse to traverse back, or the time interval between the incident and reflected pulse, is measured. • This time interval is related to the soil’s moisture content.
Electromagnetic Methods • A widely used electromagnetic method is time-domainreflectometry (TDR). • High-energy electromagnetic pulse is fed into the soil between two metal rods. • A part of the pulse is reflected back up through the soil from the bottom of the rods and the time interval for the pulse to traverse back, or the time interval between the incident and reflected pulse, is measured. • This time interval is related to the soil’s moisture content.
") Measurement of soil water content using time domain reflectometry (TDR)
Measurement of soil water content using time domain reflectometry (TDR)
 Electromagnetic Methods • Major differences between the TDR and the capacitance methods are that the TDR method; • Measures an average dielectric constant over the length of the rod • Uses a pair of parallel rods inserted in the ground • Measures dielectric constant over a broad band of frequencies usually ranging from 100 to 1000 MHz • Measures electrical conductivity and dielectric constant simultaneously. • This method has numerous advantages of the neutron scattering and γ-ray attenuation methods, yet is free from health hazard and nuclear regulation. • However, calibration of the method and its reliability and reproducibility are still to be worked out.
 Conclusion
 Soil Water Potential • In view of these characteristics, soil-moisture potential, hereafter designated by the symbol Φ, is defined as “the amount of work that a unit quantity of water in an equilibrium soil-moisture system is capable of doing when it moves to a pool of water in the reference state at the same temperature. ” • Total soil water potential is measured in units of energy, which can be expressed per unit mass, volume or weight basis. 1. Energy per unit volume is expressed as ergs/cm 2, dynes/cm 2, N/m 2, 2. Energy per unit mass is expressed as ergs/g or J/kg, and 3. Energy per unit weight is expressed in terms of height of water as cm or m.
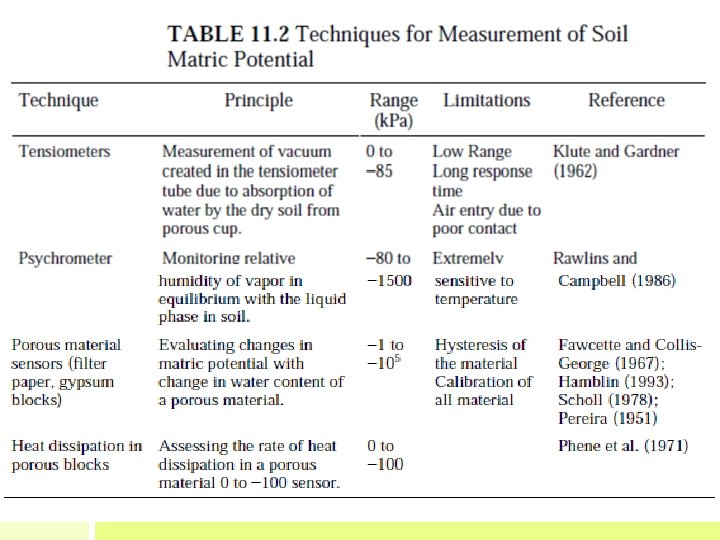
 Measuring Soil Water Potential 1. Pressure • Water Release Characteristic Curve 2. Electrical Resistance • Porous Blocks 3. Slowed neutrons from radioactive emitter • Neutron Probe 4. Electromagnetic wave transmittance • Capacitance Probes • Time Domain Reflectometry 5. Vacum suction • Tensiometers 6. Soil air relative humidity • Thermocouple Psychrometers
 Pressure Membrane Apparatus
 Tensiometer • Tensiometers are the most widely used for a low range of soil water potential, and are relatively simple, inexpensive, easy to install, and have a sensitivity of about 0. 1 KPa. • Major limitations of tensiometers include the following: i. insensitivity to soil solution osmotic potential rendering them unsuitable for measuring in salt-affected soils, ii. restricted measurement range of 0 to − 80 KPa, iii. long response time, iv. poor soil contact in gravelly soils, v. increase in matrix potential due to movement of water from cup into the adjacent soil as influenced by the soil’s and cup’s hydraulic conductivities
 Potentiometer/Tensiometer
 Resistance block
 Zzzzz
Zzzzz