Demography and Population Characteristics.pptx
- Количество слайдов: 29


Sociology Lecturer: Prof. Jarosław Rokicki, Ph. D. hab. Demography and Population Characteristics

Human beings are a part of biological structure 1. Human population is determind by biological processes of life and death. 2. Biological factors (processes of birth, life, and death) are parts of biological system in which humans create a subsystem. 3. Human population is a system in constant interaction with its enviroment (biological structure) 4. Living systems (biological structures or organisms) have capacities to reproduce themselves.
 have been transformed by process of biological evolution 1.")
Biological structures (human beings included) have been transformed by process of biological evolution 1. Organisms have existed on earth for about 4 billion years 0, 5 billion shorter tha the earth’s age (billion in American English = 1, 000, 000 = the natural number following 999, 999 and preceding 1, 000, 001) 2. Organisms have transformed their biological structures in the process of biological evolution 3. Biological evolution: the process of change in the biological structure of organisms from generation to generation 4. Biological adaptation: changes which the ability of organisms to the adjust to enviroment or to alter it to adjust to themselves
: “Demo-” from Ancient Greek δῆμος dēmos, means “the people” and “graphy”")
Demography Meaning (etymology): “Demo-” from Ancient Greek δῆμος dēmos, means “the people” and “graphy” from γράφω graphō, means “measurement ” or description Definition: Demography is the statistical study of human populations. It can be a very general science that can be applied to any kind of dynamic living population, i. e. , one that changes over time or space. It encompasses the study of the size, structure, and distribution of these populations, and spatial and/or temporal changes in them in response to birth, migration, aging, and death. Objects under research: individuals, families or households The most frequently reported demographic and social attributes: age, sex (gender), race, education, profession, and many others

Common Rates and Ratios • The crude birth rate, the annual number of live births per 1, 000 people. • The general fertility rate, the annual number of live births per 1, 000 women of childbearing age (often taken to be from 15 to 49 years old, but sometimes from 15 to 44). • age-specific fertility rates, the annual number of live births per 1, 000 women in particular age groups (usually age 15 -19, 20 -24 etc. ) • The crude death rate, the annual number of deaths per 1, 000 people. • The, infant mortality rate, the annual number of deaths of children less than 1 year old per 1, 000 live births. • The expectation of life (or life expectancy), the number of years which an individual at a given age could expect to live at present mortality levels.

Common Rates and Ratios • The total fertility rate, the number of live births per woman completing her reproductive life, if her childbearing at each age reflected current age-specific fertility rates. • The replacement level fertility, the average number of children a woman must have in order to replace herself with a daughter in the next generation. (For example the replacement level fertility in the US is 2. 11. This means that 100 women will bear 211 children, 103 of which will be females. About 3% of the alive female infants are expected to decease before they bear children, thus producing 100 women in the next generation) • The gross reproduction rate, the number of daughters who would be born to a woman completing her reproductive life at current agespecific fertility rates. • The net reproduction ratio is the expected number of daughters, per newborn prospective mother, who may or may not survive to and through the ages of childbearing.

Common Rates and Ratios • A stable population, one that has had constant crude birth and death rates for such a long period of time that the percentage of people in every age class remains constant, or equivalently, the population pyramid has an unchanging structure. • A stationary population, one that is both stable and unchanging in size (the difference between crude birth rate and crude death rate is zero). • A stable population does not necessarily remain fixed in size. It can be expanding or shrinking.

Demographic bookeeping • Demographic bookkeeping is used in the identification of four main components of population growth during any given time interval. • The demographic bookkeeping equation is as follows: • P 2 = P 1 + (B - D) + (Mi - Mo) • The four components being studied by this equation are Population Growth (P 1, P 2), Births (B), Deaths (D), and In (Mi) and Out (Mo) Migration. • Meaning: the population at any time is equal to the earlier population plus the excess of births over deaths in the time, plus the amount of in-migration minus the amount of out-migration.

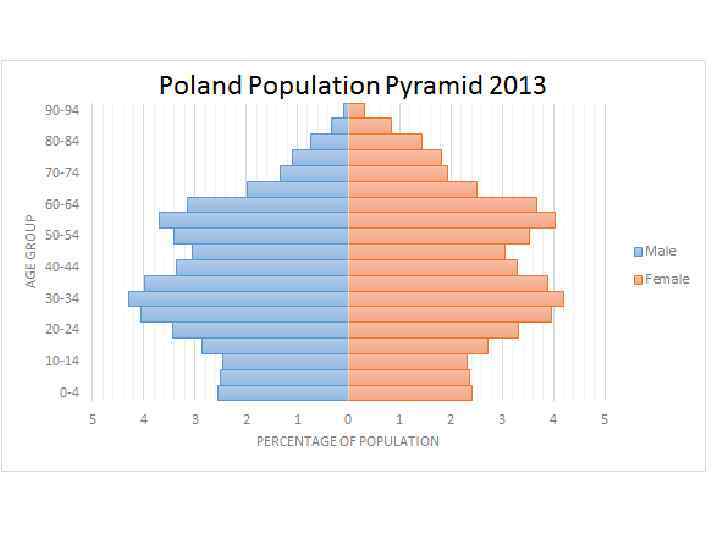
Population pyramid example

Age pyramids
")
Podstawowe pojęcia demograficzne (struktura ludności)
")
Piramida wieku ludności wg płci i wieku w Polsce (2007)

More basic definitions in demography A generational cohort has been defined as "the group of individuals (within some population definition) who experience the same event within the same time interval. ” The working age (Poland): 18 – 64, 18 – 67 (males), 18 – 59, 18 – 67 (females) The legal working age is the minimum age required by law for a person to work, in each country or jurisdiction. Vital statistics: statistics on live births, deaths, fetal deaths, marriages and divorces. The most common way of collecting information on these events is through civil registration, an administrative system used by governments to record vital events which occur in their populations Human migration is the movement by people from one place to another with the intention of settling temporarily or permanently in the new location. The movement is typically over long distances and from one country to another, but internal migration is also possible. Migration may be individuals, family units or in large groups
")
Państwa świata według liczby ludności (2012)

Population’s size in the largest states of the world Liczba ludności Lp. Państwo - Świat 6 580 500 200 6 658 506 778 6 737 215 097 6 815 816 775 6 945 113 989 7 021 836 029 1 Chiny 1 314 480 000 1 321 290 000 1 328 020 000 1 338 612 968 1 336 718 015 1 343 239 923 2 Indie 1 095 351 995 1 129 866 154 1 147 995 898 1 166 079 217 1 189 172 906 1 205 073 612 - Unia Europejska 486 642 177 490 426 060 491 018 677 491 582 852 492 387 344 503 824 373 3 Stany Zjednoczone 298 444 215 301 139 947 305 548 000 307 212 123 313 232 044 313 847 465 4 Indonezja 245 452 739 234 693 997 237 512 355 240 271 522 245 613 043 248 216 193 5 Brazylia 188 078 227 190 010 647 191 908 598 198 739 269 203 429 773 205 716 890 6 Pakistan 165 803 560 164 741 924 167 762 040 176 242 949 187 342 721 190 291 129 7 Nigeria 131 859 731 135 031 164 138 283 240 149 229 090 155 215 573 170 123 740 8 Bangladesz 147 365 352 150 448 339 153 546 901 156 050 883 158 570 535 161 083 804 9 Rosja 142 893 540 141 377 752 140 702 094 140 041 247 138 739 892 138 082 178 10 Japonia 127 463 611 127 433 494 127 288 419 127 078 679 126 475 664 127 368 088 11 Meksyk 107 449 525 108 700 891 109 955 400 111 211 789 113 724 226 114 975 406 12 Filipiny 89 468 677 91 077 287 92 681 453 97 976 603 101 833 938 103 775 002 2006 2007 2008 2009 2011 2012
")
Net migration (2011)

Permanent sources of light during a night: the global visualisation

Death rate per 1 000 people in one year

Birth rate per 1 000 people in one year

Infant mortality rate (the annual number of deaths of children less than 1 year old per 1, 000 live births)

RATE OF NATURAL INCREASE (difference between the number of live births and the number of deaths occurring in a year, divided by the mid-year population of that year, multiplied by 1000 (‰)

Mediana wieku w poszczególnych krajach. Mediana światowa to 27, 6 lat

World’s population increase
")
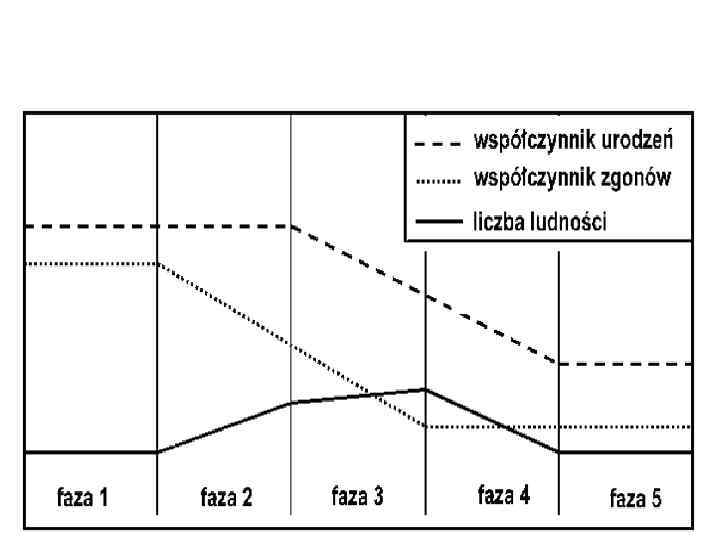
Demographic Transition Model (DTM)

Model 4 -fazowy przyrostu ludności

Model 5 - fazowy
Demography and Population Characteristics.pptx