1fa80270088763755512f91ede9ce0aa.ppt
- Количество слайдов: 108


Soaring Weather Presented by Jim Martin 2015

Basic Principles • Obtain the basic weather data 1 st • Is it Dangerous / Soarable ? • Understand How the atmosphere works – Its Our Engine! – Calculations to see if soaring is possible • Graphs and Maps improve understanding • Continue throughout the flight to Analyze & Update

Obtaining Weather Data • Look Outside – Gain Personal Experience – …Yet Airport may be 60 miles away! • Consult Online Weather Sources – 1 st – 1800 Wx. Brief. com (Lockheed Martin off. Site) – National Weather Service / Duat / DUATS – Call Flight Service Station (1 -800 -WXBrief) • ASOS /AWOS /ATIS – Phone #s in AFD • Make a Local Sounding • Cell Phone / NEXRAD Sites

Weather Briefing • Online Http\www. 1800 Wx. Brief. com • FSS call 1 -800 -992 -7433 (1800 WXBrief) – Identify yourself as a glider pilot • Give Aircraft ‘N’ number • type of flight and location – Ask for; • • • standard briefing / forecast surface reports winds aloft forecast Soaring forecast – including LI, overcast, turbulence other pertinent data (Notams, TFR’s)

Same Charts as Briefer Uses

ADDS METAR/TAF Data

Vans. Air. Force. Weather • • • Better Site - Yet Not Official All Charts come from Official Sites Logically Grouped Together Typical Order Pilot’s are interested in Can be Customized to your location or likes

Vans. Air. Force. Weather. com


Decision Making • Be realistic! – Are Storms forecast for later in the day/evening – Strong x-winds later in day? (not often forecast) – Local vs Long X-C flight – Your experience level – Precipitation? – How Soarable is the Weather?

Continue Your Weather Analysis throughout Flight • Enroute weather data – Flight Watch (122. 0 MHz) – Airport automated weather services – ATIS/ASOS/AWOS • Smart Phone / Cell Phone Updates • End-of-flight weather data – Wind direction for landing – ATIS / ASOS – Current Altimeter setting • Other Pilots 122. 8 / 122. 9 / CTAF • 123. 5 MHz glider ground crew
 122. 0 • • • AIM section")
En Route Flight Advisory Service (Flight Watch) 122. 0 • • • AIM section 7 -1 -5 Real-time weather advisories National coverage above 5000 ft on 122. 0 Available 6: 00 am to 10: 00 pm State ARTCC facility, N number, & nearest VOR name • Eg. “Buffalo Flight Watch, this is. . ”

Hazardous Weather • • • Fronts Winds Airmass Changes Precipitation Overcast

Cold Front Src: Aviation Weather AC 00 -6 A

Cold Frontal Weather • Cold Front Passage - Cumulus then Cumulonimbus • • Overcast / High Cirrus 2 Days Prior May Superheat air in front of airmass if fast moving Squall lines 50 - 300 miles ahead – Gusty day prior Frontal Passage = Wind Shift + Day after is typically Super Adiabatic (Chopped Up) + Ground has to Dry Out + Good Soaring conditions - 2 days after + Typically Clear, Good Visibility, Higher Cloudbase

Warm Front Src: Aviation Weather AC 00 -6 A

Warm Frontal Weather • Warm Airmass – High Stratus Increasingly Lowers – Deep temperature inversion – Increasingly Stable – lowering cloudbases – broad overcast cloud system precedes front – + Stable Air = Ridge Soaring • Occluded = Generally Not Soarable – both warm & cold cloud patterns

Colder Overtaking Occlusion Front Warm Air Aloft Src: Aviation Weather AC 00 -6 A

Warm-Occlusion Front Cool Air overtaking Colder Src: Aviation Weather AC 00 -6 A
 Able to detect airmass")
Airmass Changes Mount a Sensitive Thermometer (measures. 10 deg change) Able to detect airmass changes Watch for significant Cloud changes throughout the day Can signal approaching Front / Airmass change Winds: Shifting or Speed Significant changes


Atmospheric Facts • WEIGHT: A cubic inch of air near the ground at sea level has about 14. 7 pounds of air sitting on top of it, pushing it down • Pressure Decreases with Altitude • 1” hg (Mercury) = 1000 ft difference • 14. 7” @ Sea Level (Density) • @ 18, 000 ft Density / Pressure is ½ of sea level

Air Facts • Air holds Water: Water Vapor REDUCES Density of Air – 10 C Warmer Air can Absorb TWICE amount of Water Vapor…. . – 10 C Colder Air can only hold ½ the water

Water Vapor Content • Air always holds water, but only up to a certain amount of it--more than that and you get condensation • The higher the dew point temperature, the more water is in the air • When Dewpoint and Temperature are equal = 100% Saturated = Clouds /Fog

Bouyancy • Warm Air Rises through Cooler Air Aloft – Bigger the Difference = Faster Ascent Rate ! – Larger Heated Area = More Inertia & Momentum (Rises Higher) • It takes a lot of sunshine to evaporate any water on the ground • Moist Air (Saturated) Rises ½ as Fast as Dry

Lifting Rate Assumptions • Any ground water has to evaporate 1 st – 440 calories / gram of water / 1 deg C – A lot of heat to evaporate a small amount of H 20 • Air rises at the DRY Lapse rate 1 st from the ground ~3 -5 C/1000 ft (It’s not Saturated) • As it cools, the parcel humidity increases until it reaches the condensation level (cloudbase) where it’s 100% saturated – Rises at the WET Lapse Rate ~2 C/1000 ft

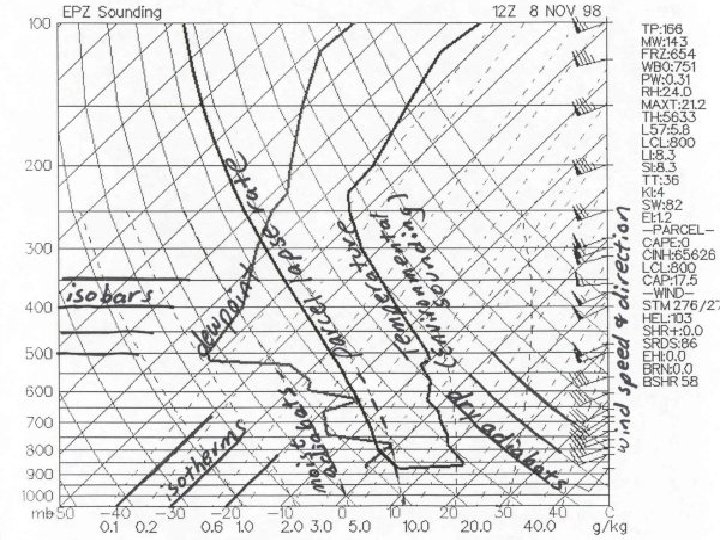
What are SOUNDINGS? • Temperature and Dewpoint and Wind Directions and Speed plotted vs. increasing Altitude (Pressure) – Done at 6 AM and 6 PM with weather balloons – Now done by Satellites with Computer modelling • Plot is called a “Sounding” and Chart is called a “Skew-T” • It displays the characteristics of the airmass

Skew-T / Sounding Constant Temperature “Skewed”. . Angled Up & to the Right Vs. Altitude

Constant Temp NOAA Chart
")
All those Lines !! Actually calculations • Mixing Ratio = Constant Water Content (Gray) • Temp (Red) • Alt. (Blue) Pressure / Feet
 = 25 C")
Dry Adiabat Line from Surface Temp at Surface (1200 ft MSL) = 25 C Rises along DRY Adiabatic Line to 7500 ft where it has cooled to 08 C
 Along Constant Mixing Line to")
Cloudbase Project Up from Surface Dewpoint Temp (10 C) Along Constant Mixing Line to where it intersects the Dry Adiabat drawn from the Surface Temp (of 25 C) = 7000 ft.

Lapse Rates Rate at which the Temp Decreases as the Air Ascends • DRY Adiabatic = 3 -5 C (5 -7 F) / 1000 ft • WET Adiabatic = 2 C (3. 5 F)/ 1000 ft • So… Dry air is Better! • Rough Estimation … Cloud base = (max surface temp dewpoint)/2 C = (in 1000’s of ft)
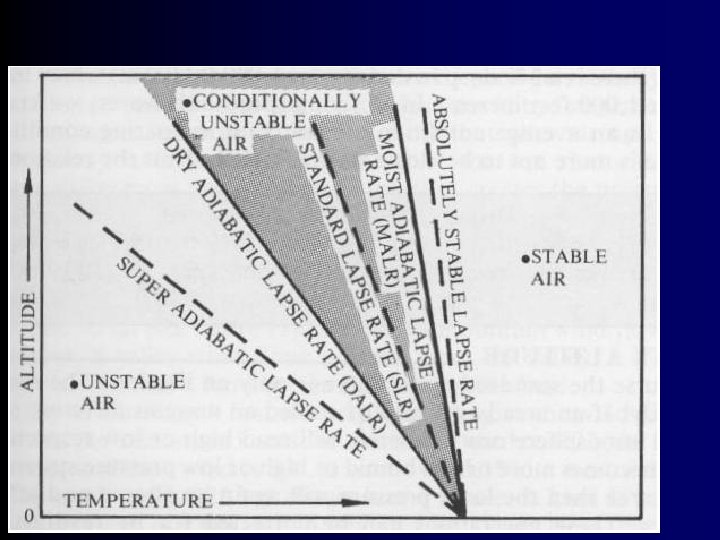


Thermal Lifting • If Air Above is cooler and not saturated… – Rises and cools at the DRY LAPSE Rate (5 F / 1000 ft) – Once it cools to the Dewpoint … it rises at the WET (Saturated) LAPSE Rate (3. 5 F / 1000 ft) ==== Slower

Airmass Stability • Stable = Doesn’t Want to Go Up ? ! • Unstable = Wants to Go Up! • Thermal Index (TI) / Lifted Index (LI) = How Fast it wants to Go Up!
/1000 ft –")
Cloudbase Estimate • Dry adiabatic lapse rate 5. 4 o (3 C)/1000 ft – Wet adiabatic lapse rate – Dew point decreases less than dry 2 Co / 1000 ft • Therefore if air is unsaturated…. – Surface Temp – Dewpoint Temp ÷ 2 C = Cloudbase • eg. 20 C (surf. )– 10 C (dewpoint) = 10 ÷ 2 = 5000 ft Cloudbase

Conclusions • Drier & Cooler Air aloft means Stronger Thermals • Drier ground means thermals start earlier • As Surface Dewpoint Spread increases…. Cloudbase goes UP • Higher elevations (at same temp) trigger thermals earlier and stay later
/Stays the same, or same as std")
Airmass Stability • Stable = Temp increases (Inversion)/Stays the same, or same as std lapse rate as altitude increases {pos stabilty number} • Unstable = Temp decreases more rapidly than standard lapse rate {minus number) • Thermal Index (TI) / Lifted Index (LI) is comparison between 5000 ft (850 mb) temp and 10000 ft (700 mb) temp
 • • • Morning Low* Max Expected")
Typical FSS Soaring Forecast (6 AM Sounding) • • • Morning Low* Max Expected Temp T. I. at 5000 ft T. I. at 10, 000 ft Height of -3 TI Top of Lift 50 F 10 C 89 F 35 C -5 +2 7200’ 8500’ • (They assume a 3 C lapse Rate / 1000 ft) • Note: Their Skew-T Looks Different !

Step 1, draw the adiabatic line 35 C

Step 2, add the Sounding

Step 3 Draw the sounding

Step 4: Calculate the Difference between the Dry Lapse Rate Line and the Sounding at the Altitude you Select = Thermal Index Src: Soaring Flight Manual

Thermal Index TI = +6 TI = -10 Src: Soaring Flight Manual

Dewpoint Plots • Wherever the Dewpoint Touches or is close to the plotted temperature = Clouds will form • If the Dewpoint is close at other levels… cloud layers will exist at that level

Internet Sources • Kevin Ford - http: //www. soarforecast. com • NOAA-FSL, Forecast Systems Laboratory http: //www-frd. fsl. noaa. gov/mab/soundings/java/ • Aviation Digital Data Service http: //adds. aviationweather. noaa. gov • Dr Jack BLIPMAP http: //www. drjack. info/BLIP/index. html

Kevin Ford Plots • • • • • • === Interpolations (temps MSL *TI* Wdir@kts trig ----- ---10000 12. 4 40 9500 11. 6 39 9000 10. 7 280 27 37 8500 9. 8 35 8000 8. 8 290 25 34 7500 7. 9 32 7000 6. 9 295 24 30 6500 6. 0 29 6000 3. 7 300 27 25 5500 3. 6 24 5000 3. 5 24 4500 3. 3 24 4000 2. 1 22 3500 0. 8 19 3000 -0. 5 18 2500 -1. 8 16 2000 -2. 1 15 1500 -2. 1 15 1000 -2. 1 15 in deg. F, altitudes in feet MSL) === Vir. T 1. 2 degrees/division ("`": Dry Adiabatic). ----------------------| -9. 8 ` : | -8. 6 ` : | -7. 5 ` : | -6. 5 ` : | -5. 5 ` : | -4. 5 ` : | -3. 5 ` : | -2. 6 ` : | -4. 0 ` : | -1. 5 ` : | 0. 9 ` : | 3. 3 ` : | 3. 7 ` : | 4. 1 `: | 4. 4 : ` | 4. 8 : ` | 7. 0 : ` | 9. 7 : ` | 12. 3 : `

NOAA Forecast Plot

Cloud Layer 30, 000 ft Cloud Layer 1000 to 7500 ft

Noaa Skew T’s • Temperature Plot vs Altitude – If Temp increasing = Stable Air (Inversion) • Dewpoint Plot vs Altitude – If Temp Plot touches or is close to Dewpoint = – Predicts where Clouds and Layers will form • Winds Aloft • Knowing Forecast Max Temperature = – Predicts Height of Thermals – If Significant Heating = Excess Energy is Hatched

Evaporation • Evaporation take 7. 5 times as much energy as melting or freezing. ( 440 cal. / deg C) • Condensation at Cloudbase Gives Off that Energy and the parcel continues to rise unless an inversion is above it. • Avoid Rain Soaked Areas • It May take a day or more to dry the ground after rainfall
 – Cloudbase = altitude where air is 100%")
Definitions • LCL (Lifted Condensation Level) – Cloudbase = altitude where air is 100% saturated • CCL (Convective Condensation Level) – Height predicted a parcel will reach based upon max temp {above the LCL} • LI (Lifted Index) negative indicates unstable = Thermals • KI (K Index / Showalter) amount of water in parcel if >400 TStms likely
 • http: //www-frd. fsl. noaa. gov/mab/soundings/java/")
Best Sites Interactive Skew T (Moninger/ NOAA) • http: //www-frd. fsl. noaa. gov/mab/soundings/java/

Bad Winter Day Massive Inversion………

. . Yet Clouds from Surf to…. . 15, 000 ft !! If it Got to 75 F. . Could Soar to 30, 000 ft

Best Book • Understanding the Sky • By Dennis Pagen

Clouds & Thermals
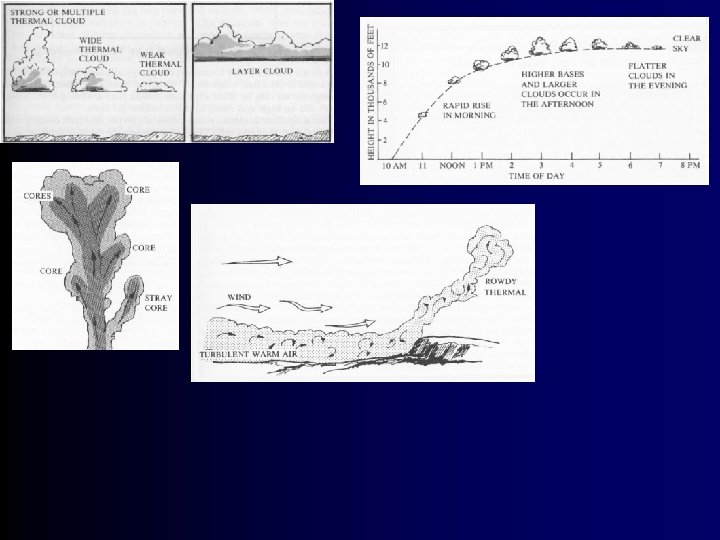

Condensation releases latent heat. This causes the temperature of a cloud to be warmer than it otherwise would have been if it did not release latent heat. Anytime a cloud is warmer than the surrounding environmental air, it will continue to rise and develop. The more moisture a cloud contains, the more potential it has to release latent heat.

Dr Jack’s BLIPMAPS

BLIPMAP Assumptions • Your Sailplane Sinkrate must be subtracted from the predicted Climbrate • Must Subtract the Terrain Height from the Thermal / Cloudbase Height (is MSL Alt. ) • Assumes NO Overcast unless Stippling added • Is Based on Atmospheric Models forecast for 6 AM –is NOT Updated throughout day

Blipmaps • Does Not predict or use any Precipitation on the ground

Local Effects • Terrain features – Ridges – Mountains – Rivers – Lakes – Towns

Local factors • Ridge conditions – Calculations – Predictions • 90 O +/- 30 O to ridge line • 10 - 15 kts – Ridges • Lift extends 2 – 3 times the ridge height • Ridge length should be several miles

Ridge Weather • Stable Lower Level Airmass • Wind within 30 deg of perpendicular to Ridge • Wind increasing with altitude • Wind > 5 K, better the faster, upto 30 K • Beware of Sink behind ANY ridge

Ridge Lift Zones Gradual Slope Sharp Slope Eddy formation

Local factors • Wave conditions – Calculations – Predictions • Wind at peak – 15 – 20 kts • Wind 2000 m above peak – Same direction – 20 – 25 kts higher

Wave Weather • • • Lower Stable Layer / Unstable / Stable Aloft Winds > 15 K / Increasing with Altitude Significant geographic elevation change 90 deg is optimum Strength increases if amplified by another terrain feature in phase with primary

Mountain Wave System

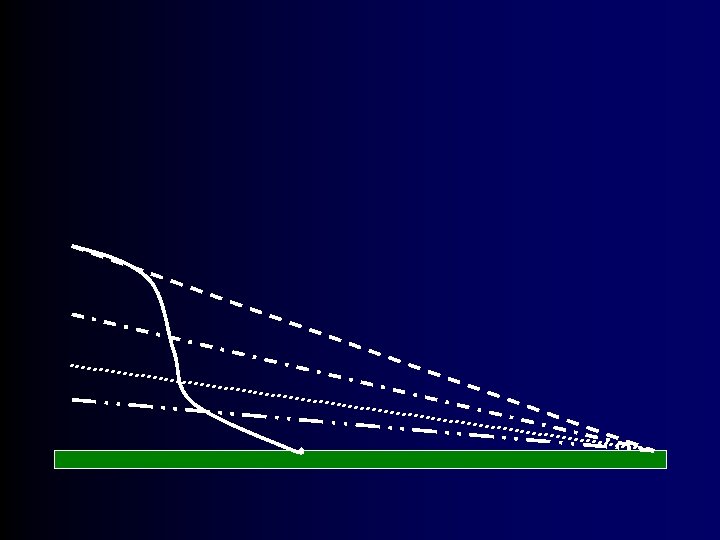
Transition pilot wave sketch Lenticular Rotor 3/18/2018

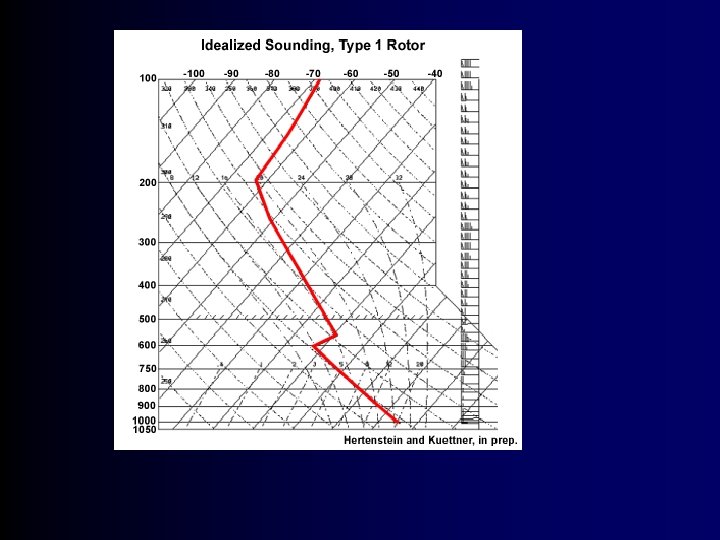
W o r k a b l e Some rotor research in progress 3/18/2018

W o r k a b l e Some rotor research in progress 3/18/2018

Thermal Predictors/Indicators • • • Negative Thermal Index values at alt. Forecast plots Clouds Birds – Eagles & Hawks see in the Infrared Gliders circling – Most expensive Variometer ever invented (another sailplane) • Dirt, crops, houses, animals rising before your eyes

Seasonal Weather Operations • Density Altitude Increases with Temp • Thunderstorms – Spring & Fall • Temperature extremes • Wind shear • Microbursts • Foliage & Ground Cover – Ground Temperature at start of day • Frost, Snow Ice

Determining When to Land • What effect does the wind have on landing? • Why Fly a Pattern? • Unplanned for Crosswinds account for over 30% of landing accidents

Effect of 20 Kt wind 9 27 Time on Downwind: More, Less, no Change? Altitude loss: More, Less, no Change? 20 Kts

Effect of 20 Kt wind 9 27 Time on base: More, Less, no Change? Altitude loss: More, Less, no Change? 20 Kts

Effect of 20 Kt wind 9 27 Time on Final: More, Less, no Change? Altitude loss: More, Less, no Change? 20 Kts

Effect of 20 Kt wind 9 27 Which path is your student likely to fly? Which path do you want them to fly? 20 Kts 4 3 1 2
 200 60 kts @ 500 ft/m decent rate 12: 1")
Final Approach (No wind) 200 60 kts @ 500 ft/m decent rate 12: 1 glide slope 24 seconds 2400
 200 60 kts @ 500 ft/m decent rate")
Final Approach (20 Kt Head Wind) 200 60 kts @ 500 ft/m decent rate 8: 1 glide slope 24 seconds 1600 2400
 200 60 kts @ 500 ft/m decent rate")
Final Approach (20 kt wind shear) 200 60 kts @ 500 ft/m decent rate Maintain constant speed during approach How much time remains? 20 kts X Y 1600 2400

Decision Time • With a 20 kt shear, are you likely to – overshoot (into area Y) – undershoot (into area X) • Said another way, what actions do you need to take to reach your intended touchdown point – close the spoilers to extend (when undershooting) – open the spoilers to sink faster (overshooting) • Another variation, what will the aim spot do? – move up on the canopy (undershooting) – move down on the canopy (overshooting)

Glide Distance L/D 8 12 20 Height 100 67 40 distance 800 800 27 30 800

With 20 K Headwind

How much Altitude does it take to regain original airspeed? ?
 Time (s) Alt Remaining (ft) Distance (ft)")
Transition through Wind Shear Line Speed (kts) Time (s) Alt Remaining (ft) Distance (ft) 60 0 100 800 50 1 89 867 40 2 70 934
 200 2 seconds for the glider to stabilize")
Final Approach (20 Kt Wind Shear) 200 2 seconds for the glider to stabilize at the new sink rate AOA increases from 0. 5 o to 5. 0 o 20 kts 934 1600 2400
 Time (s) Alt Remaining (ft) Distance")
Distance & Altitude during recovery phase Speed (kts) Time (s) Alt Remaining (ft) Distance (ft) 40 0 70 934 47 1 56 1012 53 2 31 1110 60 3 -5 1230
 200 3 seconds to accelerate back to 60")
Final Approach (20 Kt Wind Shear) 200 3 seconds to accelerate back to 60 Kts Glider nose is 20 o below the horizon 20 kts 1230 1600 2400
 200 No Wind Constant headwind 20")
Final Approach (Likely outcome in 3 cases? ) 200 No Wind Constant headwind 20 Kt Wind Shear 1230 1600 2400

Shear Encounters • When can this happen? – Landing in gusty conditions – Landing area shielded by obstructions – During good thermal conditions (backside of a passing thermal)

Recommendations • Plan for this loss of energy – Pick an approach speed that will allow for some loss – Move base leg closer to runway edge – Be higher turning Final – Be prepared to close the spoilers – Be prepared to pitch forward to maintain/recover airspeed

Conclusions • Shear line causes loss of Total Energy • Large Pitch change required to rapidly recover lost energy • Large amount of Time ‘lost’ while total energy changes • Immediate action is required to reach original touchdown point!

Effects on Landing • Steady wind requires more energy – 800 feet closer or 100 ft higher for 20 kt wind • Changing wind requires more energy • Sink requires more energy • Ask yourself “Are you more likely to wind up getting low or high on final? ”

SO … What have you Learned?
1fa80270088763755512f91ede9ce0aa.ppt