

4d46ccb44d15a1ca679839e29f65d6b0.ppt
- Количество слайдов: 42
 So you are over the limit? Or are you? Peter Robinson Ph. D FNZIC Environmental Client Services Manager Hill Laboratories
") Summary n Laboratories produce data which is used for many reasons n Subdivisions (NES) n Fertilizing farms (Cd Guidelines) n Resource Consent n Discharge Consent (TW By-laws) n Water Supplies (NZDWS) n Regional Council Environmental Reporting (NBL) n Trade Waste discharges n Approaches for comparison to guidelines n Some real-life examples n Conclusions
Summary n Laboratories produce data which is used for many reasons n Subdivisions (NES) n Fertilizing farms (Cd Guidelines) n Resource Consent n Discharge Consent (TW By-laws) n Water Supplies (NZDWS) n Regional Council Environmental Reporting (NBL) n Trade Waste discharges n Approaches for comparison to guidelines n Some real-life examples n Conclusions
 Subdivisions n You are subdividing an old orchard. n The NES has an SGV for lead of 160 mg/kg (Lifestyle/25% home grown produce). n A value of 165 is obviously over the limit. Remediation is required.
 Labs test for Total Recoverable Lead No test for") NES SGV (Soil Guideline Values) Labs test for Total Recoverable Lead No test for “Inorganic Lead”
NES SGV (Soil Guideline Values) Labs test for Total Recoverable Lead No test for “Inorganic Lead”
 Methods for metals n n n Results will depend on the test method Limits are rarely linked to a method Results have an “Uncertainty” 160± 14% = 138 – 182 range for 95% probability So 206 over, 134 under, what about 175?
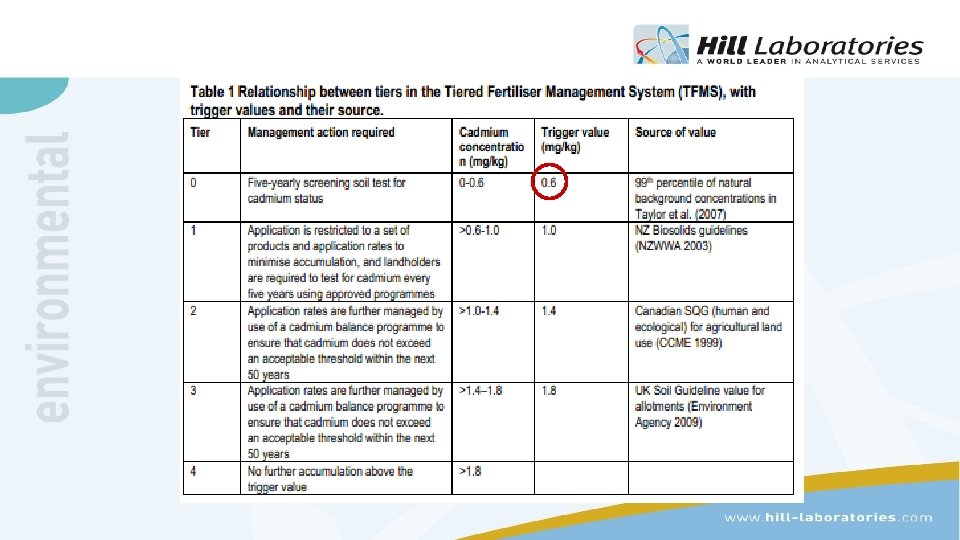
 Cadmium Guidelines n Your high country sheep and beef farm has just had the soil tested. n The new Cadmium Guideline has a Tier 1 trigger value of 0. 6 mg/kg. n A result of 0. 59 is obviously under the limit. Unfettered use of any preferred fertiliser can continue.
 Test Methods for Cd The result you get will depend on the method!
 Resource Consents n The Resource Consent states “The five day biochemical oxygen demand (BOD 5) shall not exceed 20 grams per cubic metre”. n Your result for TBOD 5 is 33. B. . . .
 TBOD 5 vs CBOD 5 The Test Method is IMPORTANT!
 The answer is. . . . “BOD” Limit = 20 Test for CBOD 5 not TBOD 5! The result you get will depend on the method!
 Discharge Consent
 Drinking Water n You have put in a new housing development, with its own private water supply. n The test result comes back at 11. 0 mg/L for nitrate-N. The MAV is 11. 2. Great, sales can proceed.
 DWSNZ 2008
 DWQM n Guidelines for Drinking-water Quality Management for New Zealand 2013 631
 The Guidelines for Drinking-water Quality Management for New Zealand October 2005 Chapter 17 Monitoring n The upper one-sided 95% confidence limit will be termed the adjusted result. n Therefore it will be the adjusted result, and not the raw result (i. e. the face-value result), that must be compared against the MAV or operational requirement from 1 January 2008. n If this adjusted result exceeds the MAV or operational requirement, a transgression will have occurred. May be superceded?
 Results not <50% MAV On-going monitoring required
 states a National Bottom Line") Freshwater The National Policy Statement for Freshwater Management (2014) states a National Bottom Line of 0. 75 mg/L (750µg/L) for Total N in a lake. Your result of 0. 8 means the lake has a “D” Attribute, arousing public outrage.
Freshwater The National Policy Statement for Freshwater Management (2014) states a National Bottom Line of 0. 75 mg/L (750µg/L) for Total N in a lake. Your result of 0. 8 means the lake has a “D” Attribute, arousing public outrage.
 NBL National Policy for Freshwater Management 2014 Mf. E NZ 750 mg/m 3 = 0. 75 mg/L Your result: Total N = 0. 8 Lake Waikare, 3 News
 HL Clyde St TW Consent
 Organic Strength = < 20 kg/day To calculate needs; BOD (CBOD 5, TBOD 5? ) Water Usage/day
 UOM & Test Methods n Every day laboratories produce thousands of results n HL Environmental produces >13000 results/day. n Others compare these results with “Guidelines” or “Standards” and make (sometimes expensive) decisions based on this. n But n the results produced are subject to an “Uncertainty of Measurement (UOM)”, and n will depend on the method used to produce them. Which may be different to the method used to set the guideline.
 Approaches for Comparisons Some real-life examples will be discussed, along with options for how comparisons of laboratory results with guidelines may be approached
 Comparison of a measurement with a fixed value n Approach 1 n ignore uncertainty in the test measurement n Approach 2 n round down, or up n Approach 3 n accept uncertainty in the test measurement n (a) permissive n (b) precautionary
 The Guidelines for Drinking-water Quality Management for New Zealand October 2005 Chapter 17: Monitoring 17. 6. 2 Comparison of a measurement with a fixed value Has a MAV or operational requirement been transgressed? Either a precautionary or a permissive approach can be taken Which approach is followed depends on the stance taken by the regulatory authority on the burden of proof. (See Mc. Bride 2005). Precautionary approach n taken by most public health authorities around the world n assumes “guilty until proven innocent beyond reasonable doubt”, i. e. there must be 95% confidence that the fixed value has not been exceeded, for compliance to be inferred. the upper confidence limit (UCL) must not exceed the fixed value. Permissive approach assumes “innocent until proven guilty beyond reasonable doubt”, i. e. it seeks 95% confidence that the fixed value has been exceeded, before it is classed as having been exceeded. Transgression once the lower confidence limit (LCL) exceeds the fixed value.
 Approach 1: ignore uncertainty in the test measurement n Result compared directly with the MAV. n No attempt is made to take the UOM into account. n eg a result for lead in DW of 0. 012 mg/L is a transgression, because it exceeds the MAV of 0. 01 mg/L. n This approach relies on the balance of probabilities, taking an even -handed approach to swings and roundabouts for fairness. n When the measured value is just above a MAV, there is about a 50: 50 chance that the true value is below, or above, it. Result MAV = Transgression A major advantage of the approach is its simplicity.
 n Compare test results with MAVs using the") Approach 2: round down (or up) n Compare test results with MAVs using the same number of significant numbers n eg the test result for lead of 0. 012 mg/L can be rounded down to 0. 01 mg/L, which is not greater than 0. 01, so it is not a transgression. This is effectively a permissive approach. n ie the result has to be some way over 0. 01 mg/L before it fails the MAV. n eg a lead result of 0. 0149 mg/L in this approach would comply with a 0. 01 mg/L MAV, despite being 49% greater than the MAV. A result of 0. 0151 mg/L would be a transgression. Rounded result Does not exceed MAV No transgression This rounding approach also ignores UOM
Approach 2: round down (or up) n Compare test results with MAVs using the same number of significant numbers n eg the test result for lead of 0. 012 mg/L can be rounded down to 0. 01 mg/L, which is not greater than 0. 01, so it is not a transgression. This is effectively a permissive approach. n ie the result has to be some way over 0. 01 mg/L before it fails the MAV. n eg a lead result of 0. 0149 mg/L in this approach would comply with a 0. 01 mg/L MAV, despite being 49% greater than the MAV. A result of 0. 0151 mg/L would be a transgression. Rounded result Does not exceed MAV No transgression This rounding approach also ignores UOM
 Approach 3: accept uncertainty in the test measurement n n Requires either the upper (Result + UOM) or lower (Result – UOM) one-sided 95% confidence limit to be calculated. Considering a measured lead concentration of 0. 012± 0. 0023 mg/L for potable water (a) precautionary Compare UCL with MAV UCL = 0. 012+0. 0023 = 0. 0143 mg/L. A transgression, as UCL > MAV (0. 01 mg/L) (b) permissive Compare LCL with MAV; LCL = 0. 012 -0. 0023 = 0. 0097 m g/L. Not a transgression, as LCL < MAV (0. 01 m g/L).
 Effect of Different Approaches NZDWS – Lead MAV 0. 01 UOM Result 0. 012 0. 0023 Approach 1 (Direct compare) 0. 012 > 0. 01 Transgression Approach 2 (Round) 0. 01 vs 0. 01 OK 0. 012+0. 0023 = 0. 0143 Transgression 0. 01 -0. 0023 = 0. 0097 OK Approach 3 (Precautionary) Approach 3 (Permissive)
 Effect of Different Approaches Subdivisions vs NES - Lead SGV 160 UOM Result 165 22 165>160 Over limit 160 vs 160 OK Approach 3 (Precautionary) 165+22 = 182 Over limit Approach 3 (Permissive) 165 -22 = 143 OK Approach 1 (Direct compare) Approach 2 (Round)
 Effect of Different Approaches Fertilising Farms vs Cd Guidelines Tier 1 Limit 0. 6 UOM Result 0. 64 0. 066 Approach 1 (Direct compare) 0. 64>0. 6 Over limit Approach 2 (Round) 0. 6 vs 0. 6 OK Approach 3 (Precautionary) 0. 64+0. 066 = 0. 706 Over limit Approach 3 (Permissive) 0. 64 -0. 066 = 0. 574 OK
 Effect of Different Approaches Subdivision water vs NZDWS – NO 3 N MAV 11. 2 UOM Result 11. 0 1. 3 11. 0 < 11. 2 OK 11 vs 11 OK 11. 0+1. 3 = 12. 3 Over limit 11. 0 -1. 3 = 9. 7 OK Approach 1 (Direct compare) Approach 2 (Round) Approach 3 (Precautionary) Approach 3 (Permissive)
 Effect of Different Approaches Tradewaste Discharge Consent - DRP Consent Limit 5 UOM 4. 12 0. 6 Approach 1 (Direct compare) 4. 12<5 OK Approach 2 (Round) 4 vs 5 OK Approach 3 (Precautionary) 4. 12+0. 6 = 4. 72 OK Approach 3 (Permissive) 4. 12 -0. 6 = 3. 52 OK Result
 Effect of Different Approaches Freshwater vs National Bottom Line - TN National Bottom Line (NBL) 0. 75 UOM Result 0. 8 0. 1 Approach 1 (Direct compare) 0. 8>0. 75 “D” grade Approach 2 (Round down) 0. 8 vs 0. 7 “D” grade Approach 3 (Precautionary) 0. 8+0. 1 = 0. 9 “D” grade Approach 3 (Permissive) 0. 8 -0. 1 = 0. 7 “C” Grade
 Conclusions n n n Every test result has a UOM The UOM should be considered when comparing result with guideline Test results may depend on the laboratory method used The approach to use should be documented Specify on-going monitoring if result > ½ guideline? “Approach 2 – Precautionary” preferred for environmental uses?

 UOM n Uncertainty of Measurement n Must understand UOM to interpret results n Labs can report UOM n What causes UOM? n Purity of standard eg 99. 9% = 0. 1% ‘uncertainty’ n Calibration of instruments eg weigh 100 mg +/- 0. 1 mg = 0. 1% uncetainty n Uncertainties are additive n Most tests 10 -20% UOM for 95% coverage
 UOM
UOM
 UOM in a Report

 Auckland University n 7 years medical") Brief Bio – Peter Robinson n Ph. D(Chemistry) Auckland University n 7 years medical research, Auckland, Cardiff n 15 years at Wintec, Hamilton (Analytical and Organic Chemistry, Biochemistry, Pharmacology) n 22+ years Hill Labs, Hamilton (Now mainly technical advice to clients and in-house, report signing, quotes, etc. Seminars for clients) n Co-Founder NZ Chromatography Group (1973) n Honorary Lecturer Waikato University (2004 -2013) and Wintec (1993 -2013) n Technical Assessor IANZ, NATA n Other interests: Tree Crops, Rainwater Harvesting, Sport
Brief Bio – Peter Robinson n Ph. D(Chemistry) Auckland University n 7 years medical research, Auckland, Cardiff n 15 years at Wintec, Hamilton (Analytical and Organic Chemistry, Biochemistry, Pharmacology) n 22+ years Hill Labs, Hamilton (Now mainly technical advice to clients and in-house, report signing, quotes, etc. Seminars for clients) n Co-Founder NZ Chromatography Group (1973) n Honorary Lecturer Waikato University (2004 -2013) and Wintec (1993 -2013) n Technical Assessor IANZ, NATA n Other interests: Tree Crops, Rainwater Harvesting, Sport
 Abstract: So you are over the limit? Or are you? Peter Robinson Hill Laboratories, Hamilton, NZ You are subdividing an old orchard. The NES has an SGV for lead of 160 mg/kg (Lifestyle/25% home grown produce). A value of 165 is obviously over the limit. Remediation is required. Your high country sheep and beef farm has just had the soil tested. The new Cadmium Guideline has a Tier 1 limit of 0. 6 mg/kg. A result of 0. 59 is obviously under the limit. Unfettered use of any preferred fertiliser can continue. The Resource Consent states “The five day biochemical oxygen demand (BOD 5) shall not exceed 10 grams per cubic metre”. Your result for TBOD 5 is 12. B. . . . You have put in a new housing development, with its own private water supply. The test result comes back at 11. 1. mg/L for nitrate-N. The MAV is 11. 2. Great, sales can proceed. The National Policy Statement for Freshwater Management (2014) states a National Bottom Line of 0. 75 mg/L for Total N in a lake. Your result of 0. 8 means the lake has a “D” Attribute, arousing public outrage. Every day laboratories produce thousands of results. Others compare these results with “Guidelines” or “Standards” and make (sometimes expensive) decisions based on this. But the results produced are subject to an “Uncertainty of Measurement (UOM)”, and will depend on the method used to produce them. Which may be different to the method used to set the guideline. Some real-life examples will be discussed, along with options for how comparisons of Guidelines with laboratory data may be approached.