a57bb01e6d75444f99fa7f508e5de307.ppt
- Количество слайдов: 56


 A DANSE Subproject DANSE Kick-Off meeting Aug 15 -16")
Small Angle Neutron Scattering (SANS) A DANSE Subproject DANSE Kick-Off meeting Aug 15 -16 Pasadena CA Paul Butler

SANS measures time averaged structure of 1 – 300 nm or more • Mesoporous structures • Biological structures (membranes, vesicles, proteins in solution) • Polymers • Colloids and surfactants • Magnetic films and nanoparticles • Voids and Precipitates

Anatomy of a SANS instrument Sizes of interest = “large scale structures” = 1 – 300 nm or more 0. 02 < Q ~ 2 /d < 6 Q=4 sin / 3 -5< <20 A and 0. 1 < <20 64 Beam attenutator Neutron Guide 2 D detector cm -1 m Velocity selector L 1 Source Aperture, A 1 sample Sample Aperture, A 2 L 2 20 – 40 k pixels
 Scattering from sample 2) Scattering from")
Sample Scattering • Contribution to detector counts 1) Scattering from sample 2) Scattering from other than sample (neutrons still go through sample) 3) Stray neutrons and electronic noise (neutrons don’t go through sample) aperture Incident beam sample air cell Stray neutrons and Electronic noise Imeas(i) = Φ t A ε(i) ΔΩ Tc+s[(dΣ/dΩ)s(i) ds + (dΣ/dΩ)c(i) dc] +Ibgd t
 Macromolecular structures: polymers, micelles, complex fluids, precipitates, porous media,")
Small Angle Neutron Scattering (SANS) Macromolecular structures: polymers, micelles, complex fluids, precipitates, porous media, fractal structures Measure: Scattered Intensity => Macroscopic cross section = (Scattered intensity(Q) / Incident intensity) T d |3 -D Fourier Transform of scattering contrast|2 normalized to sample scattering volume Reciprocity in diffraction: Fourier features at QS => size d ~ 2 /QS Intensity at smaller QS (angle) => larger structures Slide Courtesy of William A. Hamilton

Uniqueness of models

SANS Model Independent Concepts At large q: S/V = specific surface are 10 % black 90 % white
 = Structure factor (interactions or correlations) or Fourier transform")
SANS more detailed analysis S(Q) = Structure factor (interactions or correlations) or Fourier transform of g(r) 1 P(Q) = form factor (shape) Q
 Fourier transform r Shape reconstruction (ab initio)")
Frequency Paid Distance Distribution Function PDDF P(r) Fourier transform r Shape reconstruction (ab initio)

So. . SANS DATA Analysis. . Let’s DANSE At the same time we want: Analytic form Modeling Free form modeling Structural modeling • Add constraints • In 2 D. . For oriented objects • Optimization with data based on some set of parameters • Non particulate (i. e no P(Q) and S(Q) separation (e. g. Sponge) • G(r) (interactions) – allowing easy input of new ones important • Complicated additions based on specific model (e. g. waters of hydration , exchangeable protons • Conformational or other search • MC and MD ↔ I(Q) • Time resolved (and other parametric studies AND (of course) Intuitive and easy to use and extend Graphical interface with full 3 D visualization Preferably with automated guidance and idiot guards …. Fast (interactive as much as possible)

Choices for Today’s user I Get software from somewhere: • IGOR macro package distributed from NIST (latest release last month) • Grasp distributed by ILL (reduction mainly but used for vortex lattices) • ATSAS 2. 1 distributed by Dimitri Svergun EMBL (latest release this year) • An eclectic array of routines available from various sources (ISIS maintains a site) II “Do-it yourself” (mostly command line fortran – barrier to doing new stuff) III Minimal Analysis (bigger, smaller, slope of xxx …. fractal? ) Data taken on NG 7 6/7/2000 Fit using Core + shell sphere model 1/cm 1 0. 01 9 2 3 4 5 6 7 8 9 2 3

Steps to the DANSE 1. Analytical model fits to 2 D data sets and model independent fits 1. Include orientation with respect to beam 2. Include instrument resolution 3. Include orientation and resolution corrections 4. Include parametric analysis and simultaneous fitting 5. Include intelligent defaults and intelligent help 2. Ab initio (free form) modeling and P(R) 1. include most popular approaches (dummy atom, spherical harmonics, etc) 2. Include intelligent help, and defaults 3. Include “limit switches” 3. Modeling of arbitrary shapes (including inversion to P(R)) 1. 3 D model building from simple shapes 2. Coarse grain PDB file 3. Invert real space model to I(Q) 4. MC and MD simulations for complex interacting systems 5. Refinements based on constraints 4. Full instrument simulation with plug in sample for experimental planning

First step

DANSE card I NIST and ORNL heavily involved -- Fall meeting planned to determine: • Short term plan for collaboration and distribution of analysis software • How to structure the short term plan to take advantage of DANSE components as soon as they become available • Plan for smooth long term transition to new system • Some questions: How do we co-ordinate with ATSAS, how to incorporate X-ray, is PDB sufficient or do we need a second “standard” II Other interested facilities • US • Los Alamos and IPNS • International SANS instrument scientists interested: • ILL • ISIS • ANSTO • HANARO III First contacts with most well known SANS algorithm developers • Svergun • Glatter • Pederson

When the Music Stops: Beyond DANSE The goal is NOT software - it is to extract all possible information from the material being studied. Neutron scattering from the user’s point of view is a process in which the sample is placed in the machine and the relevant, meaningful information comes out the other end. Good software enables that process. The DANSE project is not the end but the beginning. It cannot deliver everything. Rather it must meet two objectives: 1. Provide baseline software that includes: 1. A library of well documented and tested re-usable components 2. Basic applications with sufficient new value to attract large numbers of users 3. A new vision of ease of use as a means of fully utilizing the heavy invetsments in hardware • For success must do 3 things: • • • Must provide everything that is commonly doable with today’s packages Must provide new functionality not commonly available with today’s packages Must provide an easy framework for extension and contribution by the community

THE END
")
Steps to the DANSE (I)

An application for protein conformational study by SANS • Have been told the need of such program more than a year ago • Two study cases: – domain hinge movement of yeast guanylate kinase from unligated to GMP binded – The inconsistence between the crystal structure and SANS data of a protein

• Protein motions – http: //molmovdb. mbb. yale. edu/molmovdb/ • SANS is a unique technique for domain orientations, conformational changes and/or flexibility under near physiological conditions • Software for shape determination (including sophiscated method to retrieve complexed shape using sphere harmonics and debye formula) from SANS data – Over-interpretation? Fact: extract 3 D data from 1 D data • Major mechanisms of motions are “hinge” and “shear” • By directly starting from high-resolution structures and moving the subunit (hinge or shear) with subunits’ structure restrained, we can reduce the ambiguity and study the conformational changes – Expanding PDB data bank with atomic-resolution structures – Available software to link high-resolution structures to SANS data • There is no such tool that allows users easily manipulate protein’s conformation through interactive way and link the conformations
 and")
• Testing files for each components (tested both C and Python codes) and a simple GUI application
:")
Working Progress • Package SANSsimulation – Available components (for sphere and hollow sphere only): • analmodelpy: new_analmodel(), calculate. IQ() • pointsmodelpy: new_loresmodel(), fillpoints(), distribution(), calculate. IQ • geoshapespy: new_sphere(), new_hollowsphere() • iqpy: new_iq(), output. IQ()

Class Diagram

Required components

Budget profile SANS

UML Use Cases for SANS Simulate <extend> Analytic form Modeling d> xt en <e <e User xte nd > d> en xt <e Reduce Structural modeling Analysis <extend> Free form modeling
:")
Staffing plans SANS + QA SANS: Project Leader: Paul Butler Postdoc 1 (Current developer): Jing Zhou Postdoc 2 : start hiring process during first year to bring on board in year 2 Grad Stud 1: UMBC – eventually working with UT Biochemistry department and SNS/CSMB Tennessee FTE by Resource Type 7. 00 6. 00 5. 00 4. 00 3. 00 2. 00 1. 00 0. 00 year 1 year 2 year 3 year 4 year 5 Postdoc Tech Writer Grad Student Undergrad Other Administrative Support Minority Student Quality Assurance
 SNS Laptop SNS Archive Ne. Xus Linux Cluster gnw(E)")
UML Activity Diagram (w/o start-stop) SNS Laptop SNS Archive Ne. Xus Linux Cluster gnw(E) {C 1 XX’, . . . } reduction Bv. K d /d. W (Q) s/M |QU exp(i. Qr) |2 Compare, Alter (C 1 XX, . . } g(E) phononthermo. py Z, F, S

What we plan to do II Build Executive level application Data manager Parametric series manager Executive level: Data manager Parametric series manager Data Reduction Analytic forms Ab initio modeling “modeling” Instrument simulation NEW Packages
")
Application Specification (from PEP)

Specular Neutron Reflection Measure: Reflection Coefficient = Specularly reflected intensity / Incident intensity Layered structures or correlations relative to a flat interface: Polymeric, semiconductor and metallic films and multilayers, adsorbed surface structures and complex fluid correlations at solid or free surfaces |1 -D FT of depth derivative of scattering contrast|2 / Q R 4 Similar to SANS but. . . This is only an approximation valid at large Q R of an Optical transform - refraction happens At lower Q R, R reaches its maximum R=1 i. e. total reflection Slide Courtesy of William A. Hamilton

Specular Reflectivity vs. Scattering length density profiles T sld step a Thin film QR=2 /T Critical edge R=1 for QR<QC QC=4( )1/2 Fresnel reflectivity Slide Courtesy of William A. Hamilton Thin film Interference fringes Fourier features (as per SANS) Multilayer QR=2 /a Bragg peak

Sizes of interest = “large scale structures” = 1 – 300 nm or more 0. 02 < Q ~ 2 /d < 6 Q=4 sin / Cold source spectrum 3 -5< <20 A small θ … how Approaches to small θ: • Small detector resolution/Small slit (sample? ) size • Large collimation distance Intensity balance sample size with instrument length

Sizes of interest = “large scale structures” = 1 – 300 nm or more k. S QS SANS Approach ki S 1 ≈ 2θ 2 S 2 Δθ 3 m – 16 m 1 m – 15 m SSD ≈ SDD Optimized for ~ ½ - ¾ inch diameter sample

Sizes of interest = “large scale structures” = 1 – 300 nm or more NR Approach Point by point scan Q R ki k. R Ls ? ? = Ls sinθ ? ~ 1 mm for low Q θ

Sizes of interest = “large scale structures” = 1 – 300 nm or more Ultra Small Angle Approach – when SANS isn’t small enough QS k. S ki Point by point scan - again Fundamental Rule: intensity OR resolution … but not both

i Rocking Curve i fixed, 2 f varying Imeas = Φ A ε t R +Ibgd t 2 f Specular Scan 2 f = 2 I f = i Background Scan f ≠ I

When measuring a gold layer on a Silicon substrate for example, many reflectometers can go to Q > 0. 4 Å-1 and reflectivities of nearly 10 -8. However most films measured at the solid solution interface only get to 10 -5 and a Qmax of ~ 0. 25Å-1 Why might this be and what might be done about it. (hint: think of sources of background) SANS is a transmission mode measurement, so with an infinitely thick sample the transmission will be zero and thus no scattering can be measured. If the sample is infinitely thin, there is nothing to scatter from…. So what thickness is best? (hint: look at the Imeas equation) For a strong scatterer, a large fraction of the beam is coherently scattered. This is good for signal but how might it be a problem? (hint: think of the scattering from the back or downstream side of the sample)

USANS gets to very small angle. However SANS is a long instrument in order to reach small angles. Why not make the instrument longer? (Hint: particle or wave? ) Given the SANS pattern on the right, how can know what Q to associate with each pixel? (hint use geometry and the definition for Q) NR and SANS measure structures in the direction of Q. Given the NR Q is in the z direction, can NR be used to measure the average diameter of the spherically symmetric object floating randomly below the interface? ki Q R D k. R

Beam attenutator Neutron Guide 2 D detector Velocity selector L 1 Source Aperture, A 1 sample L 2 Sample Aperture, A 2

Neutron Scattering 102: SANS and NR Paul Butler Pre-requisites: • Fundamentals of neutron scattering 100 • Neutron diffraction 101 • Nobel Prize in physics Grade based on attendance and participation

SANS and NR assume elastic scattering SANS and NR measures interference patterns from structures in the direction of Q f = i = R ki i Q R f Neutron Reflectometry (NR) Reflection mode ki incident beam wavevector |ki|=2 / QS k. R = ki+Q R 2 R Q R =4 sin R / Perpendicular to surface 2 s k. S = ki+Qs Qs=|Qs|=4 sin s / scattered beam wavevector |k. S|=2 / Small Angle Neutron Scattering (SANS) Transmission mode
 Scattering from sample 2) Scattering from")
Sample Scattering • Contribution to detector counts 1) Scattering from sample 2) Scattering from other than sample (neutrons still go through sample) 3) Stray neutrons and electronic noise (neutrons don’t go through sample) aperture Incident beam sample air cell Stray neutrons and Electronic noise • We need MORE measurements

Summary • SANS and NR measure structures in the direction of Q only • SANS and NR assume elastic scattering • SANS is a transmission technique that measures the average structures in the volume probed • NR is a reflection technique that measures the z (depth) density profile of structures strongly correlated to the reflection interface Thinking aids: SANS Imeas(i) = Φ t A ε(i) ΔΩ Tc+s[(dΣ/dΩ)s(i) ds + (dΣ/dΩ)c(i) dc] +Ibgd t NR Imeas = Φ A ε t R +Ibgd t

A VISION Rg = 31Å MA NC CA image constraints High resolution structure Protein Data Bank

When life is easy

When life is easy Data taken on NG 7 6/7/2000 Fit using Core + shell sphere model 1/cm 1 0. 01 9 0. 01 2 3 4 5 6 7 8 9 0. 1 1/Å smear_parameters_css smear_coef_css W_sigma scale 0. 01 0 core radius (A) 43. 8081 0. 130794 shell thickness (A) 18. 2979 0. 190327 Core SLD (A-2) 6. 15162 e-06 1. 80823 e-05 Shell SLD (A-2) 3. 14889 e-06 1. 80825 e-05 Solvent SLD (A-2) 6. 26021 e-06 1. 80778 e-05 bkg (cm-1) 0. 00627994 0. 00012066 2 3

L 3 “c” L R =0. 40 0. 08 s R = C exp[-EF/k. BT] EF = 6. 7 k. BT (170 me. V) PRL 2004

Beyond the Sponge to Lamellar Transition. A Lamellar Collapse: (when life starts to get really hard) z x is g hin et till s ing iss m Structural analysis of a 4% Lamellar at 1500 s-1 Simultaneous fits SLD, bgd, membrane thickness fixed om S Model: polydisperse aligned prolate ellipsoidal shells (vesicles) Qx semi-major axis ~ 520Å along flow direction Qz semi-minor axis ~ 225Å

SANS: a plan Project Leader: Paul Butler Advisors: Sean Langridge, Dean Myles Postdoc 1: (Current developer): Jing Zhou Start hiring process in middle of first year to bring on board in year 2 Grad Students: UMBC and UT Work with ORNL’s CSMB and SANS team Work with NIST SANS team and Structural bio group Plans for international steering committee Post. Doc and other developer FTE by year Total Funding Profile 7. 00 $1, 400 6. 00 $1, 200 $1, 000 5. 00 $800 4. 00 $600 3. 00 $400 2. 00 $200 1. 00 $year 1 year 2 year 3 year 4 year 5 0. 00 year 1 Incremental Funding Profile Cumulative year 2 year 3 year 4 year 5

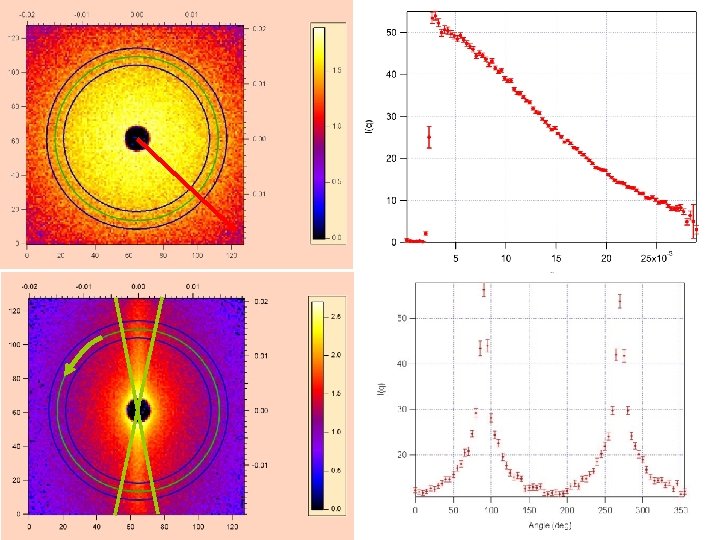
When life starts to get hard Clay polymer gels under shear Clay polymer gels at rest
 Fourier transform r I(Q)")
How does one really calculate a theoretical Intensity Frequency P(r) Fourier transform r I(Q)

User-interactive GUI application • Link the conformational changes to SANS data – Example – showing the I(Q) for the corresponding conformation in Runtime • Mouse click to move selected subunit – VMD provide shear movement but no hinge movement • Plan: start with the existing codes which uses VTK to load PDB files into 3 D graphics and move models around – Other requirements: program CRYSON or XTAL 2 SAS and a 2 D plotter • Immediate usage at NIST • Future distribution for broad users

Motivation: Structural studies of protein and nucleic acid complexes in solution CRP protein (yellow ribbon) and the DNA (blue spheres) Krueger et al. , Biochemistry, 47(7), 1958 -1968, 2003

UML Use Cases for SANS e lud > Simulate xte <e c <in <e nd Plan Experiment nd > xt <e Reduce en d > > Analytic form Modeling < User Analysis xte e n d> <extend> Structural modeling Free form modeling
a57bb01e6d75444f99fa7f508e5de307.ppt