b691ffa6c6b68cb6a1fa2a51e85f5bb0.ppt
- Количество слайдов: 70
 Simulating Oracle I/O Workloads to Configure Storage James F. Koopmann No. COUG Fall Conference 2007 4: 00 – 5: 00
 Who am I You fill in the blank ___________
 Who am I Thanks James, the world is made a better place because of the generosity of people like you who are willing to share knowledge. Great effort !
 Introduction § When you think of storage, what do you think of – Do I have enough? § How do you determine what storage to buy? – Just enough to hold data § Do you use iostat or another I/O utility? – What do you do to fix I/O issues? • • Tune SQL? Purchase more CPU Add more Memory Move datafiles around
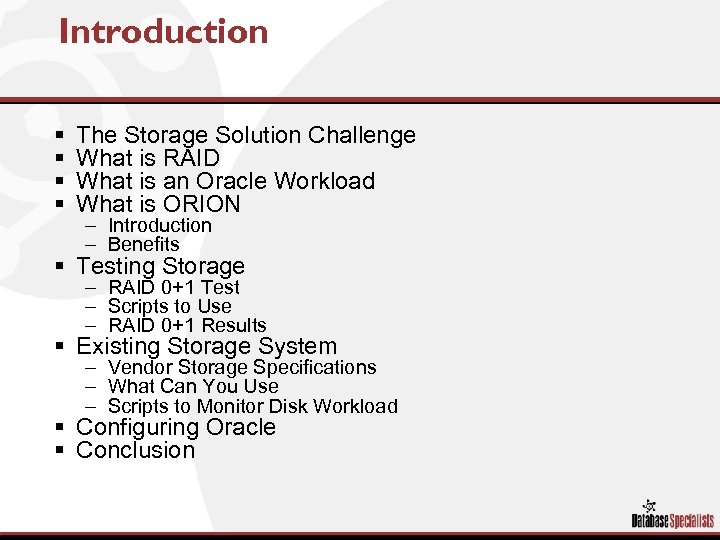 Introduction § § The Storage Solution Challenge What is RAID What is an Oracle Workload What is ORION – Introduction – Benefits § Testing Storage – RAID 0+1 Test – Scripts to Use – RAID 0+1 Results § Existing Storage System – Vendor Storage Specifications – What Can You Use – Scripts to Monitor Disk Workload § Configuring Oracle § Conclusion
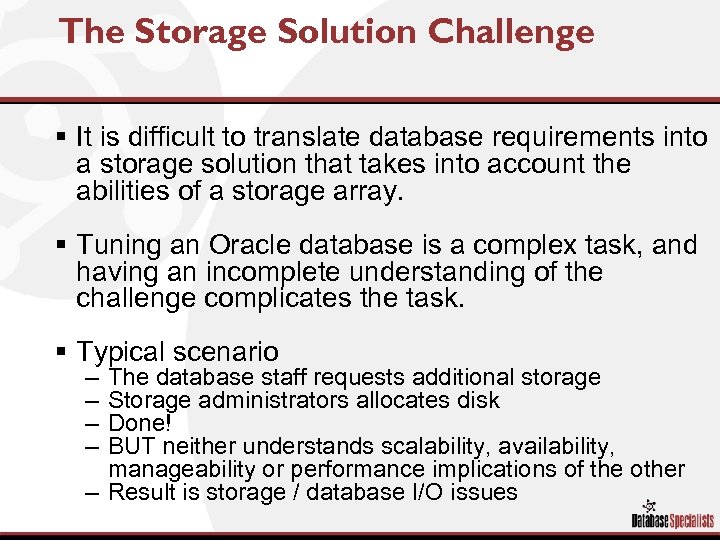 The Storage Solution Challenge § It is difficult to translate database requirements into a storage solution that takes into account the abilities of a storage array. § Tuning an Oracle database is a complex task, and having an incomplete understanding of the challenge complicates the task. § Typical scenario – – The database staff requests additional storage Storage administrators allocates disk Done! BUT neither understands scalability, availability, manageability or performance implications of the other – Result is storage / database I/O issues
 RAID Basics
 RAID Basics § Redundant Array of Independent Disks – Provides fault tolerance (redundancy) – Why Use RAID? – Improves access rates • • What? ? Does it make my disks faster? NO! Data is striped (spread) across multiple drives and allows concurrent I/O operations such that it appears to make disks operate faster – RAID Levels • 0, 1, 2, 3, 4, 5, 10, 50, 0+1, 1+0…. . • RAID Level is a critical component for protecting data and improving application performance. • Selecting the proper RAID level for a specific application requires thoughtful contemplation AND TESTING/BENCHMARKING.
 RAID Basics RAID Level 0 - Striping http: //www. lsi. com/insight_center/industry_standards/storage_connectivity/raid/index. html
 RAID Basics RAID Level 1 - Mirroring http: //www. lsi. com/insight_center/industry_standards/storage_connectivity/raid/index. html
 RAID Basics RAID Level 0+1 - Striping and Mirroring http: //www. lsi. com/insight_center/industry_standards/storage_connectivity/raid/index. html
 RAID Basics RAID Level 5 - Striping w/Rotational Parity http: //www. lsi. com/insight_center/industry_standards/storage_connectivity/raid/index. html
 Determining the Application Mix Key to Configuring Storage
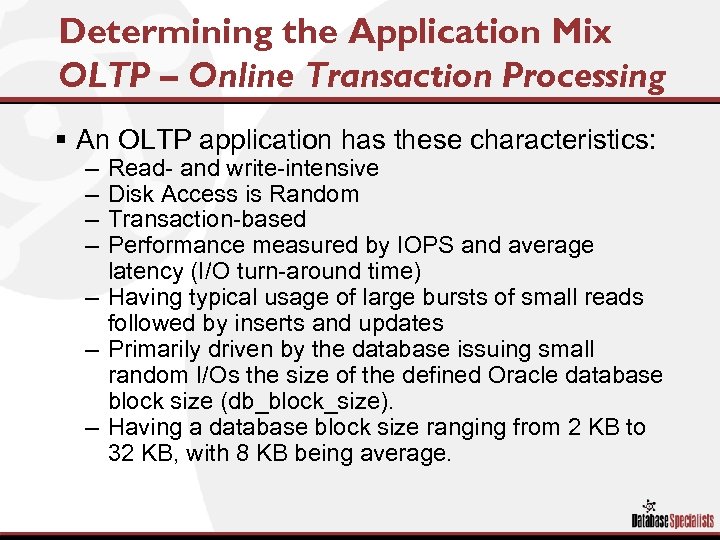 Determining the Application Mix OLTP – Online Transaction Processing § An OLTP application has these characteristics: – – Read- and write-intensive Disk Access is Random Transaction-based Performance measured by IOPS and average latency (I/O turn-around time) – Having typical usage of large bursts of small reads followed by inserts and updates – Primarily driven by the database issuing small random I/Os the size of the defined Oracle database block size (db_block_size). – Having a database block size ranging from 2 KB to 32 KB, with 8 KB being average.
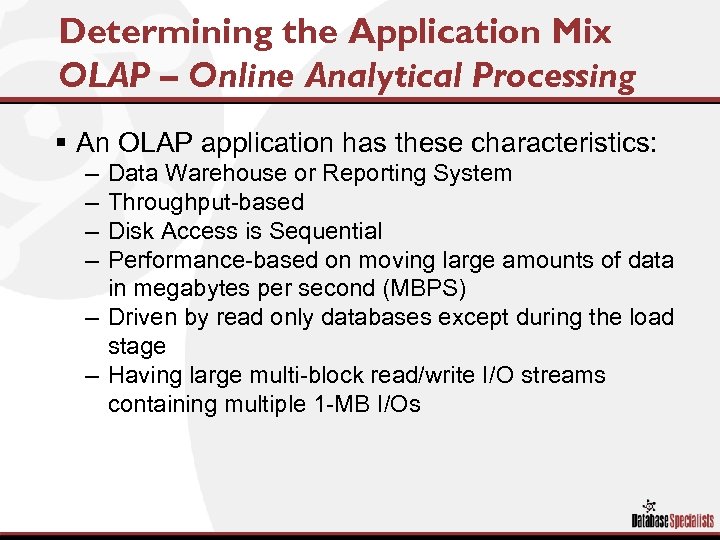 Determining the Application Mix OLAP – Online Analytical Processing § An OLAP application has these characteristics: – – Data Warehouse or Reporting System Throughput-based Disk Access is Sequential Performance-based on moving large amounts of data in megabytes per second (MBPS) – Driven by read only databases except during the load stage – Having large multi-block read/write I/O streams containing multiple 1 -MB I/Os
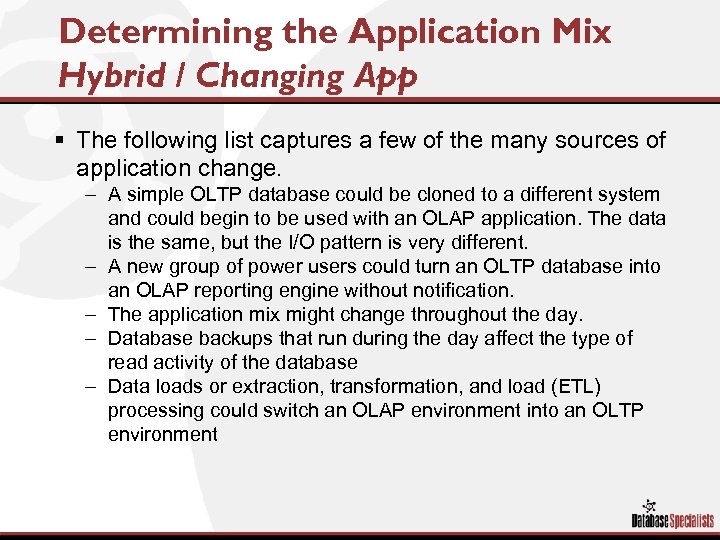 Determining the Application Mix Hybrid / Changing App § The following list captures a few of the many sources of application change. – A simple OLTP database could be cloned to a different system and could begin to be used with an OLAP application. The data is the same, but the I/O pattern is very different. – A new group of power users could turn an OLTP database into an OLAP reporting engine without notification. – The application mix might change throughout the day. – Database backups that run during the day affect the type of read activity of the database – Data loads or extraction, transformation, and load (ETL) processing could switch an OLAP environment into an OLTP environment
 Determining the Application Mix Determining the Oracle Workload Application Mix = Workload
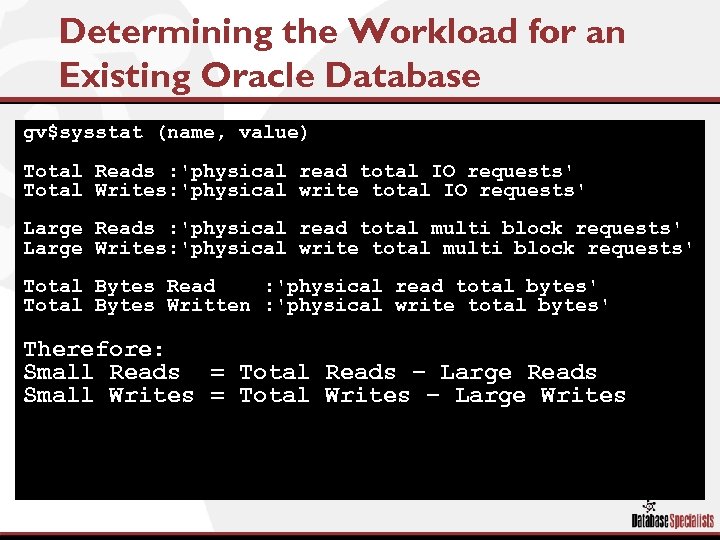 Determining the Workload for an Existing Oracle Database gv$sysstat (name, value) Total Reads : 'physical read total IO requests' Total Writes: 'physical write total IO requests' Large Reads : 'physical read total multi block requests' Large Writes: 'physical write total multi block requests' Total Bytes Read : 'physical read total bytes' Total Bytes Written : 'physical write total bytes' Therefore: Small Reads = Total Reads – Large Reads Small Writes = Total Writes – Large Writes
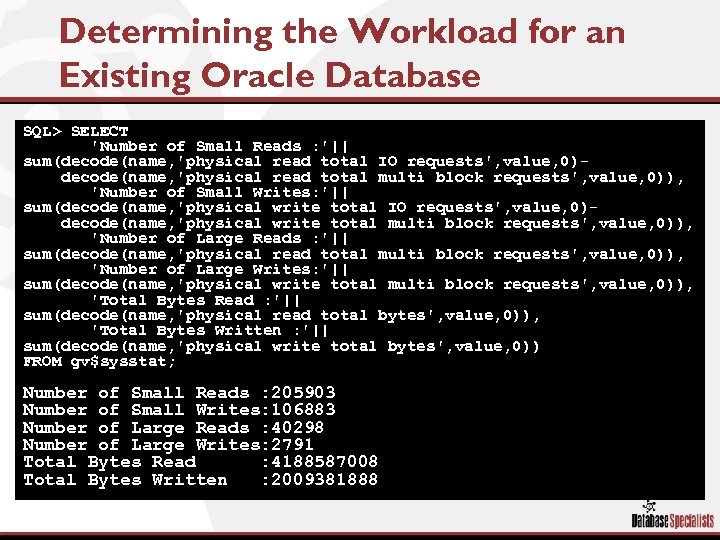 Determining the Workload for an Existing Oracle Database SQL> SELECT 'Number of Small Reads : '|| sum(decode(name, 'physical read total IO requests', value, 0)decode(name, 'physical read total multi block requests', value, 0)), 'Number of Small Writes: '|| sum(decode(name, 'physical write total IO requests', value, 0)decode(name, 'physical write total multi block requests', value, 0)), 'Number of Large Reads : '|| sum(decode(name, 'physical read total multi block requests', value, 0)), 'Number of Large Writes: '|| sum(decode(name, 'physical write total multi block requests', value, 0)), 'Total Bytes Read : '|| sum(decode(name, 'physical read total bytes', value, 0)), 'Total Bytes Written : '|| sum(decode(name, 'physical write total bytes', value, 0)) FROM gv$sysstat; Number of Small Reads : 205903 Number of Small Writes: 106883 Number of Large Reads : 40298 Number of Large Writes: 2791 Total Bytes Read : 4188587008 Total Bytes Written : 2009381888
 Determining the Workload for an Existing Oracle Database Wait 10 Minutes
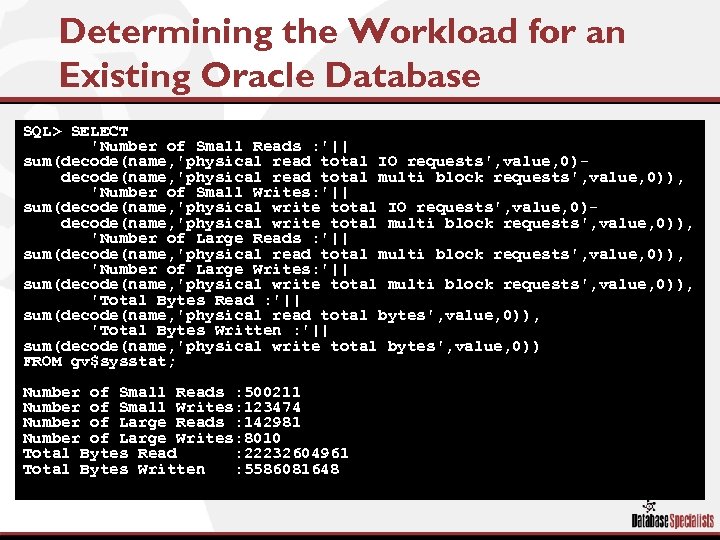 Determining the Workload for an Existing Oracle Database SQL> SELECT 'Number of Small Reads : '|| sum(decode(name, 'physical read total IO requests', value, 0)decode(name, 'physical read total multi block requests', value, 0)), 'Number of Small Writes: '|| sum(decode(name, 'physical write total IO requests', value, 0)decode(name, 'physical write total multi block requests', value, 0)), 'Number of Large Reads : '|| sum(decode(name, 'physical read total multi block requests', value, 0)), 'Number of Large Writes: '|| sum(decode(name, 'physical write total multi block requests', value, 0)), 'Total Bytes Read : '|| sum(decode(name, 'physical read total bytes', value, 0)), 'Total Bytes Written : '|| sum(decode(name, 'physical write total bytes', value, 0)) FROM gv$sysstat; Number of Small Reads : 500211 Number of Small Writes: 123474 Number of Large Reads : 142981 Number of Large Writes: 8010 Total Bytes Read : 22232604961 Total Bytes Written : 5586081648
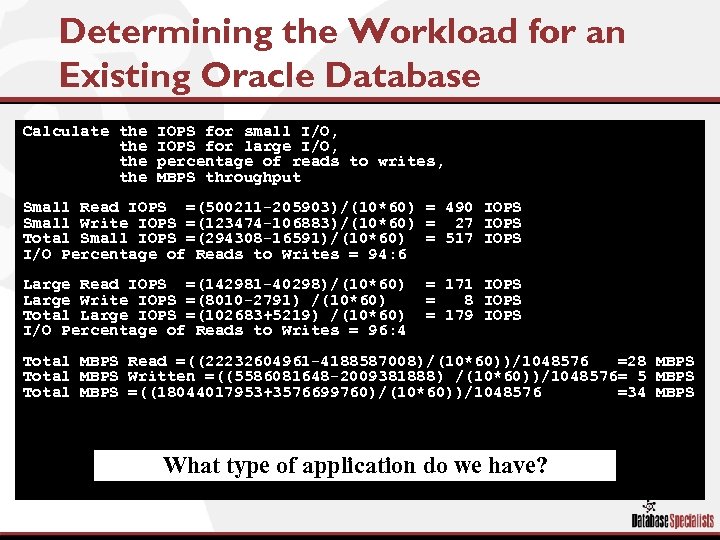 Determining the Workload for an Existing Oracle Database Calculate the the IOPS for small I/O, IOPS for large I/O, percentage of reads to writes, MBPS throughput Small Read IOPS =(500211 -205903)/(10*60) = 490 IOPS Small Write IOPS =(123474 -106883)/(10*60) = 27 IOPS Total Small IOPS =(294308 -16591)/(10*60) = 517 IOPS I/O Percentage of Reads to Writes = 94: 6 Large Read IOPS =(142981 -40298)/(10*60) Large Write IOPS =(8010 -2791) /(10*60) Total Large IOPS =(102683+5219) /(10*60) I/O Percentage of Reads to Writes = 96: 4 = 171 IOPS = 8 IOPS = 179 IOPS Total MBPS Read =((22232604961 -4188587008)/(10*60))/1048576 =28 MBPS Total MBPS Written =((5586081648 -2009381888) /(10*60))/1048576= 5 MBPS Total MBPS =((18044017953+3576699760)/(10*60))/1048576 =34 MBPS What type of application do we have?
 Introducing ORION Let the Benchmarking Begin
 Introducing ORION Oracle I/O Numbers § ORION is a configurable workload generating tool that mimics Oracle I/O without requiring installation of an Oracle database. § The ORION workload tool has a variety of options that enable storage architects to design an OLTP or OLAP workload that matches the expected transaction mixes. § Stresses a storage array and gives results that allows us to better understand storage configurations so that we can design storage to meet performance requirements.
 Introducing ORION Possible Tasks § § § § § Create benchmarks for specific application mixes Single-node tests Multi-node (RAC) tests Balancing disk drive layout against system workload Verifying performance levels for various I/O scenarios Revealing specific I/O benefits and deficiencies Configuring storage array before use Configuring storage before installing Oracle database Timely fixing of hardware flaws Comparing benchmarks across different storage products and configurations
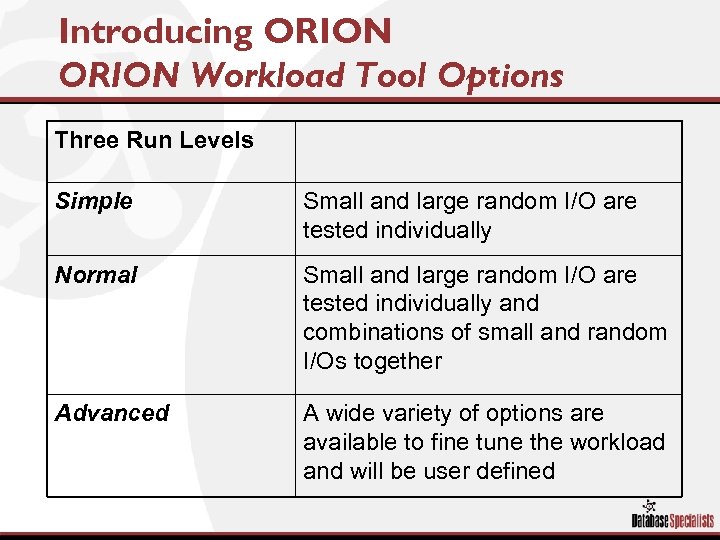 Introducing ORION Workload Tool Options Three Run Levels Simple Small and large random I/O are tested individually Normal Small and large random I/O are tested individually and combinations of small and random I/Os together Advanced A wide variety of options are available to fine tune the workload and will be user defined
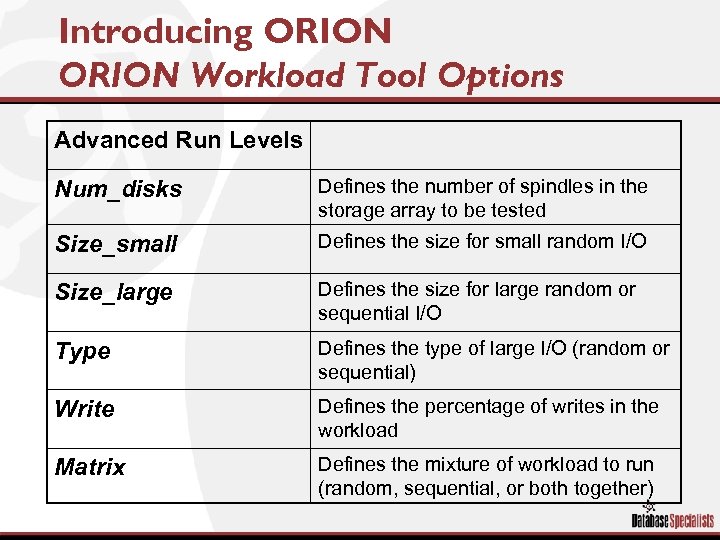 Introducing ORION Workload Tool Options Advanced Run Levels Num_disks Defines the number of spindles in the storage array to be tested Size_small Defines the size for small random I/O Size_large Defines the size for large random or sequential I/O Type Defines the type of large I/O (random or sequential) Write Defines the percentage of writes in the workload Matrix Defines the mixture of workload to run (random, sequential, or both together)
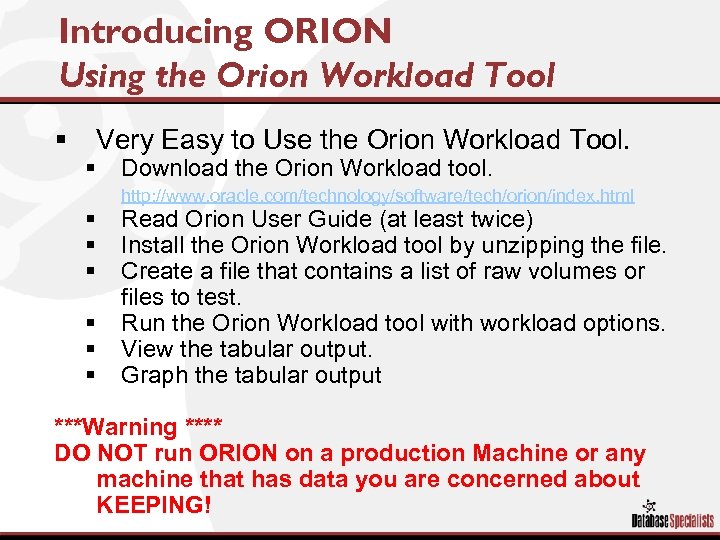 Introducing ORION Using the Orion Workload Tool § Very Easy to Use the Orion Workload Tool. § Download the Orion Workload tool. http: //www. oracle. com/technology/software/tech/orion/index. html § § § Read Orion User Guide (at least twice) Install the Orion Workload tool by unzipping the file. Create a file that contains a list of raw volumes or files to test. Run the Orion Workload tool with workload options. View the tabular output. Graph the tabular output ***Warning **** DO NOT run ORION on a production Machine or any machine that has data you are concerned about KEEPING!
 ORION Benchmarking In Practice
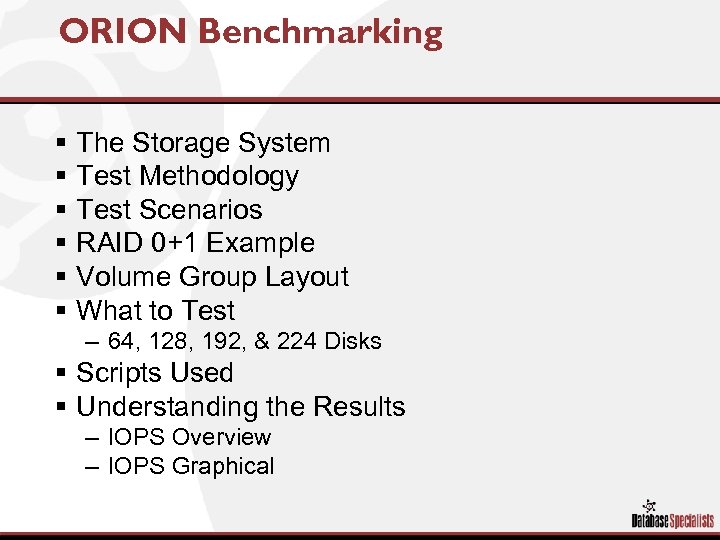 ORION Benchmarking § § § The Storage System Test Methodology Test Scenarios RAID 0+1 Example Volume Group Layout What to Test – 64, 128, 192, & 224 Disks § Scripts Used § Understanding the Results – IOPS Overview – IOPS Graphical
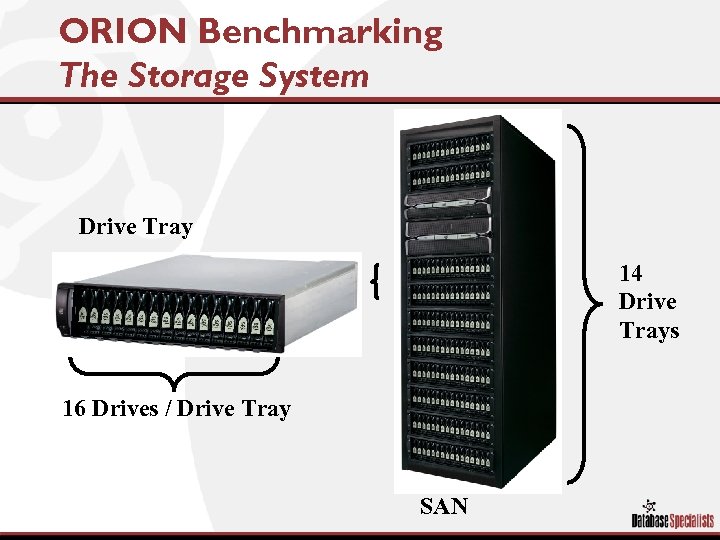 ORION Benchmarking The Storage System Drive Tray 14 Drive Trays 16 Drives / Drive Tray SAN
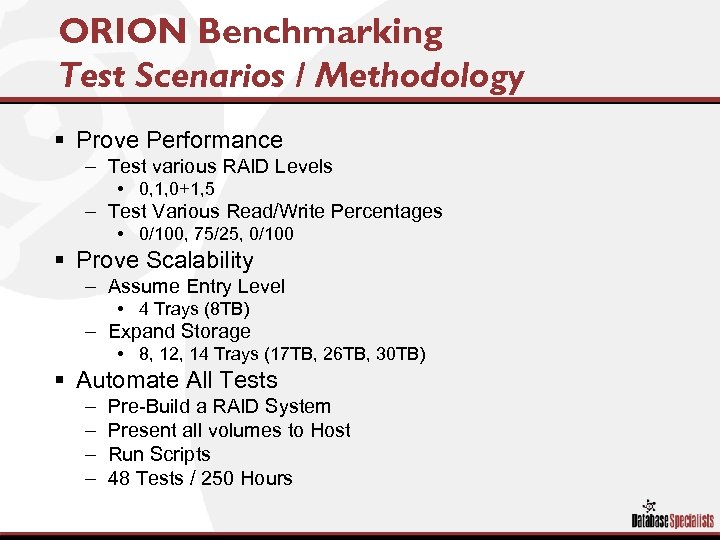 ORION Benchmarking Test Scenarios / Methodology § Prove Performance – Test various RAID Levels • 0, 1, 0+1, 5 – Test Various Read/Write Percentages • 0/100, 75/25, 0/100 § Prove Scalability – Assume Entry Level • 4 Trays (8 TB) – Expand Storage • 8, 12, 14 Trays (17 TB, 26 TB, 30 TB) § Automate All Tests – – Pre-Build a RAID System Present all volumes to Host Run Scripts 48 Tests / 250 Hours
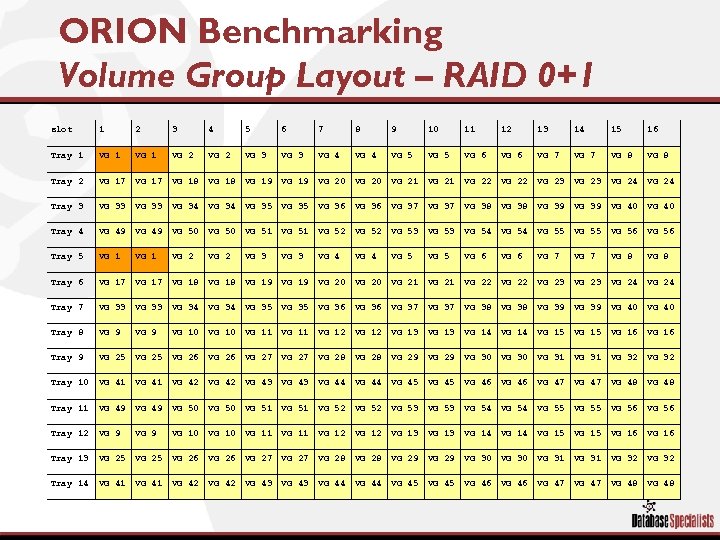 ORION Benchmarking Volume Group Layout – RAID 0+1 slot 1 2 3 4 5 6 7 8 9 10 11 12 13 14 15 16 Tray 1 VG 2 VG 3 VG 4 VG 5 VG 6 VG 7 VG 8 Tray 2 VG 17 VG 18 VG 19 VG 20 VG 21 VG 22 VG 23 VG 24 Tray 3 VG 33 VG 34 VG 35 VG 36 VG 37 VG 38 VG 39 VG 40 Tray 4 VG 49 VG 50 VG 51 VG 52 VG 53 VG 54 VG 55 VG 56 Tray 5 VG 1 VG 2 VG 3 VG 4 VG 5 VG 6 VG 7 VG 8 Tray 6 VG 17 VG 18 VG 19 VG 20 VG 21 VG 22 VG 23 VG 24 Tray 7 VG 33 VG 34 VG 35 VG 36 VG 37 VG 38 VG 39 VG 40 Tray 8 VG 9 VG 10 VG 11 VG 12 VG 13 VG 14 VG 15 VG 16 Tray 9 VG 25 VG 26 VG 27 VG 28 VG 29 VG 30 VG 31 VG 32 Tray 10 VG 41 VG 42 VG 43 VG 44 VG 45 VG 46 VG 47 VG 48 Tray 11 VG 49 VG 50 VG 51 VG 52 VG 53 VG 54 VG 55 VG 56 Tray 12 VG 9 VG 10 VG 11 VG 12 VG 13 VG 14 VG 15 VG 16 Tray 13 VG 25 VG 26 VG 27 VG 28 VG 29 VG 30 VG 31 VG 32 Tray 14 VG 41 VG 42 VG 43 VG 44 VG 45 VG 46 VG 47 VG 48
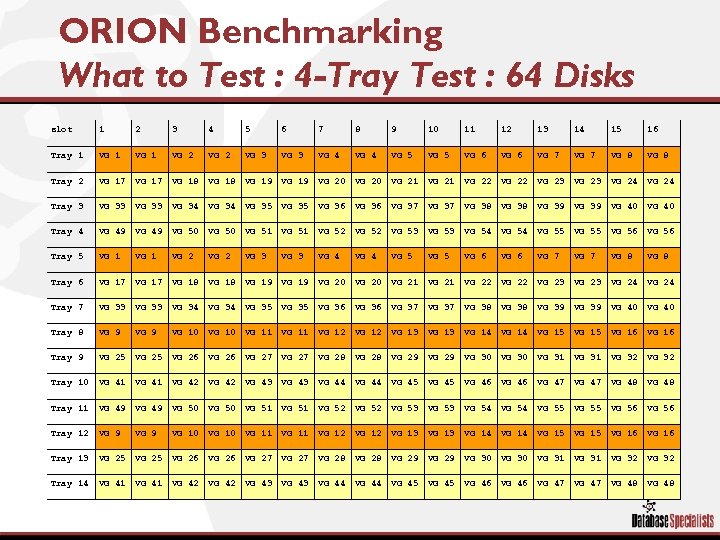 ORION Benchmarking What to Test : 4 -Tray Test : 64 Disks slot 1 2 3 4 5 6 7 8 9 10 11 12 13 14 15 16 Tray 1 VG 2 VG 3 VG 4 VG 5 VG 6 VG 7 VG 8 Tray 2 VG 17 VG 18 VG 19 VG 20 VG 21 VG 22 VG 23 VG 24 Tray 3 VG 33 VG 34 VG 35 VG 36 VG 37 VG 38 VG 39 VG 40 Tray 4 VG 49 VG 50 VG 51 VG 52 VG 53 VG 54 VG 55 VG 56 Tray 5 VG 1 VG 2 VG 3 VG 4 VG 5 VG 6 VG 7 VG 8 Tray 6 VG 17 VG 18 VG 19 VG 20 VG 21 VG 22 VG 23 VG 24 Tray 7 VG 33 VG 34 VG 35 VG 36 VG 37 VG 38 VG 39 VG 40 Tray 8 VG 9 VG 10 VG 11 VG 12 VG 13 VG 14 VG 15 VG 16 Tray 9 VG 25 VG 26 VG 27 VG 28 VG 29 VG 30 VG 31 VG 32 Tray 10 VG 41 VG 42 VG 43 VG 44 VG 45 VG 46 VG 47 VG 48 Tray 11 VG 49 VG 50 VG 51 VG 52 VG 53 VG 54 VG 55 VG 56 Tray 12 VG 9 VG 10 VG 11 VG 12 VG 13 VG 14 VG 15 VG 16 Tray 13 VG 25 VG 26 VG 27 VG 28 VG 29 VG 30 VG 31 VG 32 Tray 14 VG 41 VG 42 VG 43 VG 44 VG 45 VG 46 VG 47 VG 48
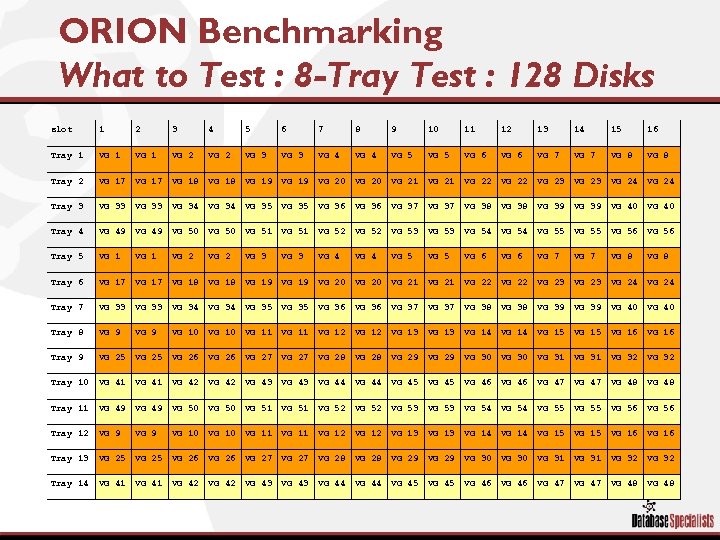 ORION Benchmarking What to Test : 8 -Tray Test : 128 Disks slot 1 2 3 4 5 6 7 8 9 10 11 12 13 14 15 16 Tray 1 VG 2 VG 3 VG 4 VG 5 VG 6 VG 7 VG 8 Tray 2 VG 17 VG 18 VG 19 VG 20 VG 21 VG 22 VG 23 VG 24 Tray 3 VG 33 VG 34 VG 35 VG 36 VG 37 VG 38 VG 39 VG 40 Tray 4 VG 49 VG 50 VG 51 VG 52 VG 53 VG 54 VG 55 VG 56 Tray 5 VG 1 VG 2 VG 3 VG 4 VG 5 VG 6 VG 7 VG 8 Tray 6 VG 17 VG 18 VG 19 VG 20 VG 21 VG 22 VG 23 VG 24 Tray 7 VG 33 VG 34 VG 35 VG 36 VG 37 VG 38 VG 39 VG 40 Tray 8 VG 9 VG 10 VG 11 VG 12 VG 13 VG 14 VG 15 VG 16 Tray 9 VG 25 VG 26 VG 27 VG 28 VG 29 VG 30 VG 31 VG 32 Tray 10 VG 41 VG 42 VG 43 VG 44 VG 45 VG 46 VG 47 VG 48 Tray 11 VG 49 VG 50 VG 51 VG 52 VG 53 VG 54 VG 55 VG 56 Tray 12 VG 9 VG 10 VG 11 VG 12 VG 13 VG 14 VG 15 VG 16 Tray 13 VG 25 VG 26 VG 27 VG 28 VG 29 VG 30 VG 31 VG 32 Tray 14 VG 41 VG 42 VG 43 VG 44 VG 45 VG 46 VG 47 VG 48
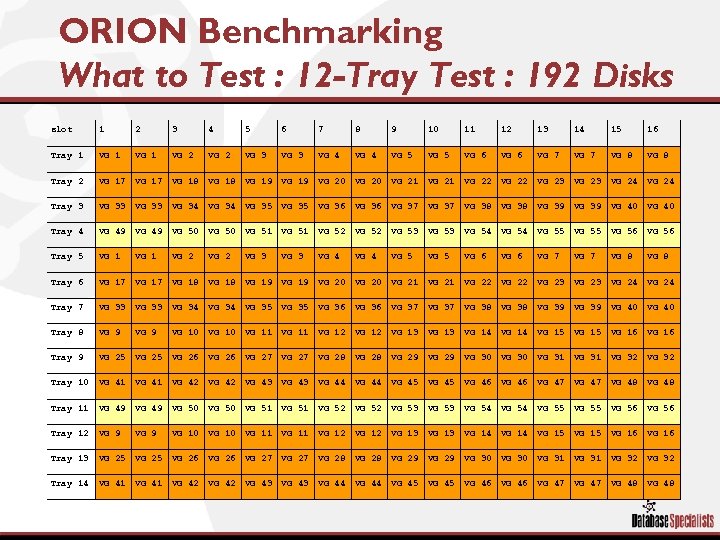 ORION Benchmarking What to Test : 12 -Tray Test : 192 Disks slot 1 2 3 4 5 6 7 8 9 10 11 12 13 14 15 16 Tray 1 VG 2 VG 3 VG 4 VG 5 VG 6 VG 7 VG 8 Tray 2 VG 17 VG 18 VG 19 VG 20 VG 21 VG 22 VG 23 VG 24 Tray 3 VG 33 VG 34 VG 35 VG 36 VG 37 VG 38 VG 39 VG 40 Tray 4 VG 49 VG 50 VG 51 VG 52 VG 53 VG 54 VG 55 VG 56 Tray 5 VG 1 VG 2 VG 3 VG 4 VG 5 VG 6 VG 7 VG 8 Tray 6 VG 17 VG 18 VG 19 VG 20 VG 21 VG 22 VG 23 VG 24 Tray 7 VG 33 VG 34 VG 35 VG 36 VG 37 VG 38 VG 39 VG 40 Tray 8 VG 9 VG 10 VG 11 VG 12 VG 13 VG 14 VG 15 VG 16 Tray 9 VG 25 VG 26 VG 27 VG 28 VG 29 VG 30 VG 31 VG 32 Tray 10 VG 41 VG 42 VG 43 VG 44 VG 45 VG 46 VG 47 VG 48 Tray 11 VG 49 VG 50 VG 51 VG 52 VG 53 VG 54 VG 55 VG 56 Tray 12 VG 9 VG 10 VG 11 VG 12 VG 13 VG 14 VG 15 VG 16 Tray 13 VG 25 VG 26 VG 27 VG 28 VG 29 VG 30 VG 31 VG 32 Tray 14 VG 41 VG 42 VG 43 VG 44 VG 45 VG 46 VG 47 VG 48
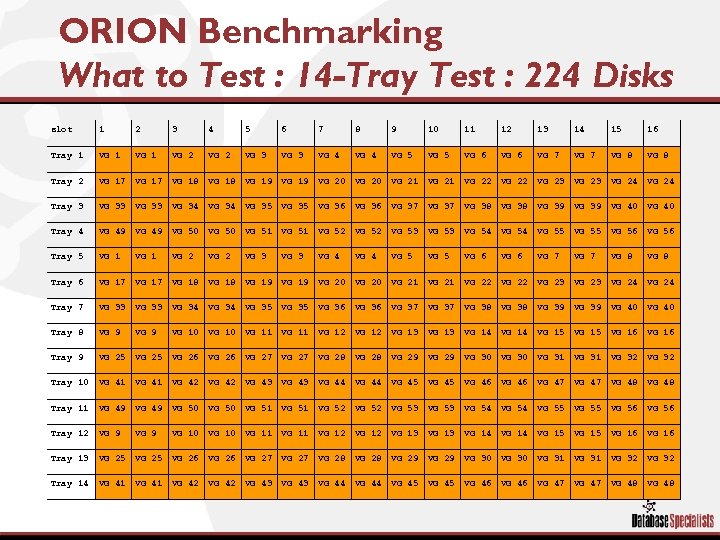 ORION Benchmarking What to Test : 14 -Tray Test : 224 Disks slot 1 2 3 4 5 6 7 8 9 10 11 12 13 14 15 16 Tray 1 VG 2 VG 3 VG 4 VG 5 VG 6 VG 7 VG 8 Tray 2 VG 17 VG 18 VG 19 VG 20 VG 21 VG 22 VG 23 VG 24 Tray 3 VG 33 VG 34 VG 35 VG 36 VG 37 VG 38 VG 39 VG 40 Tray 4 VG 49 VG 50 VG 51 VG 52 VG 53 VG 54 VG 55 VG 56 Tray 5 VG 1 VG 2 VG 3 VG 4 VG 5 VG 6 VG 7 VG 8 Tray 6 VG 17 VG 18 VG 19 VG 20 VG 21 VG 22 VG 23 VG 24 Tray 7 VG 33 VG 34 VG 35 VG 36 VG 37 VG 38 VG 39 VG 40 Tray 8 VG 9 VG 10 VG 11 VG 12 VG 13 VG 14 VG 15 VG 16 Tray 9 VG 25 VG 26 VG 27 VG 28 VG 29 VG 30 VG 31 VG 32 Tray 10 VG 41 VG 42 VG 43 VG 44 VG 45 VG 46 VG 47 VG 48 Tray 11 VG 49 VG 50 VG 51 VG 52 VG 53 VG 54 VG 55 VG 56 Tray 12 VG 9 VG 10 VG 11 VG 12 VG 13 VG 14 VG 15 VG 16 Tray 13 VG 25 VG 26 VG 27 VG 28 VG 29 VG 30 VG 31 VG 32 Tray 14 VG 41 VG 42 VG 43 VG 44 VG 45 VG 46 VG 47 VG 48
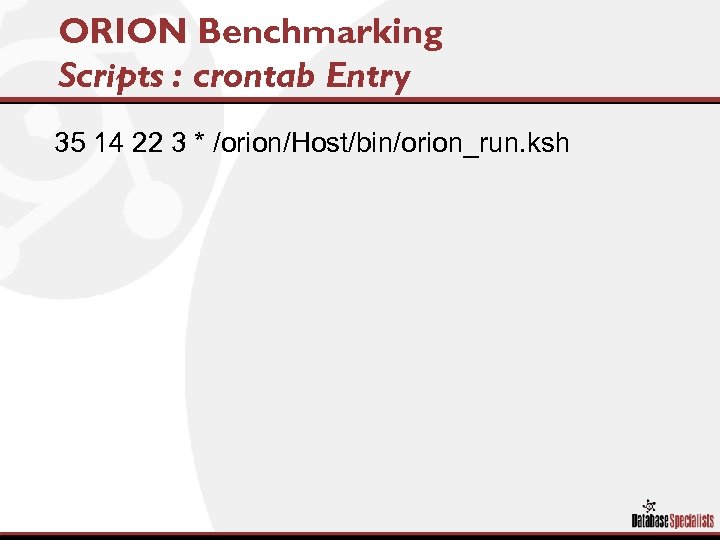 ORION Benchmarking Scripts : crontab Entry 35 14 22 3 * /orion/Host/bin/orion_run. ksh
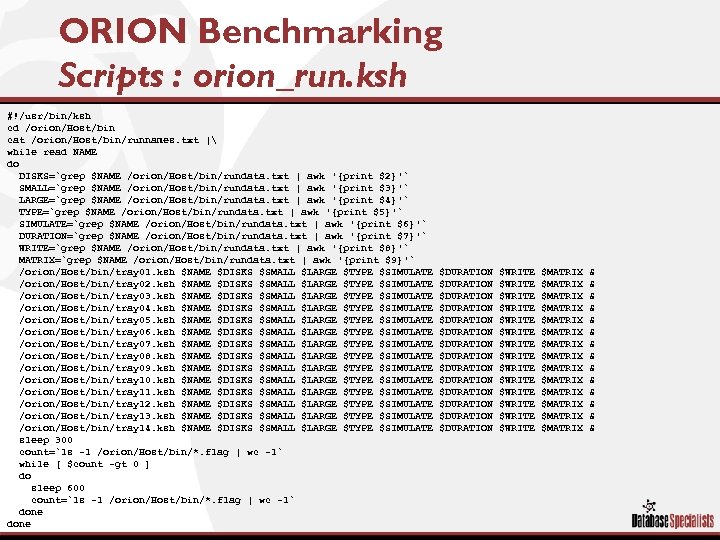 ORION Benchmarking Scripts : orion_run. ksh #!/usr/bin/ksh cd /orion/Host/bin cat /orion/Host/bin/runnames. txt | while read NAME do DISKS=`grep $NAME /orion/Host/bin/rundata. txt | awk '{print $2}'` SMALL=`grep $NAME /orion/Host/bin/rundata. txt | awk '{print $3}'` LARGE=`grep $NAME /orion/Host/bin/rundata. txt | awk '{print $4}'` TYPE=`grep $NAME /orion/Host/bin/rundata. txt | awk '{print $5}'` SIMULATE=`grep $NAME /orion/Host/bin/rundata. txt | awk '{print $6}'` DURATION=`grep $NAME /orion/Host/bin/rundata. txt | awk '{print $7}'` WRITE=`grep $NAME /orion/Host/bin/rundata. txt | awk '{print $8}'` MATRIX=`grep $NAME /orion/Host/bin/rundata. txt | awk '{print $9}'` /orion/Host/bin/tray 01. ksh $NAME $DISKS $SMALL $LARGE $TYPE $SIMULATE /orion/Host/bin/tray 02. ksh $NAME $DISKS $SMALL $LARGE $TYPE $SIMULATE /orion/Host/bin/tray 03. ksh $NAME $DISKS $SMALL $LARGE $TYPE $SIMULATE /orion/Host/bin/tray 04. ksh $NAME $DISKS $SMALL $LARGE $TYPE $SIMULATE /orion/Host/bin/tray 05. ksh $NAME $DISKS $SMALL $LARGE $TYPE $SIMULATE /orion/Host/bin/tray 06. ksh $NAME $DISKS $SMALL $LARGE $TYPE $SIMULATE /orion/Host/bin/tray 07. ksh $NAME $DISKS $SMALL $LARGE $TYPE $SIMULATE /orion/Host/bin/tray 08. ksh $NAME $DISKS $SMALL $LARGE $TYPE $SIMULATE /orion/Host/bin/tray 09. ksh $NAME $DISKS $SMALL $LARGE $TYPE $SIMULATE /orion/Host/bin/tray 10. ksh $NAME $DISKS $SMALL $LARGE $TYPE $SIMULATE /orion/Host/bin/tray 11. ksh $NAME $DISKS $SMALL $LARGE $TYPE $SIMULATE /orion/Host/bin/tray 12. ksh $NAME $DISKS $SMALL $LARGE $TYPE $SIMULATE /orion/Host/bin/tray 13. ksh $NAME $DISKS $SMALL $LARGE $TYPE $SIMULATE /orion/Host/bin/tray 14. ksh $NAME $DISKS $SMALL $LARGE $TYPE $SIMULATE sleep 300 count=`ls -1 /orion/Host/bin/*. flag | wc -l` while [ $count -gt 0 ] do sleep 600 count=`ls -1 /orion/Host/bin/*. flag | wc -l` done $DURATION $DURATION $DURATION $DURATION $WRITE $WRITE $WRITE $WRITE $MATRIX $MATRIX $MATRIX $MATRIX & & & &
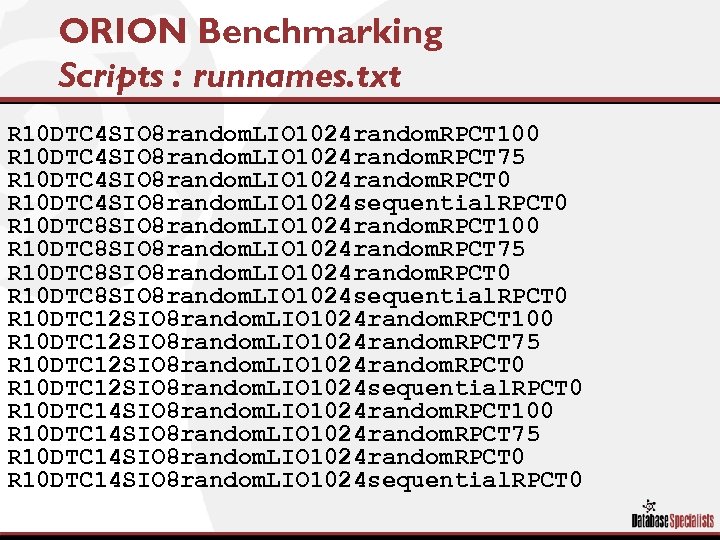 ORION Benchmarking Scripts : runnames. txt R 10 DTC 4 SIO 8 random. LIO 1024 random. RPCT 100 R 10 DTC 4 SIO 8 random. LIO 1024 random. RPCT 75 R 10 DTC 4 SIO 8 random. LIO 1024 random. RPCT 0 R 10 DTC 4 SIO 8 random. LIO 1024 sequential. RPCT 0 R 10 DTC 8 SIO 8 random. LIO 1024 random. RPCT 100 R 10 DTC 8 SIO 8 random. LIO 1024 random. RPCT 75 R 10 DTC 8 SIO 8 random. LIO 1024 random. RPCT 0 R 10 DTC 8 SIO 8 random. LIO 1024 sequential. RPCT 0 R 10 DTC 12 SIO 8 random. LIO 1024 random. RPCT 100 R 10 DTC 12 SIO 8 random. LIO 1024 random. RPCT 75 R 10 DTC 12 SIO 8 random. LIO 1024 random. RPCT 0 R 10 DTC 12 SIO 8 random. LIO 1024 sequential. RPCT 0 R 10 DTC 14 SIO 8 random. LIO 1024 random. RPCT 100 R 10 DTC 14 SIO 8 random. LIO 1024 random. RPCT 75 R 10 DTC 14 SIO 8 random. LIO 1024 random. RPCT 0 R 10 DTC 14 SIO 8 random. LIO 1024 sequential. RPCT 0
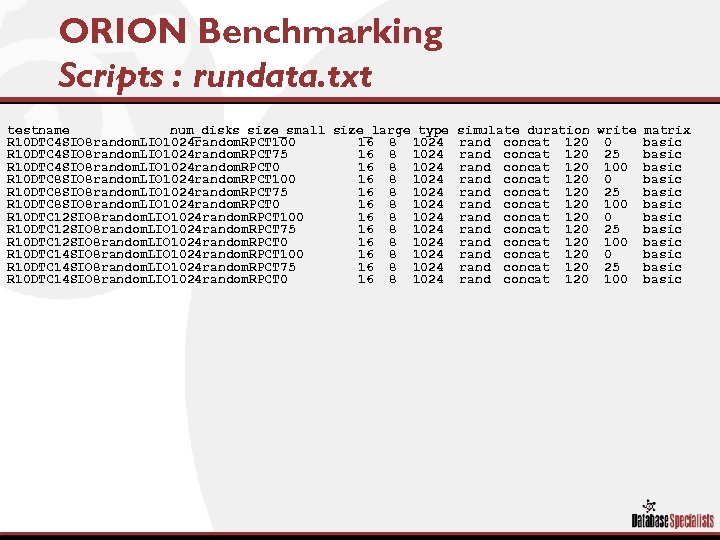 ORION Benchmarking Scripts : rundata. txt testname num_disks size_small size_large type R 10 DTC 4 SIO 8 random. LIO 1024 random. RPCT 100 16 8 1024 R 10 DTC 4 SIO 8 random. LIO 1024 random. RPCT 75 16 8 1024 R 10 DTC 4 SIO 8 random. LIO 1024 random. RPCT 0 16 8 1024 R 10 DTC 8 SIO 8 random. LIO 1024 random. RPCT 100 16 8 1024 R 10 DTC 8 SIO 8 random. LIO 1024 random. RPCT 75 16 8 1024 R 10 DTC 8 SIO 8 random. LIO 1024 random. RPCT 0 16 8 1024 R 10 DTC 12 SIO 8 random. LIO 1024 random. RPCT 100 16 8 1024 R 10 DTC 12 SIO 8 random. LIO 1024 random. RPCT 75 16 8 1024 R 10 DTC 12 SIO 8 random. LIO 1024 random. RPCT 0 16 8 1024 R 10 DTC 14 SIO 8 random. LIO 1024 random. RPCT 100 16 8 1024 R 10 DTC 14 SIO 8 random. LIO 1024 random. RPCT 75 16 8 1024 R 10 DTC 14 SIO 8 random. LIO 1024 random. RPCT 0 16 8 1024 simulate duration write matrix rand concat 120 0 basic rand concat 120 25 basic rand concat 120 100 basic
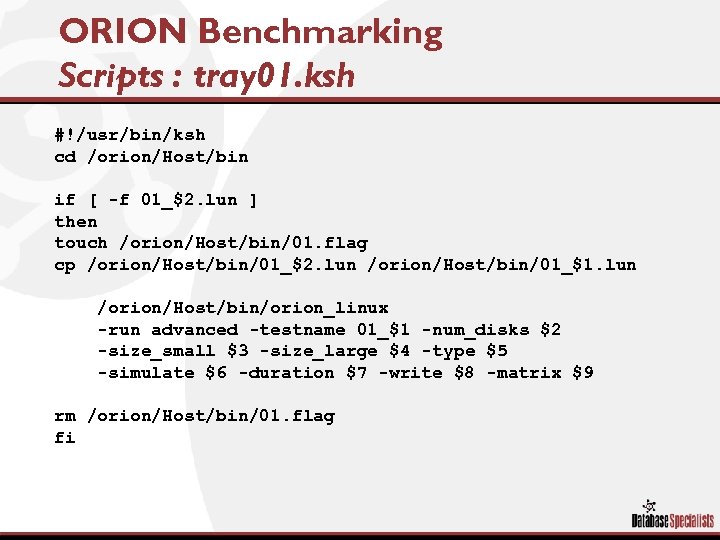 ORION Benchmarking Scripts : tray 01. ksh #!/usr/bin/ksh cd /orion/Host/bin if [ -f 01_$2. lun ] then touch /orion/Host/bin/01. flag cp /orion/Host/bin/01_$2. lun /orion/Host/bin/01_$1. lun /orion/Host/bin/orion_linux -run advanced -testname 01_$1 -num_disks $2 -size_small $3 -size_large $4 -type $5 -simulate $6 -duration $7 -write $8 -matrix $9 rm /orion/Host/bin/01. flag fi
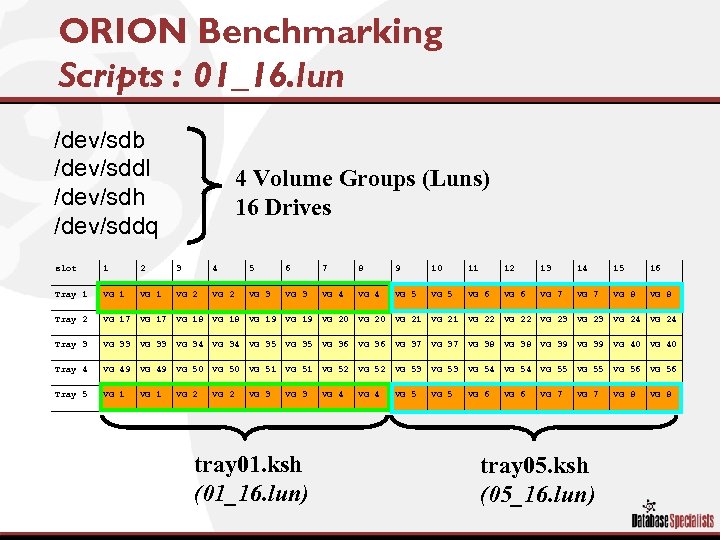 ORION Benchmarking Scripts : 01_16. lun /dev/sdb /dev/sddl /dev/sdh /dev/sddq 4 Volume Groups (Luns) 16 Drives slot 1 2 3 4 5 6 7 8 9 10 11 12 13 14 15 16 Tray 1 VG 2 VG 3 VG 4 VG 5 VG 6 VG 7 VG 8 Tray 2 VG 17 VG 18 VG 19 VG 20 VG 21 VG 22 VG 23 VG 24 Tray 3 VG 33 VG 34 VG 35 VG 36 VG 37 VG 38 VG 39 VG 40 Tray 4 VG 49 VG 50 VG 51 VG 52 VG 53 VG 54 VG 55 VG 56 Tray 5 VG 1 VG 2 VG 3 VG 4 VG 5 VG 6 VG 7 VG 8 tray 01. ksh (01_16. lun) tray 05. ksh (05_16. lun)
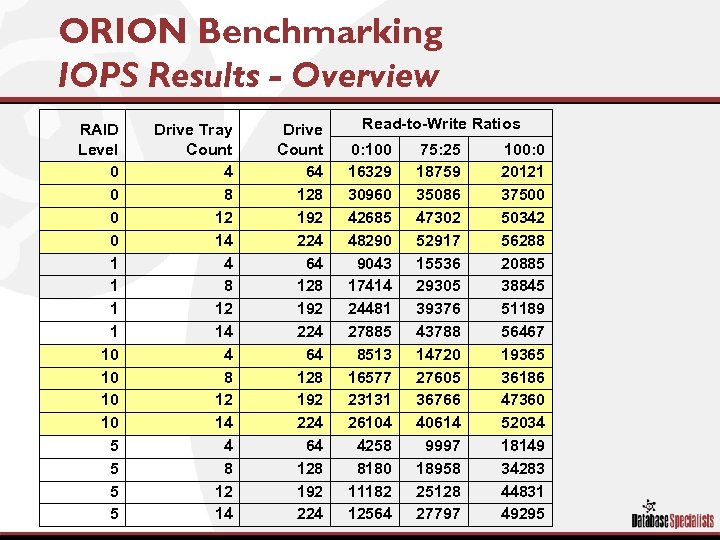
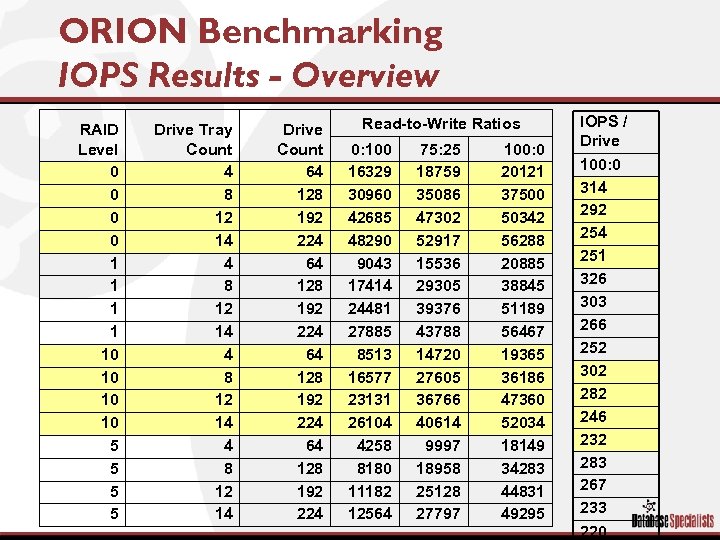
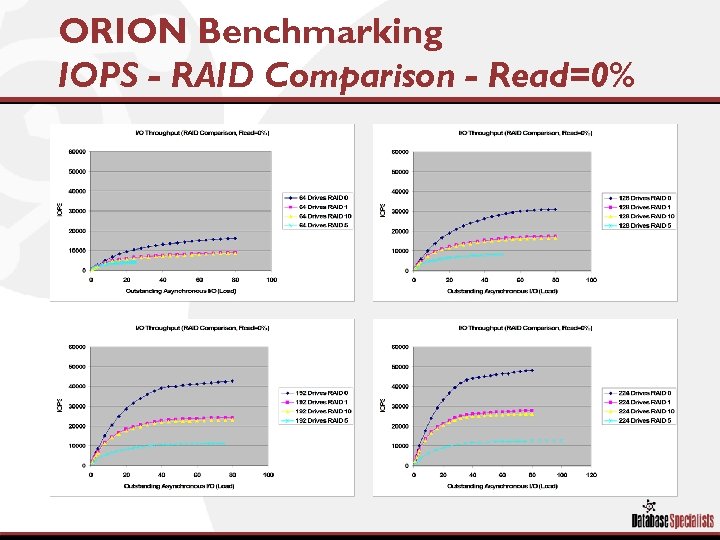
 ORION Benchmarking Understanding the Test Results § ORION Outputs – – IOPS MBPS Latencies Summary § IOPS Overview § Graphical Results – 0, 75, 100 percent Reads
 ORION Benchmarking IOPS Results § Input/outputs per second (IOPS) are primarily a concern in an online transaction processing (OLTP) application environment. OLTP application environments have these characteristics: – High intensity of reads and writes – Highly transaction-based applications – Large bursts of small reads followed by inserts and updates – Small random I/Os, typically the size of the database block size – Read-to-write ratios, typically 70: 30
 ORION Benchmarking IOPS Results - Overview RAID Level 0 0 1 1 10 10 5 5 Drive Tray Count 4 8 12 14 Drive Count 64 128 192 224 Read-to-Write Ratios 0: 100 16329 30960 42685 48290 9043 17414 24481 27885 8513 16577 23131 26104 4258 8180 11182 12564 75: 25 18759 35086 47302 52917 15536 29305 39376 43788 14720 27605 36766 40614 9997 18958 25128 27797 100: 0 20121 37500 50342 56288 20885 38845 51189 56467 19365 36186 47360 52034 18149 34283 44831 49295
 ORION Benchmarking IOPS Results - Overview RAID Level 0 0 1 1 10 10 5 5 Drive Tray Count 4 8 12 14 Drive Count 64 128 192 224 Read-to-Write Ratios 0: 100 16329 30960 42685 48290 9043 17414 24481 27885 8513 16577 23131 26104 4258 8180 11182 12564 75: 25 18759 35086 47302 52917 15536 29305 39376 43788 14720 27605 36766 40614 9997 18958 25128 27797 100: 0 20121 37500 50342 56288 20885 38845 51189 56467 19365 36186 47360 52034 18149 34283 44831 49295 IOPS / Drive 100: 0 314 292 254 251 326 303 266 252 302 282 246 232 283 267 233 220
 ORION Benchmarking IOPS - RAID Comparison - Read=0%
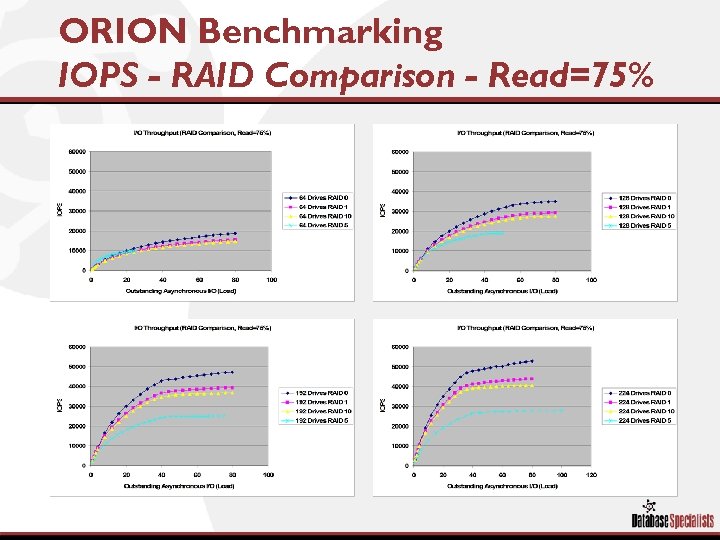 ORION Benchmarking IOPS - RAID Comparison - Read=75%
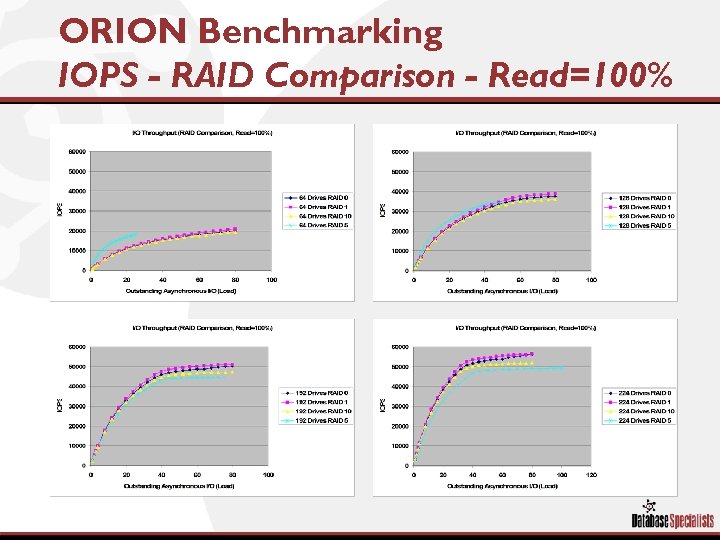 ORION Benchmarking IOPS - RAID Comparison - Read=100%
 Existing System Can I Validate?
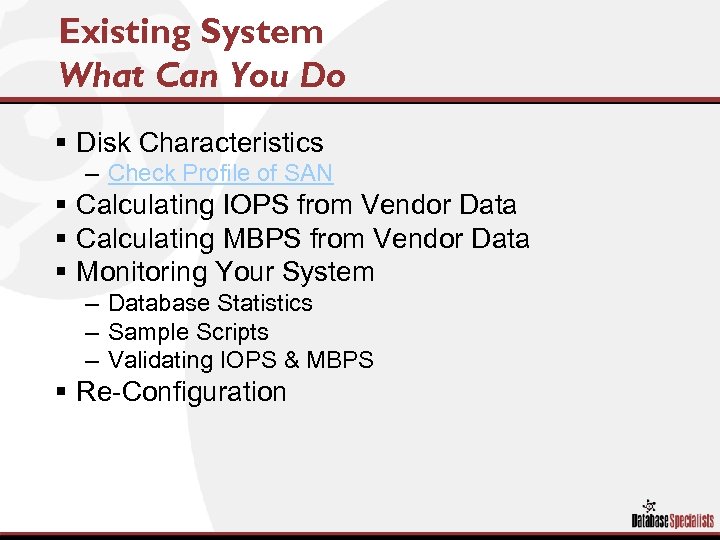 Existing System What Can You Do § Disk Characteristics – Check Profile of SAN § Calculating IOPS from Vendor Data § Calculating MBPS from Vendor Data § Monitoring Your System – Database Statistics – Sample Scripts – Validating IOPS & MBPS § Re-Configuration
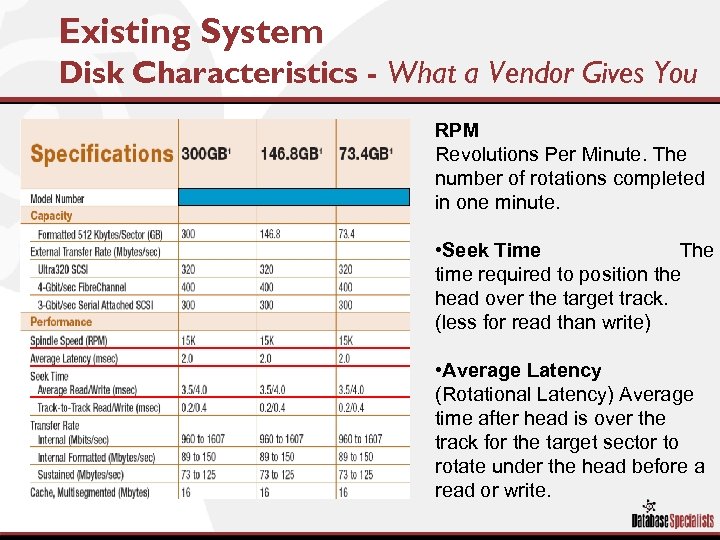 Existing System Disk Characteristics - What a Vendor Gives You RPM Revolutions Per Minute. The number of rotations completed in one minute. • Seek Time The time required to position the head over the target track. (less for read than write) • Average Latency (Rotational Latency) Average time after head is over the track for the target sector to rotate under the head before a read or write.
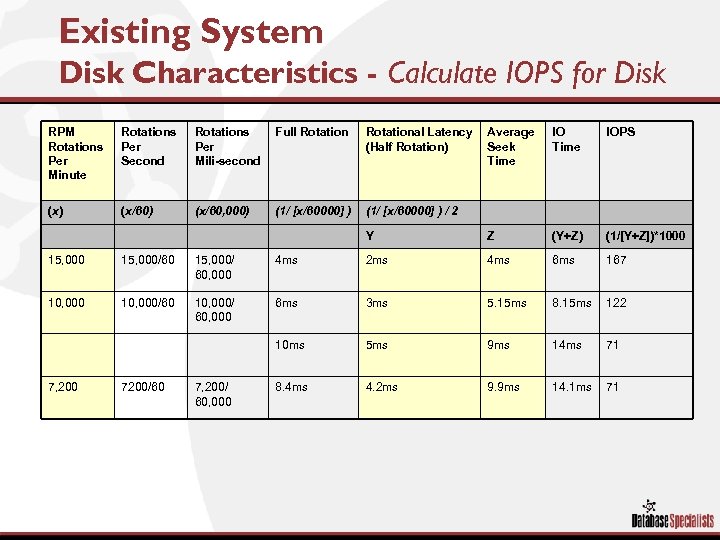 Existing System Disk Characteristics - Calculate IOPS for Disk RPM Rotations Per Minute Rotations Per Second Rotations Per Mili-second Full Rotational Latency (Half Rotation) Average Seek Time IOPS (x) (x/60, 000) (1/ [x/60000] ) / 2 Y Z (Y+Z) (1/[Y+Z])*1000 15, 000/60 15, 000/ 60, 000 4 ms 2 ms 4 ms 6 ms 167 10, 000/60 10, 000/ 60, 000 6 ms 3 ms 5. 15 ms 8. 15 ms 122 10 ms 5 ms 9 ms 14 ms 71 8. 4 ms 4. 2 ms 9. 9 ms 14. 1 ms 71 7, 200 7200/60 7, 200/ 60, 000
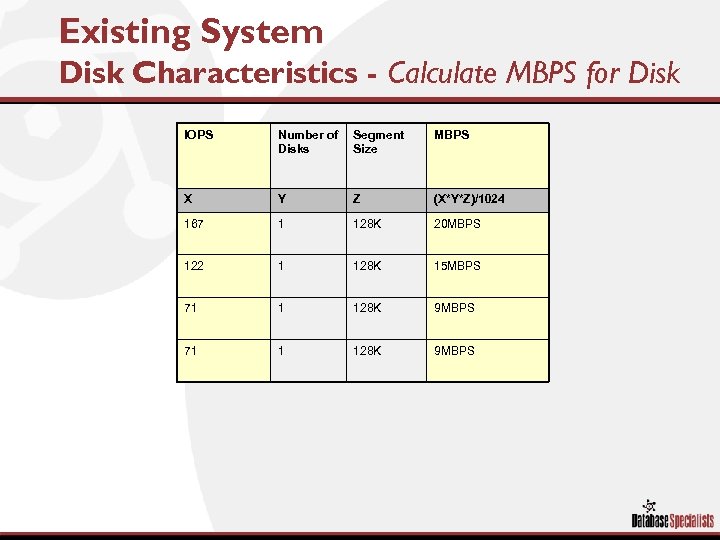 Existing System Disk Characteristics - Calculate MBPS for Disk IOPS Number of Disks Segment Size MBPS X Y Z (X*Y*Z)/1024 167 1 128 K 20 MBPS 122 1 128 K 15 MBPS 71 1 128 K 9 MBPS
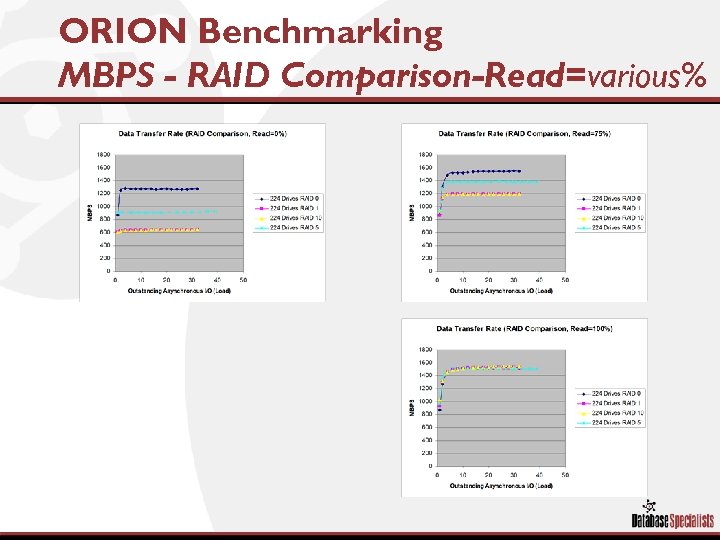 ORION Benchmarking MBPS - RAID Comparison-Read=various%
 Existing System Scripts – Validate IOPS & MBPS § Set of scripts to run against your existing database § Check / Validate what the database sees against what you expect from hardware § Run against current statistics § Run against Snapshots
 Existing System Report IOPS & MBPS over time § Purpose – Report IOPS & MBPS • For small and large I/O • Percentage of Reads to Writes • User Defined Sample Period § Importance – Matching Expected I/O rates on the Disk Subsystem to What is Actually Seen in the Database § Script – vsysstat_ioworkload. sql
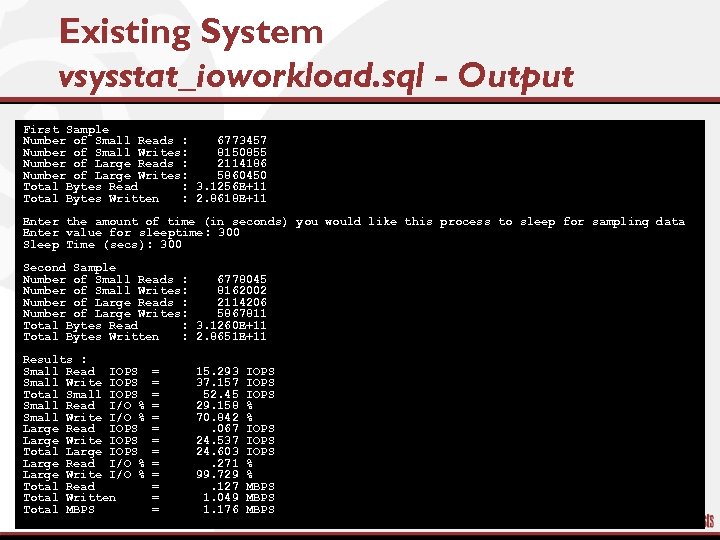 Existing System vsysstat_ioworkload. sql - Output First Sample Number of Small Reads : 6773457 Number of Small Writes: 8150855 Number of Large Reads : 2114186 Number of Large Writes: 5860450 Total Bytes Read : 3. 1256 E+11 Total Bytes Written : 2. 8618 E+11 Enter the amount of time (in seconds) you would like this process to sleep for sampling data Enter value for sleeptime: 300 Sleep Time (secs): 300 Second Sample Number of Small Reads : 6778045 Number of Small Writes: 8162002 Number of Large Reads : 2114206 Number of Large Writes: 5867811 Total Bytes Read : 3. 1260 E+11 Total Bytes Written : 2. 8651 E+11 Results : Small Read IOPS Small Write IOPS Total Small IOPS Small Read I/O % Small Write I/O % Large Read IOPS Large Write IOPS Total Large IOPS Large Read I/O % Large Write I/O % Total Read Total Written Total MBPS = = = = 15. 293 37. 157 52. 45 29. 158 70. 842. 067 24. 537 24. 603. 271 99. 729. 127 1. 049 1. 176 IOPS IOPS % % MBPS
 Existing System Report IOPS & MBPS over Snapshots § Purpose – Report IOPS & MBPS • • Uses Snapshots ; Workload Repository History (WRH) For small and large I/O Percentage of Reads to Writes User Defined Sample Period § Importance – Matching Expected I/O rates on the Disk Subsystem to What is Actually Seen in the Database § Warning – Performance Tuning Pack Requirement § Script – wrh_sysstat_ioworkload. sql
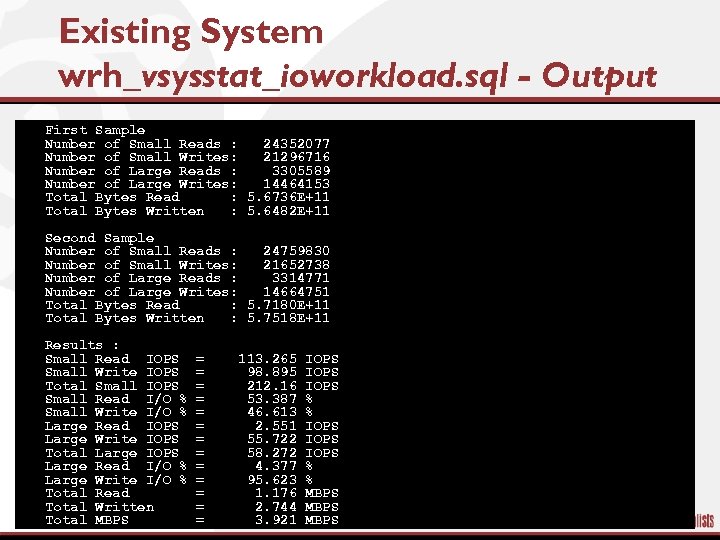 Existing System wrh_vsysstat_ioworkload. sql - Output § § § § First Sample Number of Small Reads : 24352077 Number of Small Writes: 21296716 Number of Large Reads : 3305589 Number of Large Writes: 14464153 Total Bytes Read : 5. 6736 E+11 Total Bytes Written : 5. 6482 E+11 § § § § Second Sample Number of Small Reads : 24759830 Number of Small Writes: 21652738 Number of Large Reads : 3314771 Number of Large Writes: 14664751 Total Bytes Read : 5. 7180 E+11 Total Bytes Written : 5. 7518 E+11 § § § § Results : Small Read IOPS Small Write IOPS Total Small IOPS Small Read I/O % Small Write I/O % Large Read IOPS Large Write IOPS Total Large IOPS Large Read I/O % Large Write I/O % Total Read Total Written Total MBPS = = = = 113. 265 98. 895 212. 16 53. 387 46. 613 2. 551 55. 722 58. 272 4. 377 95. 623 1. 176 2. 744 3. 921 IOPS IOPS % % MBPS
 Existing System Report IOPS & MBPS over Snapshots § Purpose – Report IOPS & MBPS • • Uses Snapshots ; Workload Repository History (WRH) For small and large I/O Percentage of Reads to Writes EVERYTHING § Importance – Matching Expected I/O rates on the Disk Subsystem to What is Actually Seen in the Database § Warning – Performance Tuning Pack Requirement § Script – wrh_sysstat_ioworkload_ALL. sql
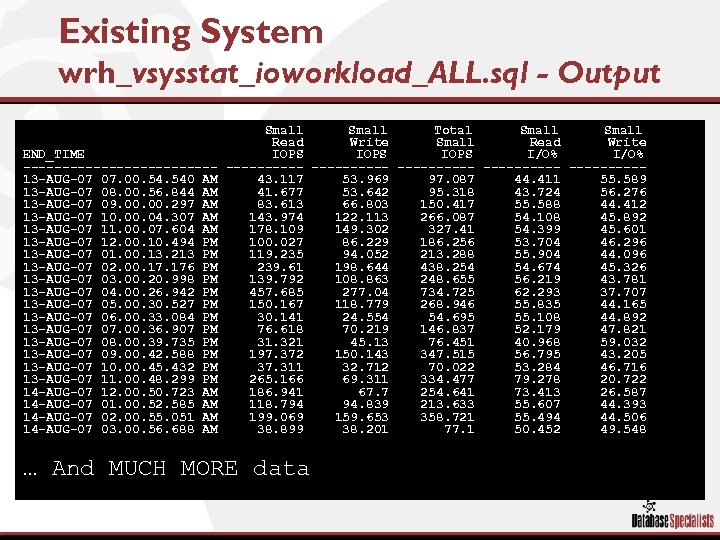 Existing System wrh_vsysstat_ioworkload_ALL. sql - Output END_TIME ------------13 -AUG-07 07. 00. 540 AM 13 -AUG-07 08. 00. 56. 844 AM 13 -AUG-07 09. 00. 297 AM 13 -AUG-07 10. 04. 307 AM 13 -AUG-07 11. 00. 07. 604 AM 13 -AUG-07 12. 00. 10. 494 PM 13 -AUG-07 01. 00. 13. 213 PM 13 -AUG-07 02. 00. 176 PM 13 -AUG-07 03. 00. 20. 998 PM 13 -AUG-07 04. 00. 26. 942 PM 13 -AUG-07 05. 00. 30. 527 PM 13 -AUG-07 06. 00. 33. 084 PM 13 -AUG-07 07. 00. 36. 907 PM 13 -AUG-07 08. 00. 39. 735 PM 13 -AUG-07 09. 00. 42. 588 PM 13 -AUG-07 10. 00. 45. 432 PM 13 -AUG-07 11. 00. 48. 299 PM 14 -AUG-07 12. 00. 50. 723 AM 14 -AUG-07 01. 00. 52. 585 AM 14 -AUG-07 02. 00. 55. 051 AM 14 -AUG-07 03. 00. 56. 688 AM Small Total Small Read Write IOPS I/O% ---------- -----43. 117 53. 969 97. 087 44. 411 55. 589 41. 677 53. 642 95. 318 43. 724 56. 276 83. 613 66. 803 150. 417 55. 588 44. 412 143. 974 122. 113 266. 087 54. 108 45. 892 178. 109 149. 302 327. 41 54. 399 45. 601 100. 027 86. 229 186. 256 53. 704 46. 296 119. 235 94. 052 213. 288 55. 904 44. 096 239. 61 198. 644 438. 254 54. 674 45. 326 139. 792 108. 863 248. 655 56. 219 43. 781 457. 685 277. 04 734. 725 62. 293 37. 707 150. 167 118. 779 268. 946 55. 835 44. 165 30. 141 24. 554 54. 695 55. 108 44. 892 76. 618 70. 219 146. 837 52. 179 47. 821 31. 321 45. 13 76. 451 40. 968 59. 032 197. 372 150. 143 347. 515 56. 795 43. 205 37. 311 32. 712 70. 022 53. 284 46. 716 265. 166 69. 311 334. 477 79. 278 20. 722 186. 941 67. 7 254. 641 73. 413 26. 587 118. 794 94. 839 213. 633 55. 607 44. 393 199. 069 159. 653 358. 721 55. 494 44. 506 38. 899 38. 201 77. 1 50. 452 49. 548 … And MUCH MORE data
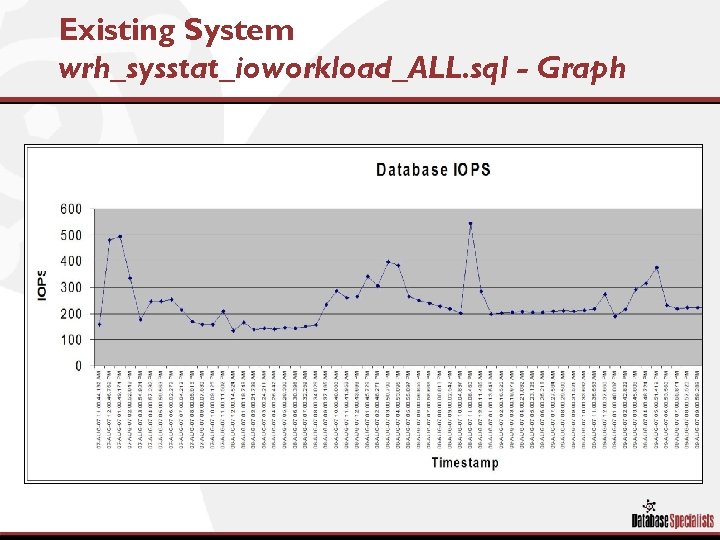 Existing System wrh_sysstat_ioworkload_ALL. sql - Graph
 Existing System Report I/O Percentages § Purpose – Report I/O Percentages • Across mount points • Current database statistics § Importance – Investigate which mount point are experiencing the most read or writes – Use to see if any mount point is being used more than others § Script – vfilestat_iopercent_mount. sql
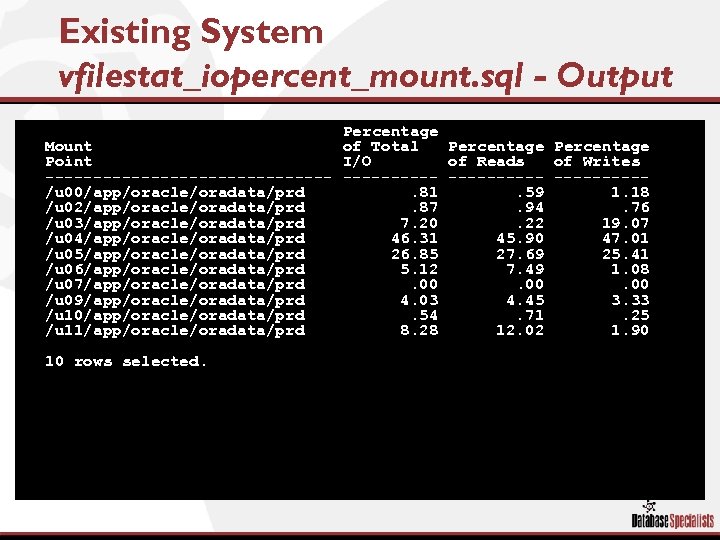 Existing System vfilestat_iopercent_mount. sql - Output § § § § Percentage Mount of Total Percentage Point I/O of Reads of Writes --------------- -----/u 00/app/oracle/oradata/prd. 81. 59 1. 18 /u 02/app/oracle/oradata/prd. 87. 94. 76 /u 03/app/oracle/oradata/prd 7. 20. 22 19. 07 /u 04/app/oracle/oradata/prd 46. 31 45. 90 47. 01 /u 05/app/oracle/oradata/prd 26. 85 27. 69 25. 41 /u 06/app/oracle/oradata/prd 5. 12 7. 49 1. 08 /u 07/app/oracle/oradata/prd. 00. 00 /u 09/app/oracle/oradata/prd 4. 03 4. 45 3. 33 /u 10/app/oracle/oradata/prd. 54. 71. 25 /u 11/app/oracle/oradata/prd 8. 28 12. 02 1. 90 § 10 rows selected.
 Existing System Report I/O Percentages § Purpose – Report I/O Percentages • Across mount points • For small and large I/O • Uses Snapshots ; Workload Repository History (WRH) § Importance – Investigate which mount point are experiencing the most read or writes – Use to see if any mount point is being used more than others § Script – wrh_vfilestat_iopercent_mount. sql
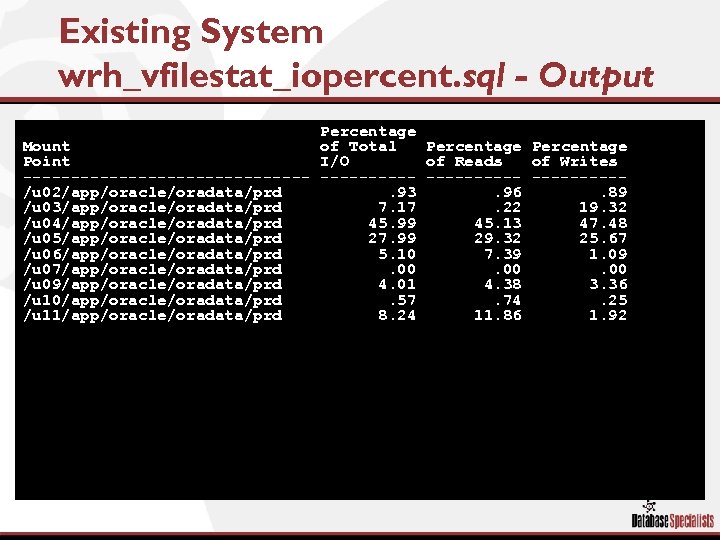 Existing System wrh_vfilestat_iopercent. sql - Output Percentage Mount of Total Percentage Point I/O of Reads of Writes --------------- -----/u 02/app/oracle/oradata/prd. 93. 96. 89 /u 03/app/oracle/oradata/prd 7. 17. 22 19. 32 /u 04/app/oracle/oradata/prd 45. 99 45. 13 47. 48 /u 05/app/oracle/oradata/prd 27. 99 29. 32 25. 67 /u 06/app/oracle/oradata/prd 5. 10 7. 39 1. 09 /u 07/app/oracle/oradata/prd. 00. 00 /u 09/app/oracle/oradata/prd 4. 01 4. 38 3. 36 /u 10/app/oracle/oradata/prd. 57. 74. 25 /u 11/app/oracle/oradata/prd 8. 24 11. 86 1. 92
 Conclusion / Questions
 Simulating Oracle I/O Workloads to Configure Storage James F. Koopmann No. COUG Fall Conference 2007 4: 00 – 5: 00


