88dae125a15c724c25697260700b1750.ppt
- Количество слайдов: 24


Science of x 100’s in Stock Market IMKB a first order approach

function of Science = prediction
 Science Prediction (=solution)")
Data (=problem) Science Prediction (=solution)

Can we use the methods of science to make predictions on stock markets? . . . No experimentation. Lack of observation. No/ lack of/ full (? ) mathematization. Very hot issue; more papers, more projects, more money. . .

Problem set Data set d 1, d 2, d 3, . . . p 1, p 2, p 3, . . . D={di} P={pj} f(D) = P

Data d 1 d 2 d 3 d 4 Problem p 1 p 2 p 3 p 4 . . . calculation=thinking f(dj)=pk About 100 data and/or questions per day. Relevancy and weights of dj pk connections.

For a specific stock kmax=1 and p 1= for each investor i. -1≤ i ≤ +1 and • -1≤ i ≤ Si ≤ 0 SELL • 0≤ Bi ≤ +1 BUY, where Si and Bi are personal tresholds, both can be set to 0 as default.
 If decision is made at t. mi(t) is the portfolio")
i = i(t) If decision is made at t. mi(t) is the portfolio value of the investor i mi(t)= i(t) + i(t), is the liquid, stock amount and is initial capital, net gain. where
 defines the whole market at t. mi(t) ≤ mi(t- ) market is")
mi(t) defines the whole market at t. mi(t) ≤ mi(t- ) market is SOLD in mi(t) ≥ mi(t- ) market is BOUGHT i(t) ≥ i(t- ) market is (expected) to be BOUGHT in the next i(t) ≥ i(t- ) market is (expected) to be SOLD All the resulting information becomes new data dj’s (for the next ).

Time constants © All investors’ aim is to make profit. Buy cheap sell expensive © Investors’ profile is nonuniform, so is i(t). (Investors’ profile displays the same distrubution as in society. ) Assumptions Investors are close followers, aware of all information and news. ( tight-binding approach ) Investors are reflexive, decide and behave immediately. ( pseudo-potential approach ) Then i(t) equals to tendencies and actions at the same time.

Mathematisation All the resulting information on the previous new dj (for the next time period ). slide become Iterative methods Optimization of i(t)’s, where stands for any of , , , and . Any more?

 growth: A = A 0 ± A state economies Forced")
Growth types Random (arithmetical) growth: A = A 0 ± A state economies Forced arithmetical growth: minimized A maximized + A

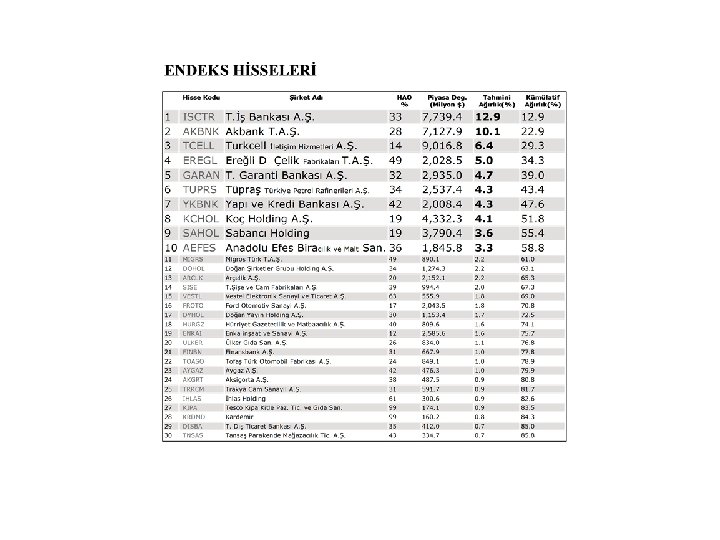
• YKBNK

Geometrical growth A / A = r A 1= A 0 + r. A 0 A 2= A 1 + r. A 1 A 3= A 2 + r. A 2. . . An-1 An+1=An 2 An= (1+r)n. A 0 (r, constant) = (1+r) A 0 = (1+r)2 A 0 = (1+r)3 A 0 population
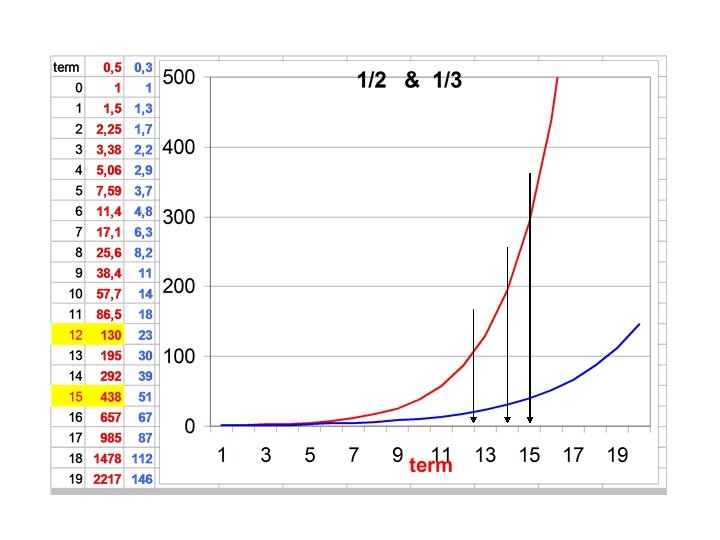

Exponential growth A/A = n r An=enr information, bacteria, garbage Q: Can we manage extreme (geometrical or exponential) growths of portfolios in stock market (IMKB)? . . . A: Yes!. . .

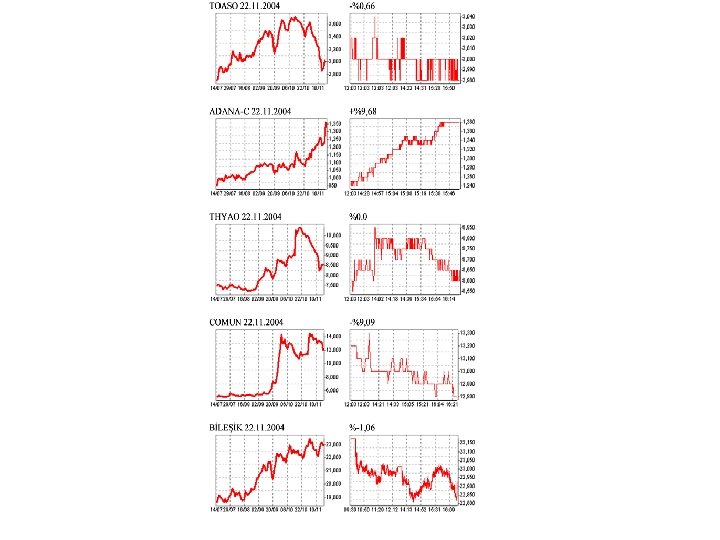
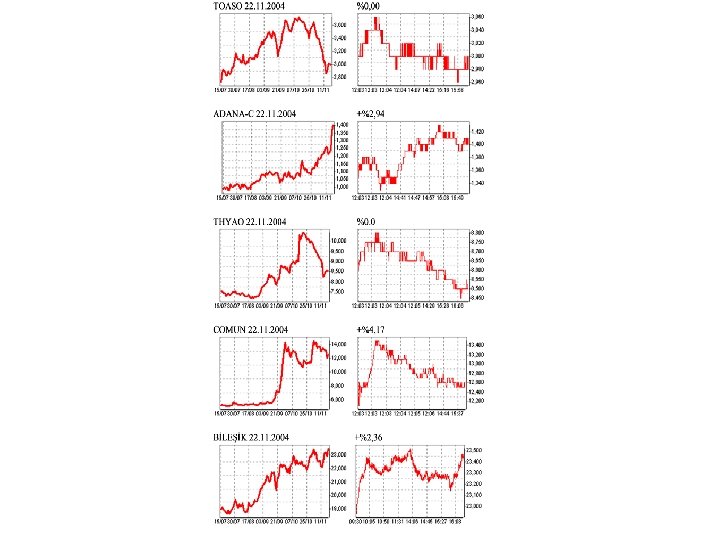
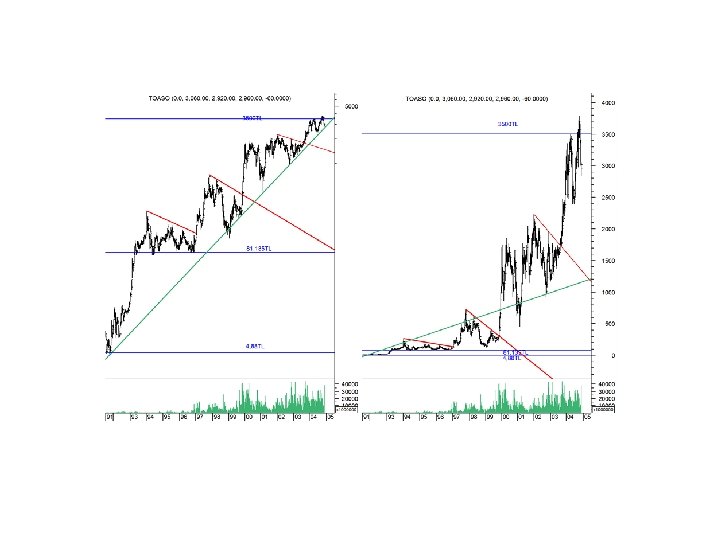
FMIZP, ADANA-c, ECZYT, . . . too expensive Q: New & cheap ones? A: Yes! Summary: Hamsi fishing or whale hunting. . . Yours questions please. . .

Thanks a lot for yours kindly interest and listenning. . .

a bis
88dae125a15c724c25697260700b1750.ppt