SAT ii MATH TOPICS By Mr. Shustef Measure


SAT ii MATH TOPICS By Mr. Shustef
Measure of Central Tendency Mean (Average) – the sum of a set of data divided by the number of data (do not round your answer unless directed to do so) Median –the middle value, or the mean of the middle two values, when the data is arranged in numerical order Mode –the value (number) that appears the most. It is possible to have more than one mode, and it is possible to have no mode If there is no mode-write "no mode", do not write zero (0)
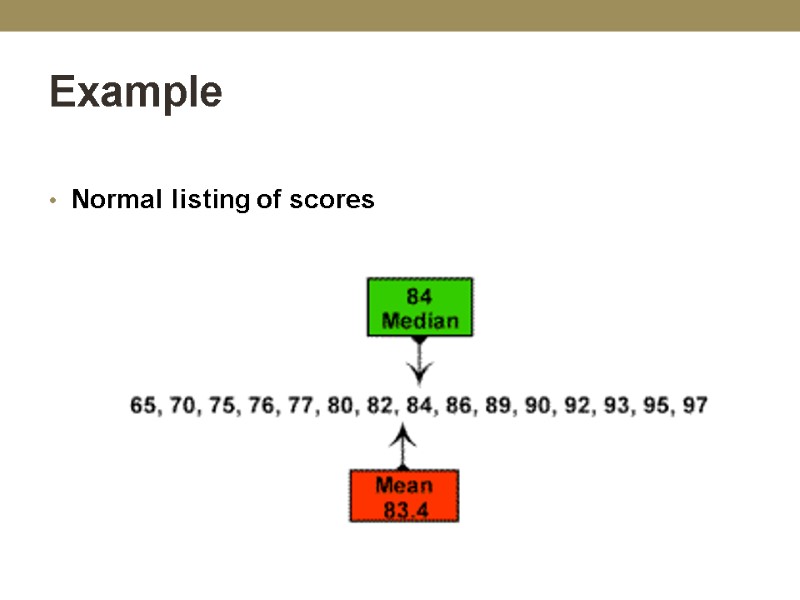
Example Normal listing of scores
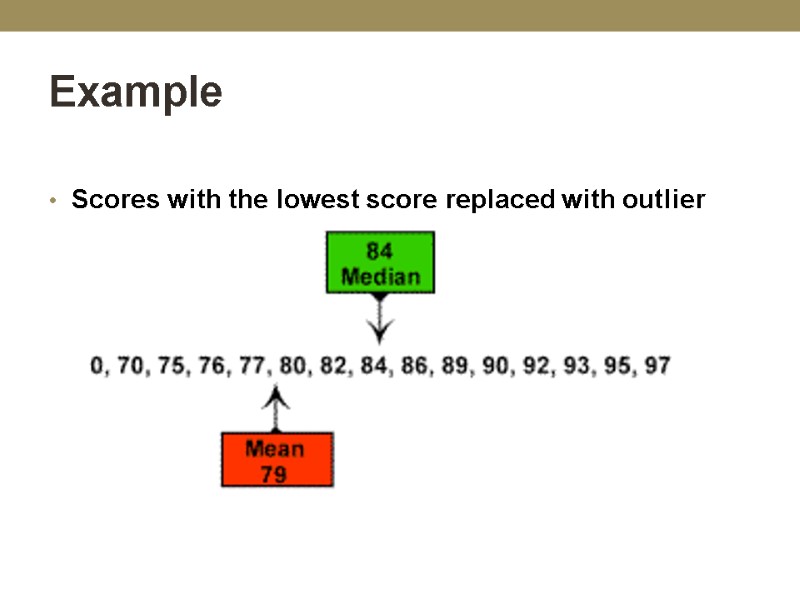
Example Scores with the lowest score replaced with outlier
Example The two sets of scores above are identical except for the first score The first set shows the actual scores The second set shows what would happen if one of the scores was WAY out of range in regard to the other scores. Such a term is called an outlier With the outlier, the mean changed With the outlier, the median did NOT change
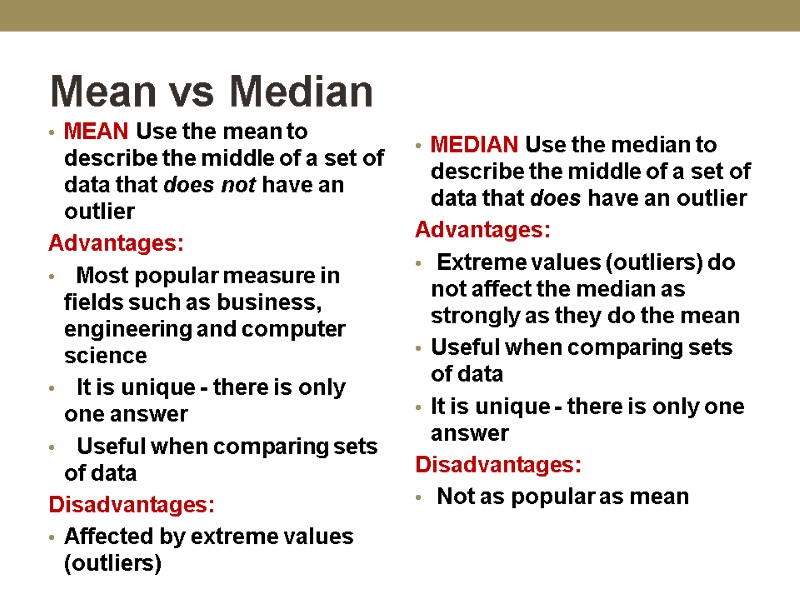
Mean vs Median MEAN Use the mean to describe the middle of a set of data that does not have an outlier Advantages: Most popular measure in fields such as business, engineering and computer science It is unique - there is only one answer Useful when comparing sets of data Disadvantages: Affected by extreme values (outliers) MEDIAN Use the median to describe the middle of a set of data that does have an outlier Advantages: Extreme values (outliers) do not affect the median as strongly as they do the mean Useful when comparing sets of data It is unique - there is only one answer Disadvantages: Not as popular as mean
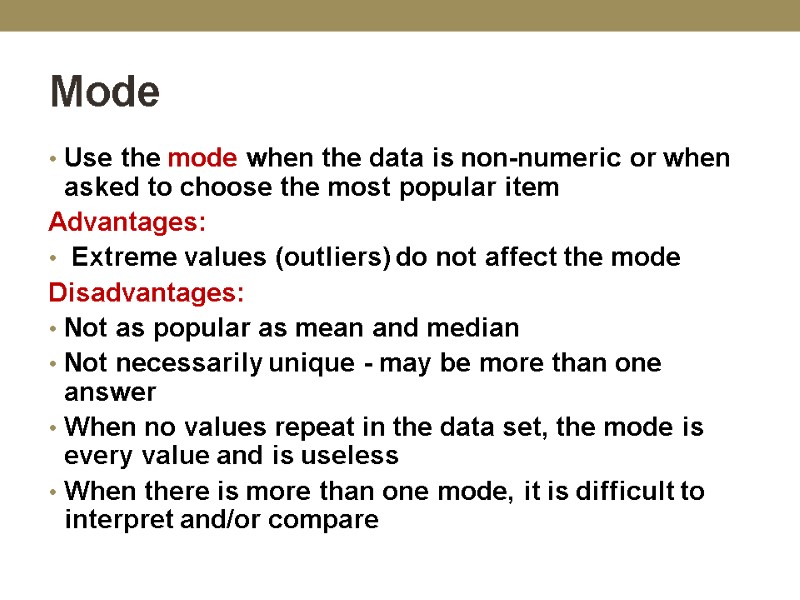
Mode Use the mode when the data is non-numeric or when asked to choose the most popular item Advantages: Extreme values (outliers) do not affect the mode Disadvantages: Not as popular as mean and median Not necessarily unique - may be more than one answer When no values repeat in the data set, the mode is every value and is useless When there is more than one mode, it is difficult to interpret and/or compare
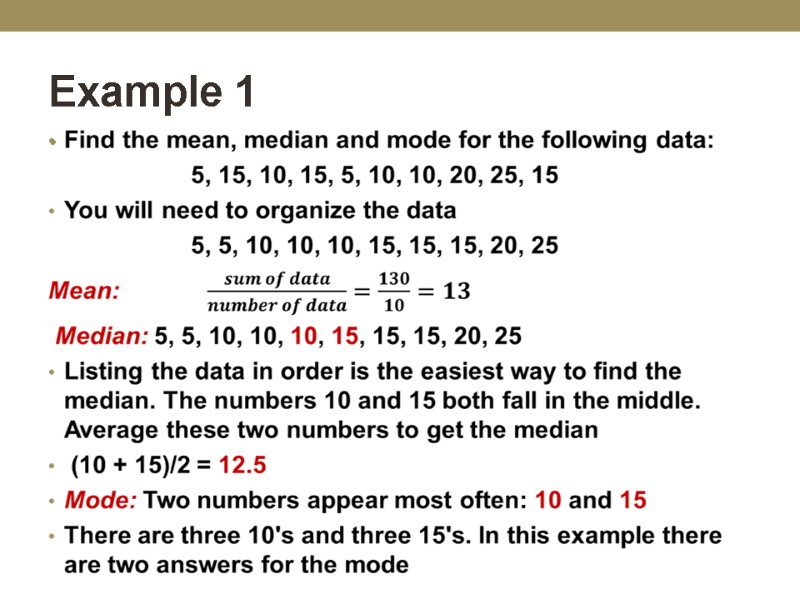
Example 1
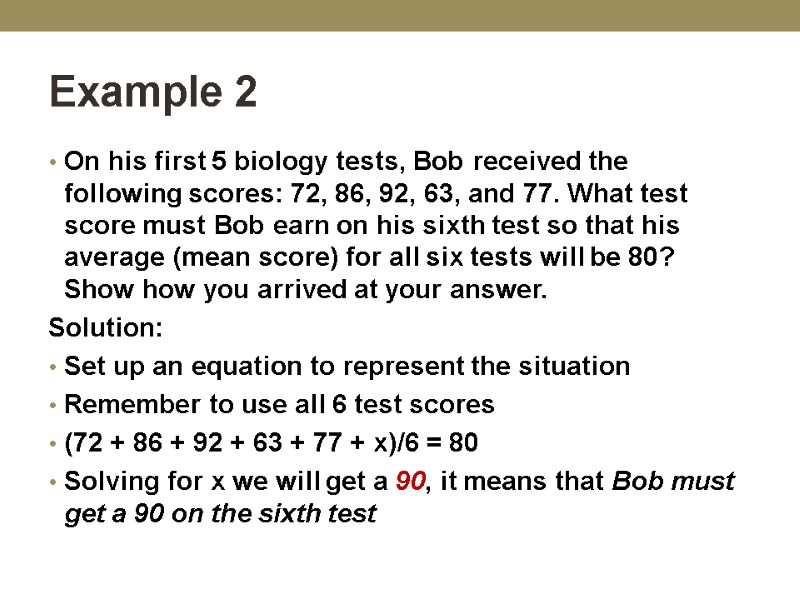
Example 2 On his first 5 biology tests, Bob received the following scores: 72, 86, 92, 63, and 77. What test score must Bob earn on his sixth test so that his average (mean score) for all six tests will be 80? Show how you arrived at your answer. Solution: Set up an equation to represent the situation Remember to use all 6 test scores (72 + 86 + 92 + 63 + 77 + x)/6 = 80 Solving for x we will get a 90, it means that Bob must get a 90 on the sixth test
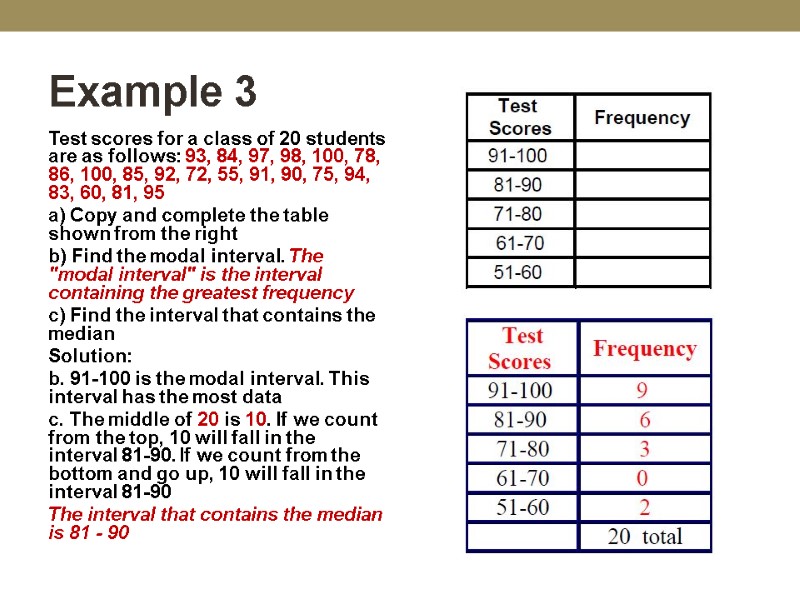
Example 3 Test scores for a class of 20 students are as follows: 93, 84, 97, 98, 100, 78, 86, 100, 85, 92, 72, 55, 91, 90, 75, 94, 83, 60, 81, 95 a) Copy and complete the table shown from the right b) Find the modal interval. The "modal interval" is the interval containing the greatest frequency c) Find the interval that contains the median Solution: b. 91-100 is the modal interval. This interval has the most data c. The middle of 20 is 10. If we count from the top, 10 will fall in the interval 81-90. If we count from the bottom and go up, 10 will fall in the interval 81-90 The interval that contains the median is 81 - 90
Quartiles and Box and Whisker Plots When describing a set of data, without listing all of the values, we have seen that we can use measures of location such as the mean and median. It is also possible to get a sense of the data's distribution by examining a five statistical summary (or five number summay), (1) minimum (2) maximum (3) median (or second quartile) (4) the first quartile (5) the third quartile Such information will show the extent to which the data is located near the median or near the extremes
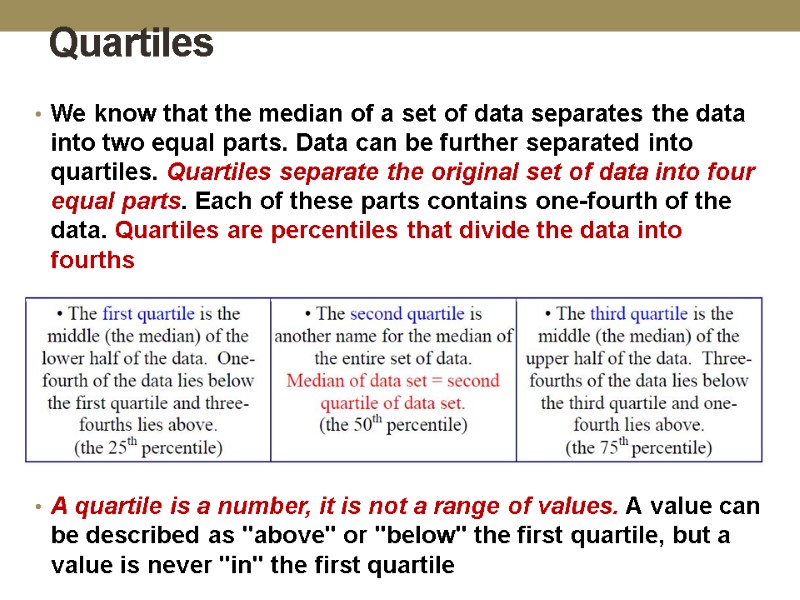
Quartiles We know that the median of a set of data separates the data into two equal parts. Data can be further separated into quartiles. Quartiles separate the original set of data into four equal parts. Each of these parts contains one-fourth of the data. Quartiles are percentiles that divide the data into fourths A quartile is a number, it is not a range of values. A value can be described as "above" or "below" the first quartile, but a value is never "in" the first quartile
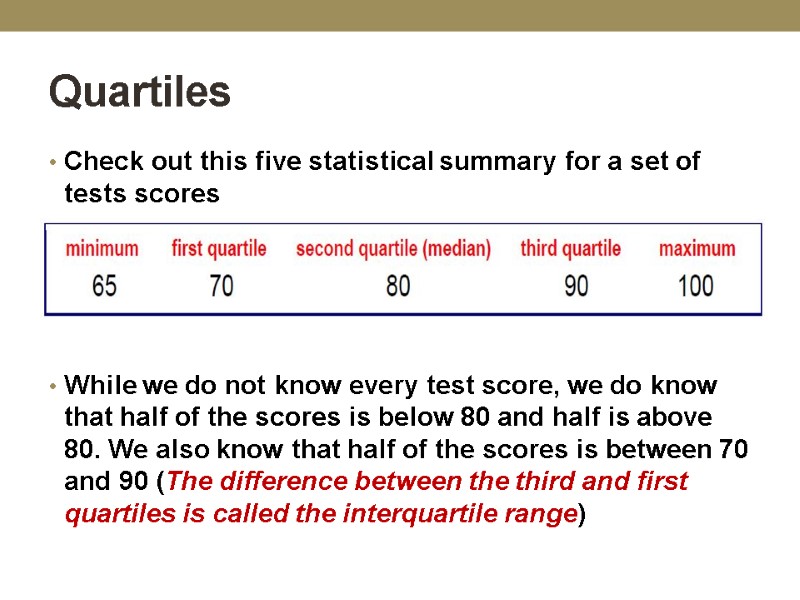
Quartiles Check out this five statistical summary for a set of tests scores While we do not know every test score, we do know that half of the scores is below 80 and half is above 80. We also know that half of the scores is between 70 and 90 (The difference between the third and first quartiles is called the interquartile range)
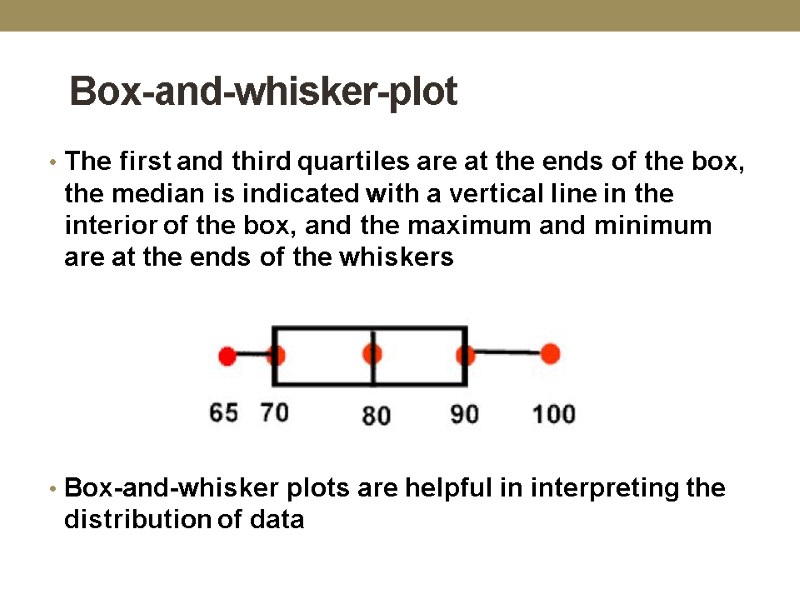
Box-and-whisker-plot The first and third quartiles are at the ends of the box, the median is indicated with a vertical line in the interior of the box, and the maximum and minimum are at the ends of the whiskers Box-and-whisker plots are helpful in interpreting the distribution of data
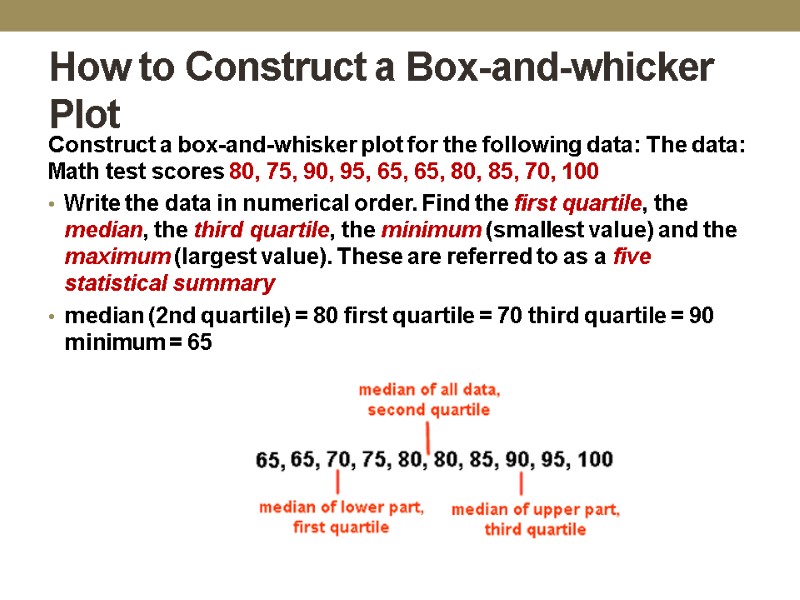
How to Construct a Box-and-whicker Plot Construct a box-and-whisker plot for the following data: The data: Math test scores 80, 75, 90, 95, 65, 65, 80, 85, 70, 100 Write the data in numerical order. Find the first quartile, the median, the third quartile, the minimum (smallest value) and the maximum (largest value). These are referred to as a five statistical summary median (2nd quartile) = 80 first quartile = 70 third quartile = 90 minimum = 65
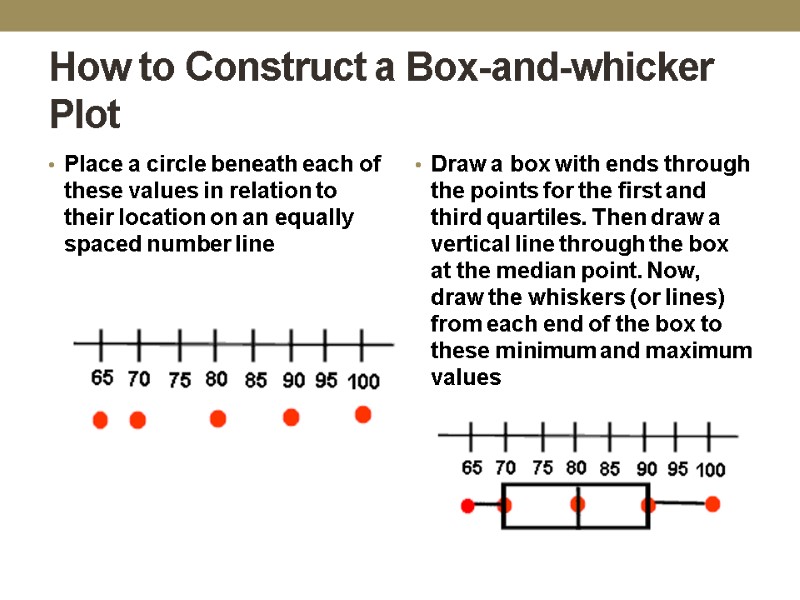
How to Construct a Box-and-whicker Plot Place a circle beneath each of these values in relation to their location on an equally spaced number line Draw a box with ends through the points for the first and third quartiles. Then draw a vertical line through the box at the median point. Now, draw the whiskers (or lines) from each end of the box to these minimum and maximum values
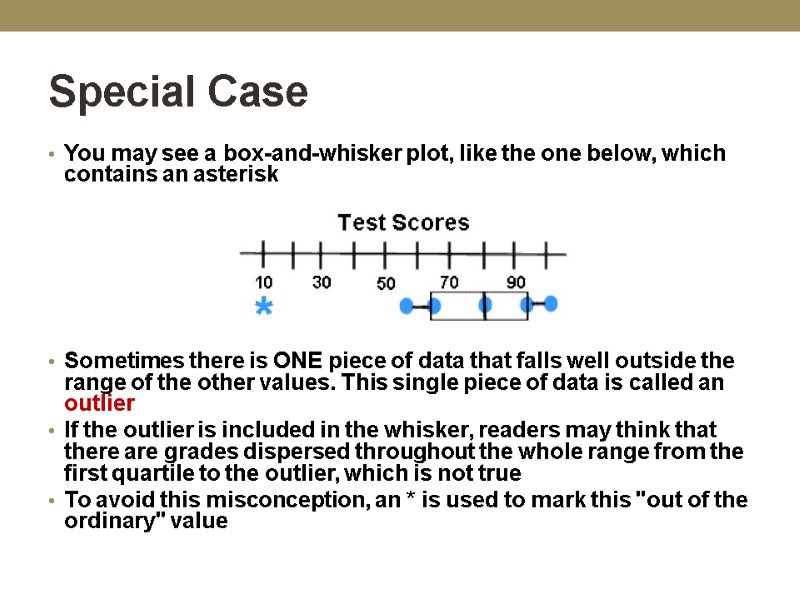
Special Case You may see a box-and-whisker plot, like the one below, which contains an asterisk Sometimes there is ONE piece of data that falls well outside the range of the other values. This single piece of data is called an outlier If the outlier is included in the whisker, readers may think that there are grades dispersed throughout the whole range from the first quartile to the outlier, which is not true To avoid this misconception, an * is used to mark this "out of the ordinary" value
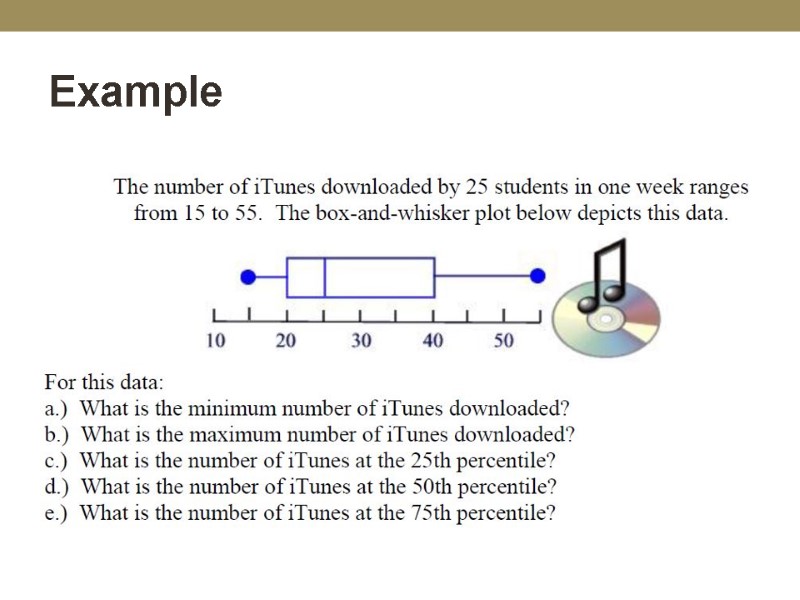
Example
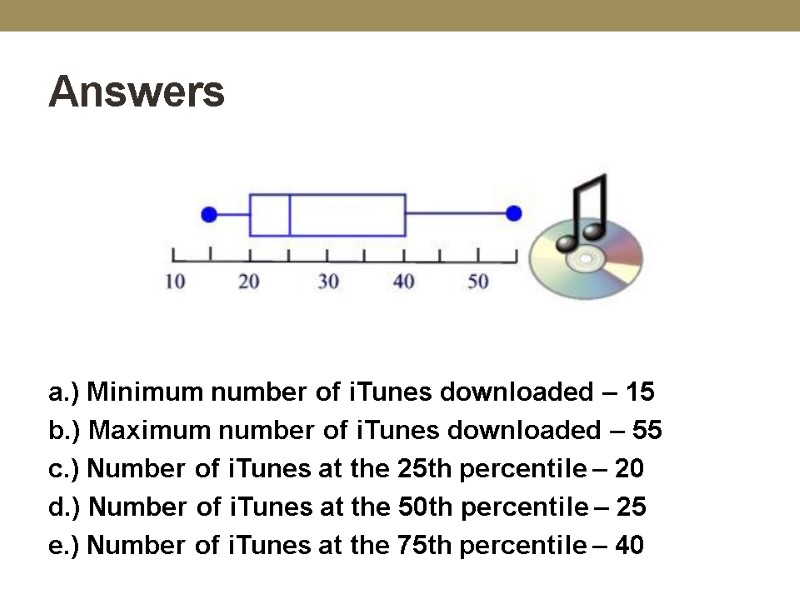
Answers a.) Minimum number of iTunes downloaded – 15 b.) Maximum number of iTunes downloaded – 55 c.) Number of iTunes at the 25th percentile – 20 d.) Number of iTunes at the 50th percentile – 25 e.) Number of iTunes at the 75th percentile – 40
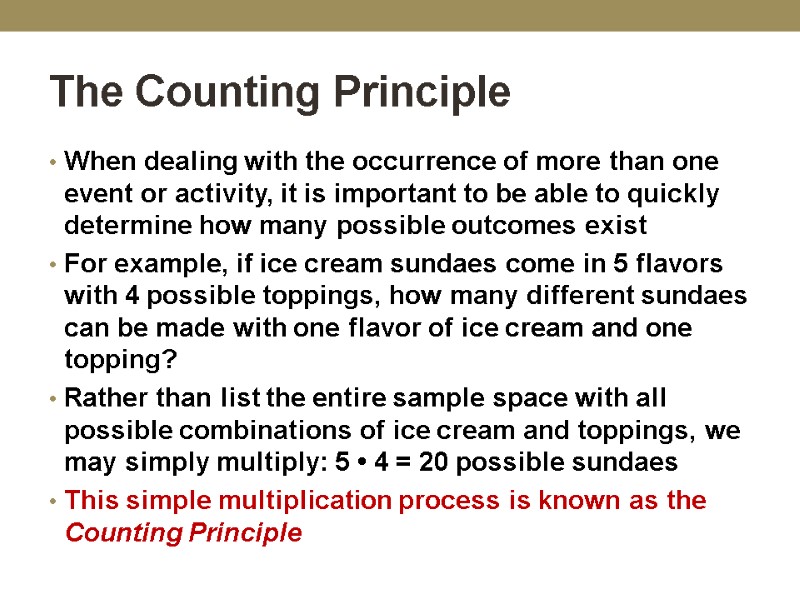
The Counting Principle When dealing with the occurrence of more than one event or activity, it is important to be able to quickly determine how many possible outcomes exist For example, if ice cream sundaes come in 5 flavors with 4 possible toppings, how many different sundaes can be made with one flavor of ice cream and one topping? Rather than list the entire sample space with all possible combinations of ice cream and toppings, we may simply multiply: 5 • 4 = 20 possible sundaes This simple multiplication process is known as the Counting Principle
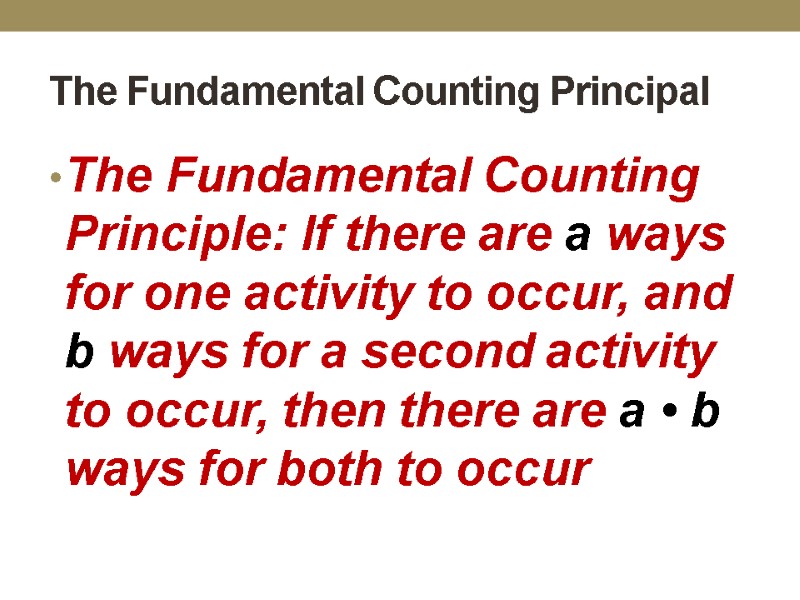
The Fundamental Counting Principal The Fundamental Counting Principle: If there are a ways for one activity to occur, and b ways for a second activity to occur, then there are a • b ways for both to occur
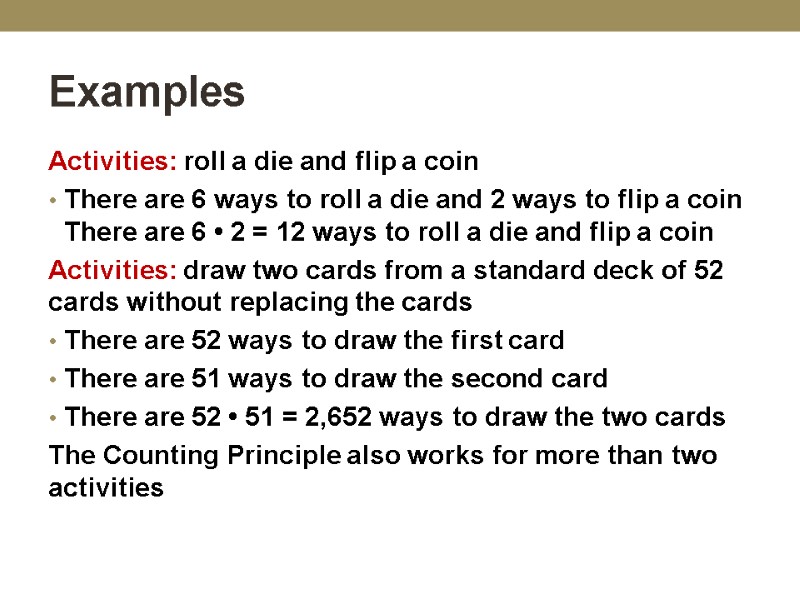
Examples Activities: roll a die and flip a coin There are 6 ways to roll a die and 2 ways to flip a coin There are 6 • 2 = 12 ways to roll a die and flip a coin Activities: draw two cards from a standard deck of 52 cards without replacing the cards There are 52 ways to draw the first card There are 51 ways to draw the second card There are 52 • 51 = 2,652 ways to draw the two cards The Counting Principle also works for more than two activities
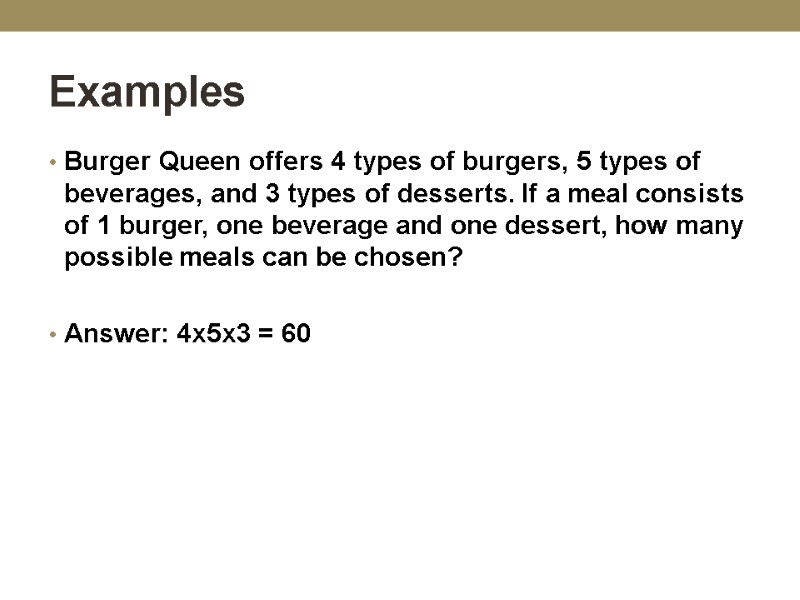
Examples Burger Queen offers 4 types of burgers, 5 types of beverages, and 3 types of desserts. If a meal consists of 1 burger, one beverage and one dessert, how many possible meals can be chosen? Answer: 4x5x3 = 60
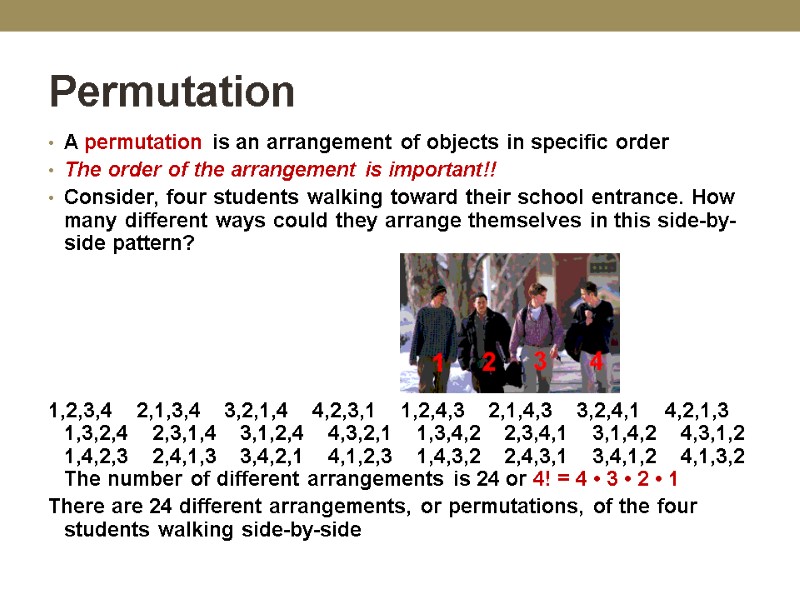
Permutation A permutation is an arrangement of objects in specific order The order of the arrangement is important!! Consider, four students walking toward their school entrance. How many different ways could they arrange themselves in this side-by-side pattern? 1,2,3,4 2,1,3,4 3,2,1,4 4,2,3,1 1,2,4,3 2,1,4,3 3,2,4,1 4,2,1,3 1,3,2,4 2,3,1,4 3,1,2,4 4,3,2,1 1,3,4,2 2,3,4,1 3,1,4,2 4,3,1,2 1,4,2,3 2,4,1,3 3,4,2,1 4,1,2,3 1,4,3,2 2,4,3,1 3,4,1,2 4,1,3,2 The number of different arrangements is 24 or 4! = 4 • 3 • 2 • 1 There are 24 different arrangements, or permutations, of the four students walking side-by-side
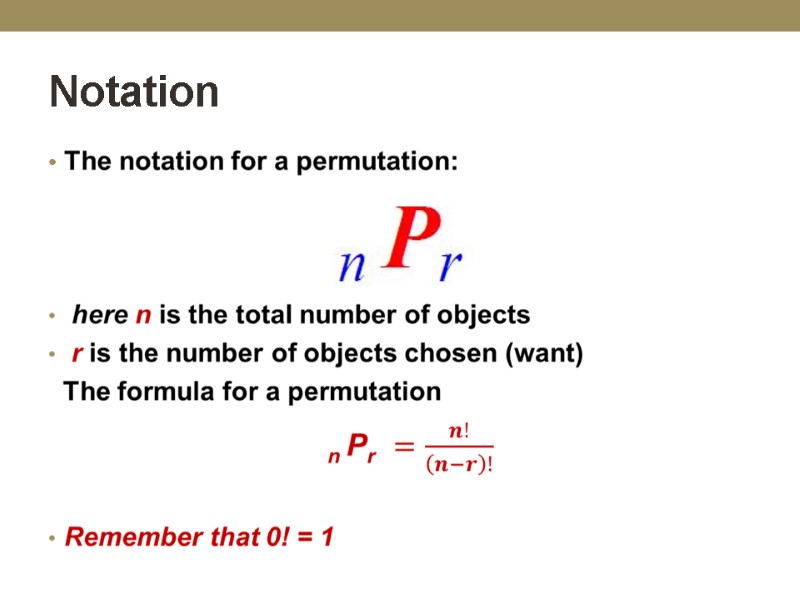
Notation
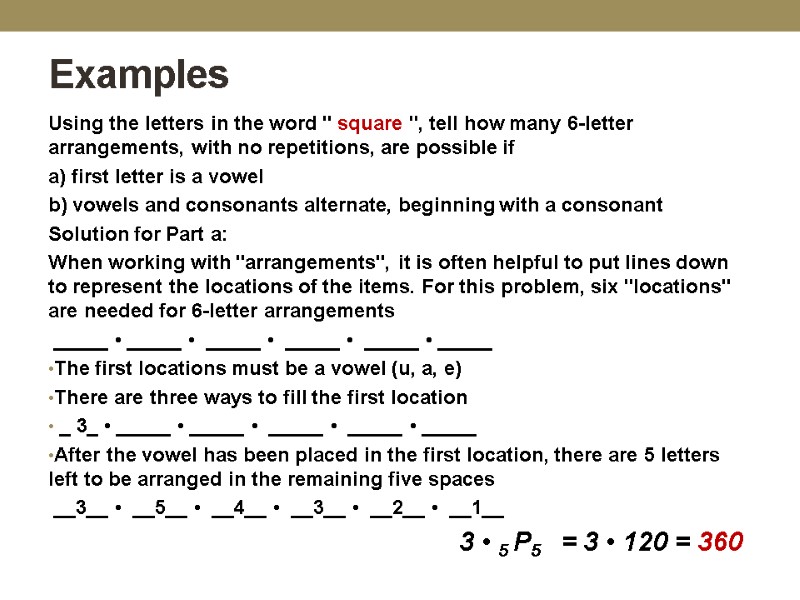
Examples Using the letters in the word " square ", tell how many 6-letter arrangements, with no repetitions, are possible if a) first letter is a vowel b) vowels and consonants alternate, beginning with a consonant Solution for Part a: When working with "arrangements", it is often helpful to put lines down to represent the locations of the items. For this problem, six "locations" are needed for 6-letter arrangements _____ • _____ • _____ • _____ • _____ • _____ The first locations must be a vowel (u, a, e) There are three ways to fill the first location _ 3_ • _____ • _____ • _____ • _____ • _____ After the vowel has been placed in the first location, there are 5 letters left to be arranged in the remaining five spaces __3__ • __5__ • __4__ • __3__ • __2__ • __1__ 3 • 5 P5 = 3 • 120 = 360
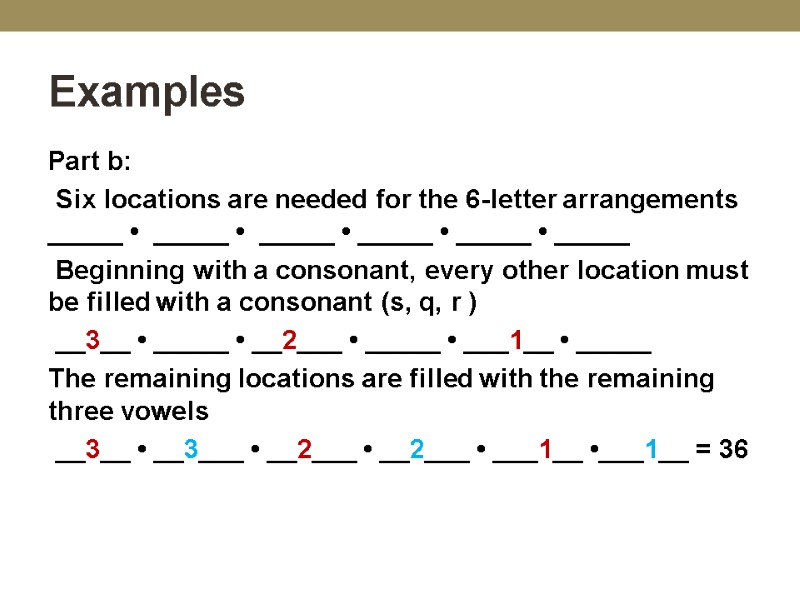
Examples Part b: Six locations are needed for the 6-letter arrangements _____ • _____ • _____ • _____ • _____ • _____ Beginning with a consonant, every other location must be filled with a consonant (s, q, r ) __3__ • _____ • __2___ • _____ • ___1__ • _____ The remaining locations are filled with the remaining three vowels __3__ • __3___ • __2___ • __2___ • ___1__ •___1__ = 36
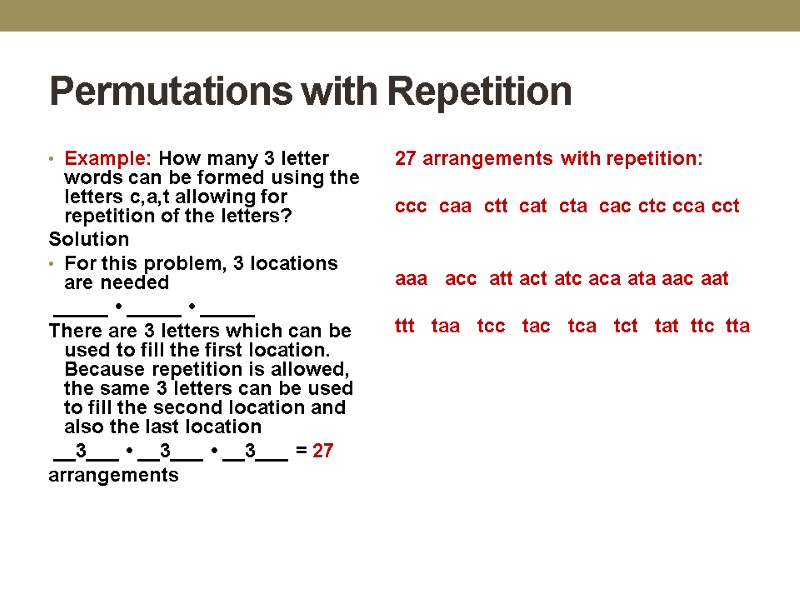
Permutations with Repetition Example: How many 3 letter words can be formed using the letters c,a,t allowing for repetition of the letters? Solution For this problem, 3 locations are needed _____ • _____ • _____ There are 3 letters which can be used to fill the first location. Because repetition is allowed, the same 3 letters can be used to fill the second location and also the last location __3___ • __3___ • __3___ = 27 arrangements 27 arrangements with repetition: ccc caa ctt cat cta cac ctc cca cct aaa acc att act atc aca ata aac aat ttt taa tcc tac tca tct tat ttc tta
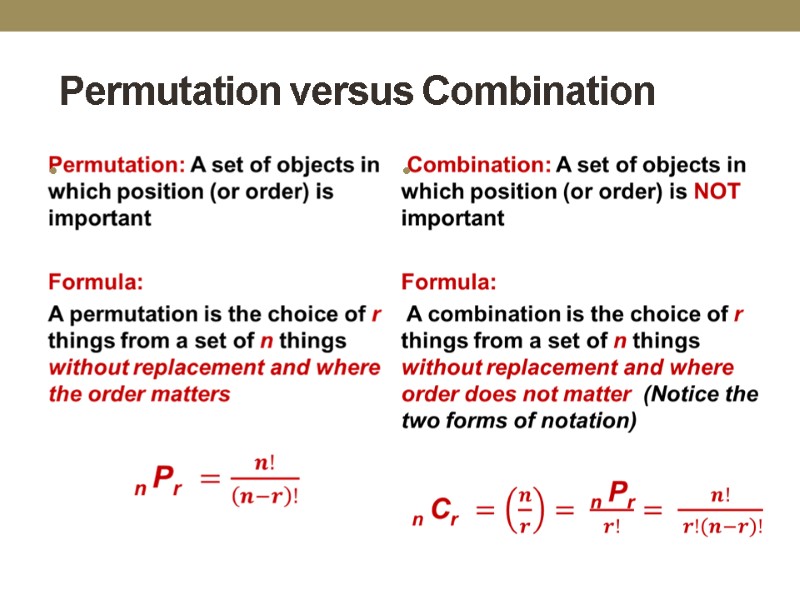
Permutation versus Combination
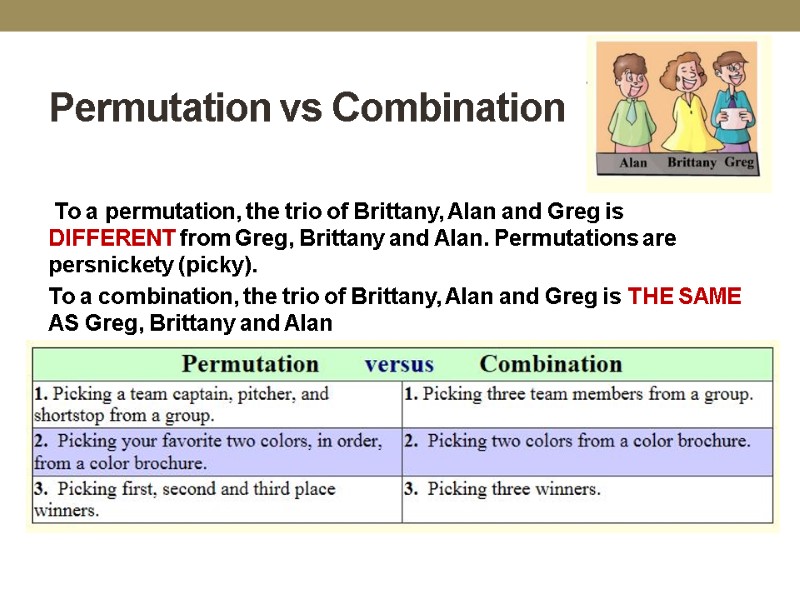
Permutation vs Combination To a permutation, the trio of Brittany, Alan and Greg is DIFFERENT from Greg, Brittany and Alan. Permutations are persnickety (picky). To a combination, the trio of Brittany, Alan and Greg is THE SAME AS Greg, Brittany and Alan
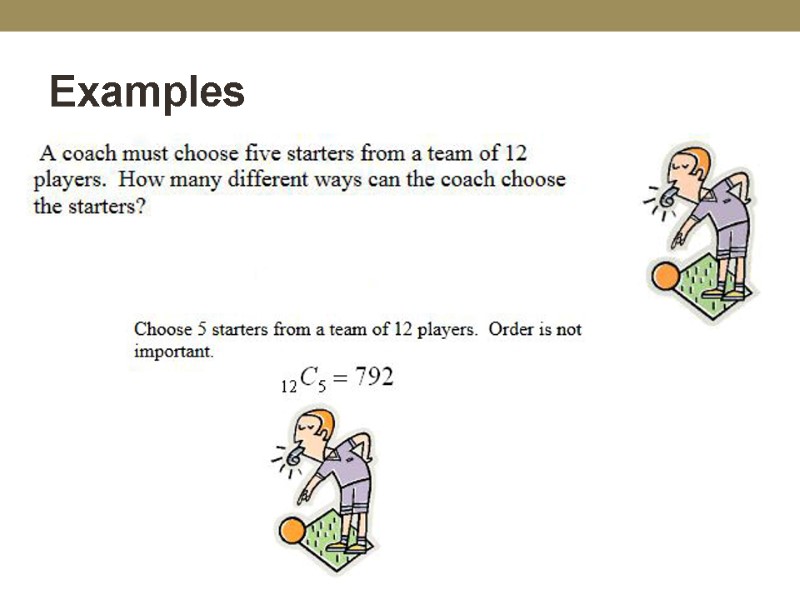
Examples
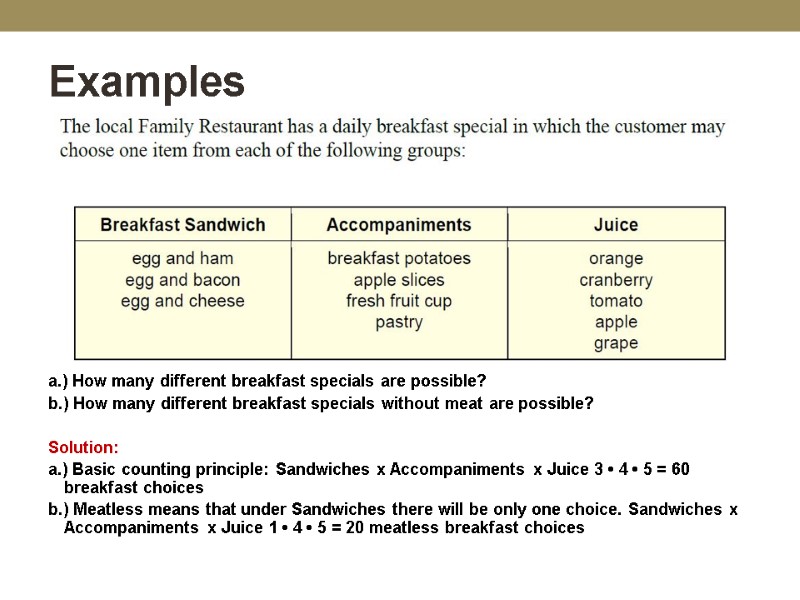
Examples a.) How many different breakfast specials are possible? b.) How many different breakfast specials without meat are possible? Solution: a.) Basic counting principle: Sandwiches x Accompaniments x Juice 3 • 4 • 5 = 60 breakfast choices b.) Meatless means that under Sandwiches there will be only one choice. Sandwiches x Accompaniments x Juice 1 • 4 • 5 = 20 meatless breakfast choices
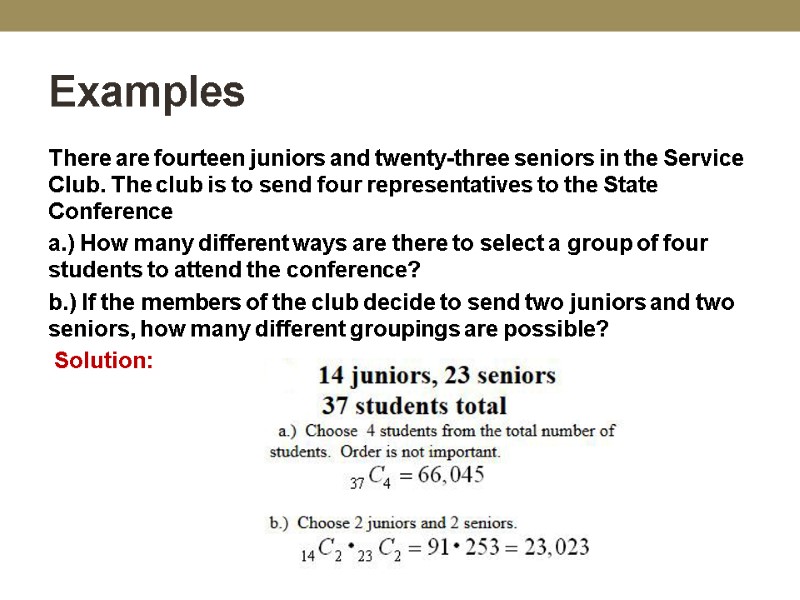
Examples There are fourteen juniors and twenty-three seniors in the Service Club. The club is to send four representatives to the State Conference a.) How many different ways are there to select a group of four students to attend the conference? b.) If the members of the club decide to send two juniors and two seniors, how many different groupings are possible? Solution:
Probability and Permutations
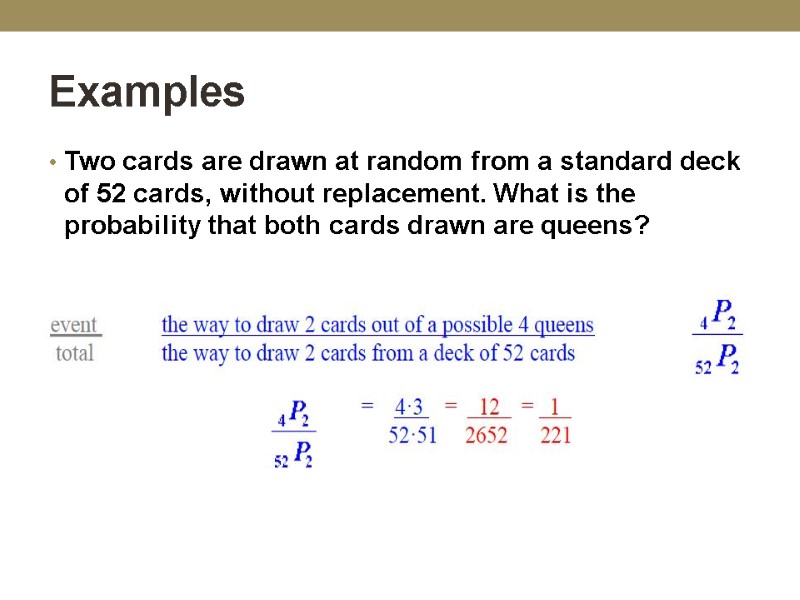
Examples Two cards are drawn at random from a standard deck of 52 cards, without replacement. What is the probability that both cards drawn are queens?
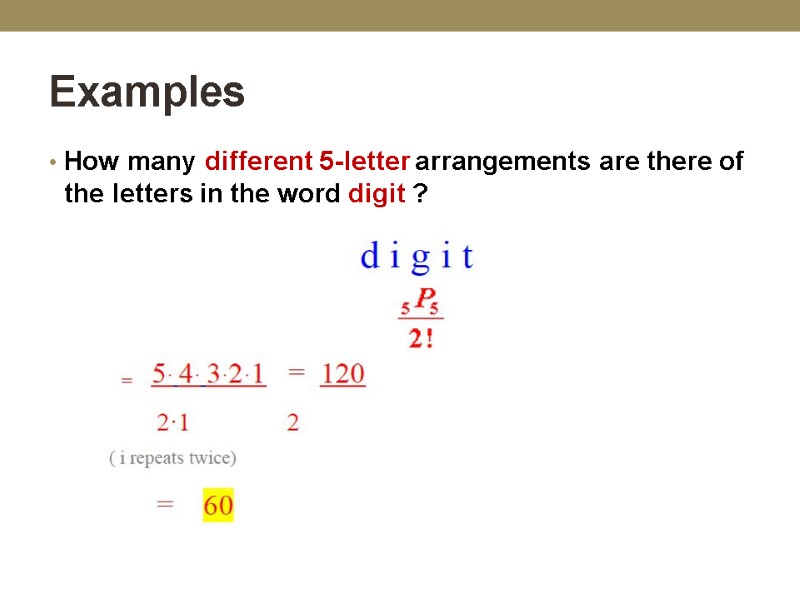
Examples How many different 5-letter arrangements are there of the letters in the word digit ?
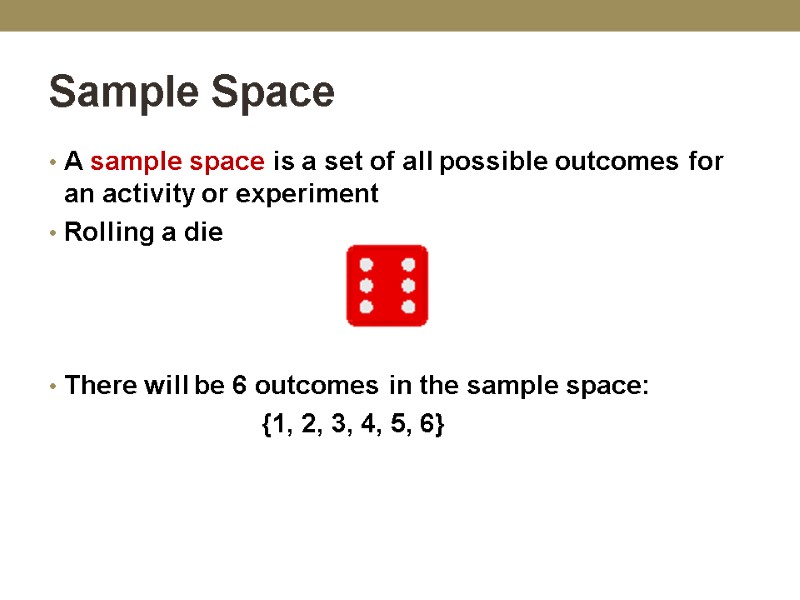
Sample Space A sample space is a set of all possible outcomes for an activity or experiment Rolling a die There will be 6 outcomes in the sample space: {1, 2, 3, 4, 5, 6}
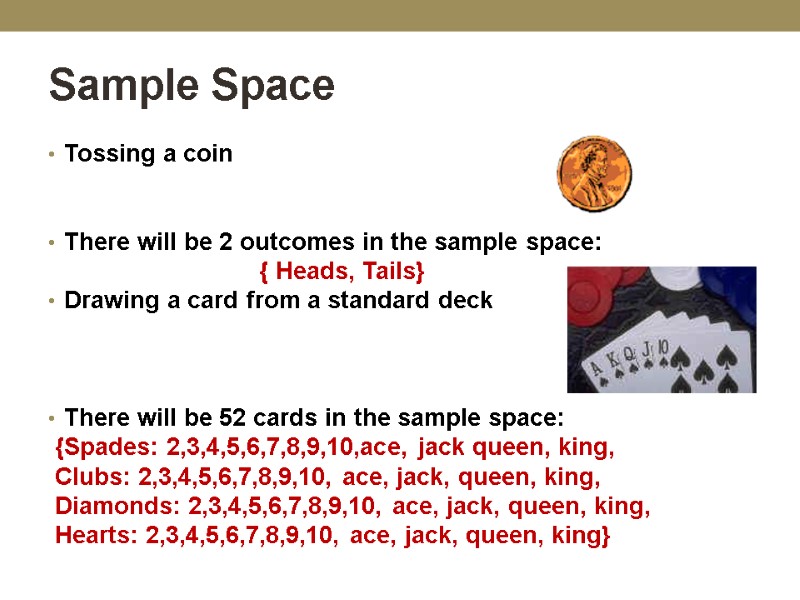
Sample Space Tossing a coin There will be 2 outcomes in the sample space: { Heads, Tails} Drawing a card from a standard deck There will be 52 cards in the sample space: {Spades: 2,3,4,5,6,7,8,9,10,ace, jack queen, king, Clubs: 2,3,4,5,6,7,8,9,10, ace, jack, queen, king, Diamonds: 2,3,4,5,6,7,8,9,10, ace, jack, queen, king, Hearts: 2,3,4,5,6,7,8,9,10, ace, jack, queen, king}
Tree Diagrams When attempting to determine a sample space (the possible outcomes from an experiment), it is often helpful to draw a diagram which illustrates how to arrive at the answer. One such diagram is a tree diagram In addition to helping determine the number of outcomes in a sample space, the tree diagram can be used to determine the probability of individual outcomes within the sample space The probability of any outcome in the sample space is the product (multiply) of all possibilities along the path that represents that outcome on the tree diagram
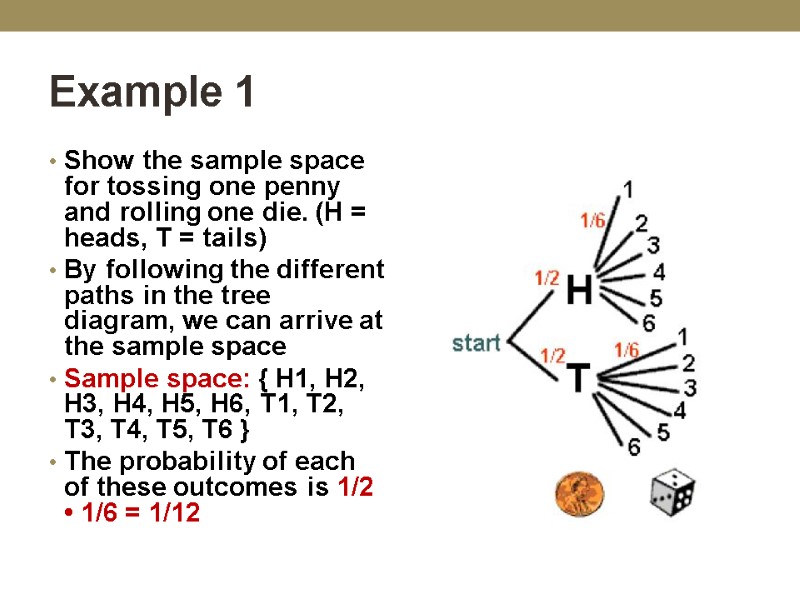
Example 1 Show the sample space for tossing one penny and rolling one die. (H = heads, T = tails) By following the different paths in the tree diagram, we can arrive at the sample space Sample space: { H1, H2, H3, H4, H5, H6, T1, T2, T3, T4, T5, T6 } The probability of each of these outcomes is 1/2 • 1/6 = 1/12
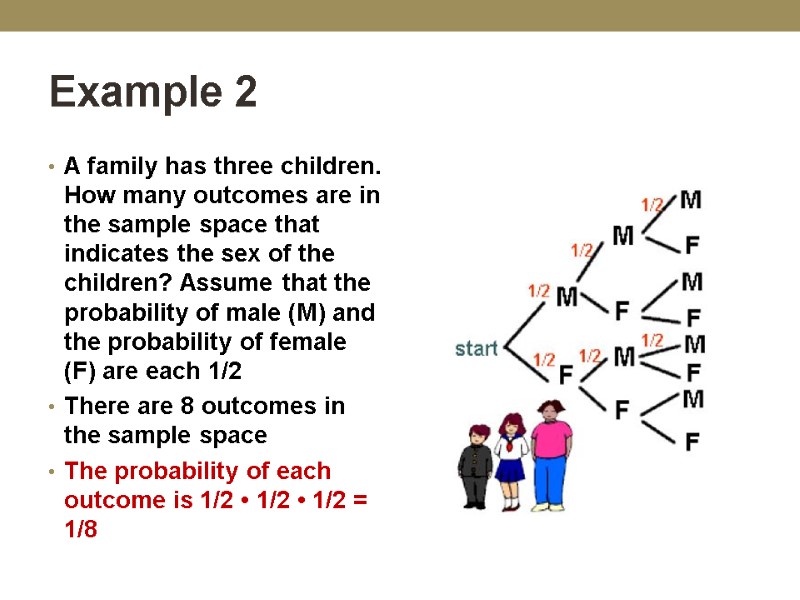
Example 2 A family has three children. How many outcomes are in the sample space that indicates the sex of the children? Assume that the probability of male (M) and the probability of female (F) are each 1/2 There are 8 outcomes in the sample space The probability of each outcome is 1/2 • 1/2 • 1/2 = 1/8
Theoretical vs Empirical Probability Probability describes the chance that an uncertain event will occur Empirical Probability of an event is an "estimate" that the event will happen based on how often the event occurs after collecting data or running an experiment (in a large number of trials). It is based specifically on direct observations or experiences Theoretical Probability of an event is the number of ways that the event can occur, divided by the total number of outcomes. It is finding the probability of events that come from a sample space of known equally likely outcomes
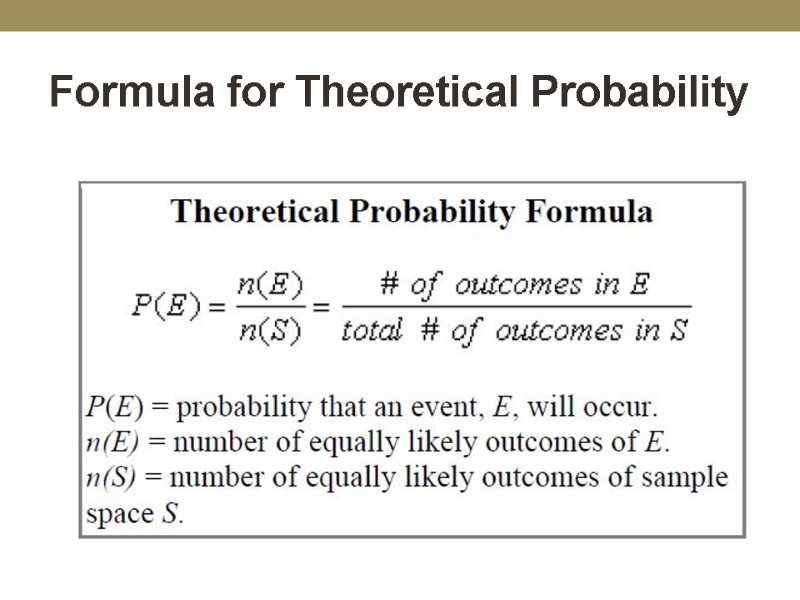
Formula for Theoretical Probability
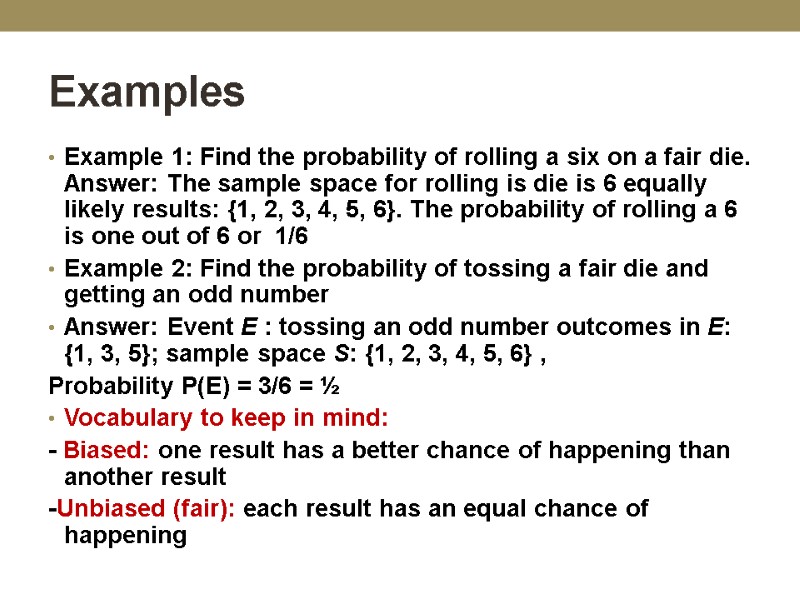
Examples Example 1: Find the probability of rolling a six on a fair die. Answer: The sample space for rolling is die is 6 equally likely results: {1, 2, 3, 4, 5, 6}. The probability of rolling a 6 is one out of 6 or 1/6 Example 2: Find the probability of tossing a fair die and getting an odd number Answer: Event E : tossing an odd number outcomes in E: {1, 3, 5}; sample space S: {1, 2, 3, 4, 5, 6} , Probability P(E) = 3/6 = ½ Vocabulary to keep in mind: - Biased: one result has a better chance of happening than another result -Unbiased (fair): each result has an equal chance of happening
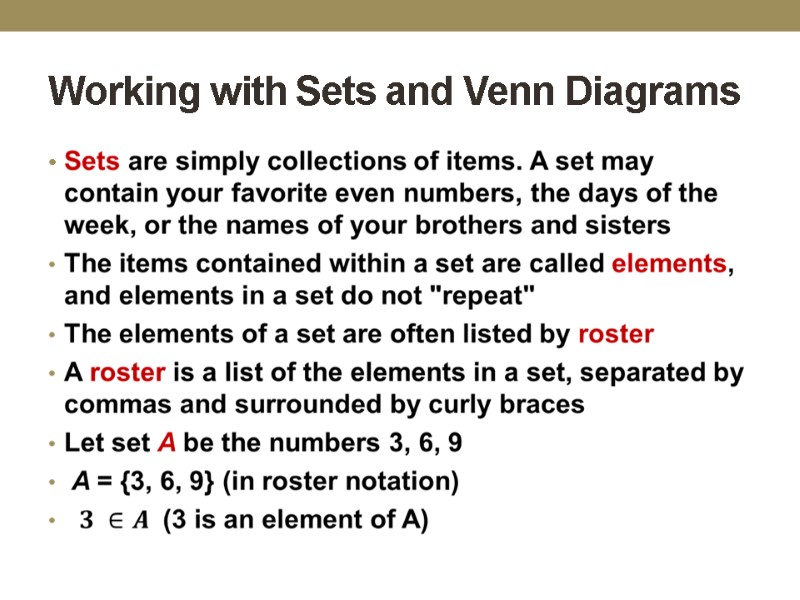
Working with Sets and Venn Diagrams
Working with Sets and Venn Diagrams
A Venn Diagram A Venn diagram is a drawing, in which circular areas represent groups of items usually sharing common properties. The drawing consists of two or more circles, each representing a specific group or set. This process of visualizing logical relationships was devised by John Venn (1834-1923).
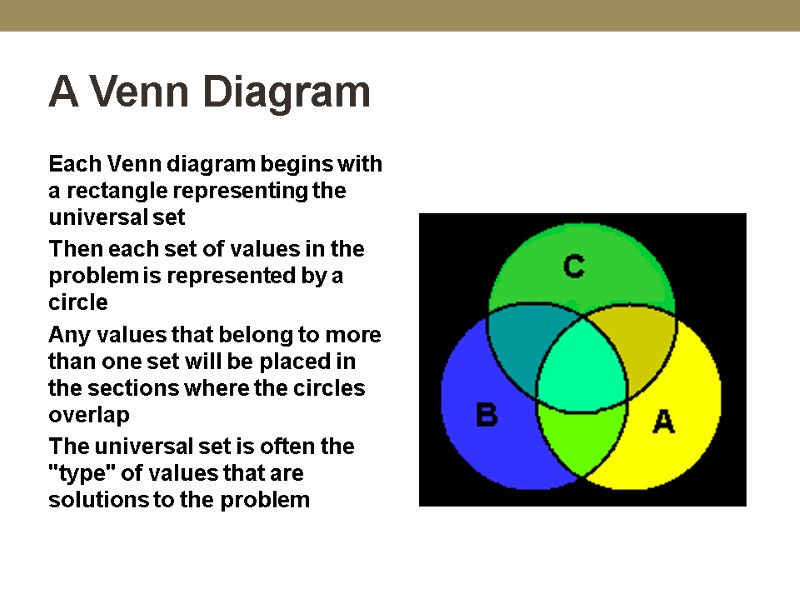
A Venn Diagram Each Venn diagram begins with a rectangle representing the universal set Then each set of values in the problem is represented by a circle Any values that belong to more than one set will be placed in the sections where the circles overlap The universal set is often the "type" of values that are solutions to the problem
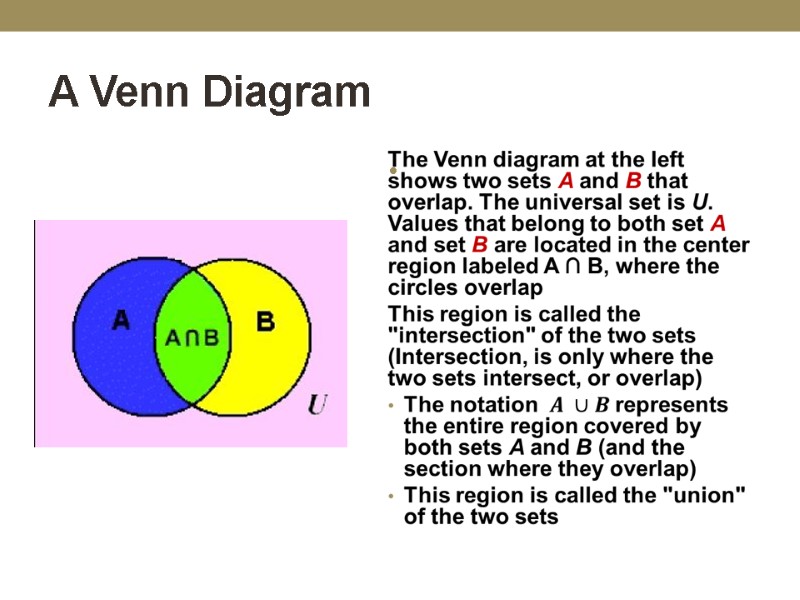
A Venn Diagram
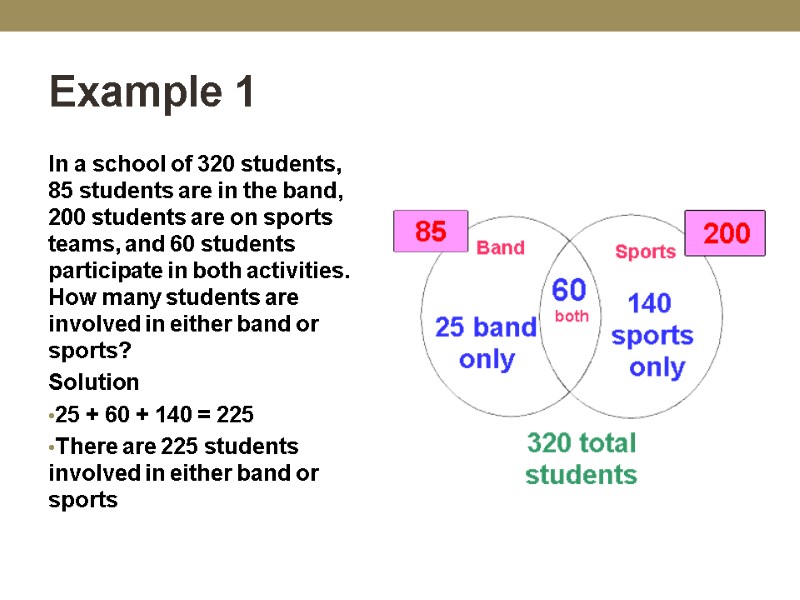
Example 1 In a school of 320 students, 85 students are in the band, 200 students are on sports teams, and 60 students participate in both activities. How many students are involved in either band or sports? Solution 25 + 60 + 140 = 225 There are 225 students involved in either band or sports
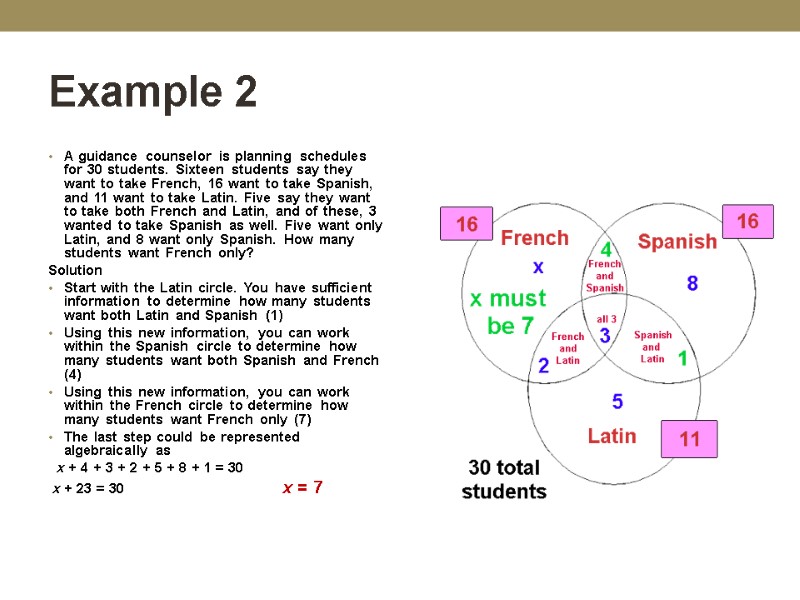
Example 2 A guidance counselor is planning schedules for 30 students. Sixteen students say they want to take French, 16 want to take Spanish, and 11 want to take Latin. Five say they want to take both French and Latin, and of these, 3 wanted to take Spanish as well. Five want only Latin, and 8 want only Spanish. How many students want French only? Solution Start with the Latin circle. You have sufficient information to determine how many students want both Latin and Spanish (1) Using this new information, you can work within the Spanish circle to determine how many students want both Spanish and French (4) Using this new information, you can work within the French circle to determine how many students want French only (7) The last step could be represented algebraically as x + 4 + 3 + 2 + 5 + 8 + 1 = 30 x + 23 = 30 x = 7
14266-sat__math__topics.ppt
- Количество слайдов: 51

