
Saint-Petersburg State University University of Stavanger “Joint Norwegian-Russian


Saint-Petersburg State University University of Stavanger “Joint Norwegian-Russian Master of Science program in Geoecological monitoring and rational use of natural resources in the Northern oil and gas production regions”

Lesson 10 The Ecological Monitoring of Plants Quality and Vegetation Condition
 monitoring in inaccessible region and without posts of ecological monitoring observations (Local")
Geoecological (environmental) monitoring in inaccessible region and without posts of ecological monitoring observations (Local level of monitoring) New ecosystem approach to study nature in complex integration of its components Study geoindicators and bioindicators of anthropogenic load

Bioindication method allows to value complex anthropogenic influence and its ecological consequences in natural and technogenically damaged landscapes.

According to the organizational levels of biological systems there are determined the levels of biological indication. Six levels of bioindication are given in the book "Bioindication of contamination of terrestrial ecosystems" (ed. R. Schubert, 1988): Biochemical and physiological reactions. Anatomic, morphological, biorhythmic and behavioral deviations. Floristic, faunistic and chorological changes. Microbiological, zoo- and phytocenotic changes. Biogeocenosis changes . Landscape changes.
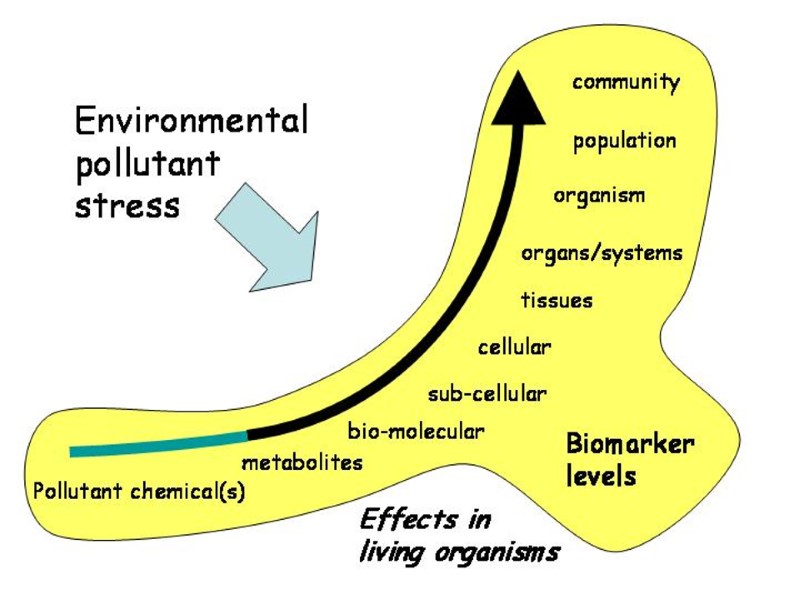

Pollutant exposure Later- effects Early- effects Chemical exposure Biochemical responses Ecosystem change Chain of events… At different levels of biological organisation Techniques and tools & The biomarker consept

Now many methods of environmental state estimation using plants from molecular up to a landscape level have been designed. They are supported by carrying out field and laboratory research

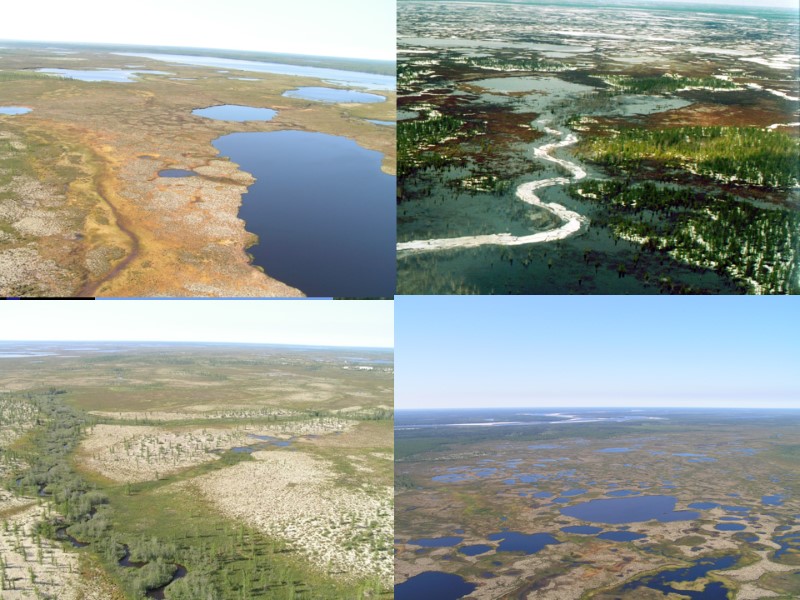
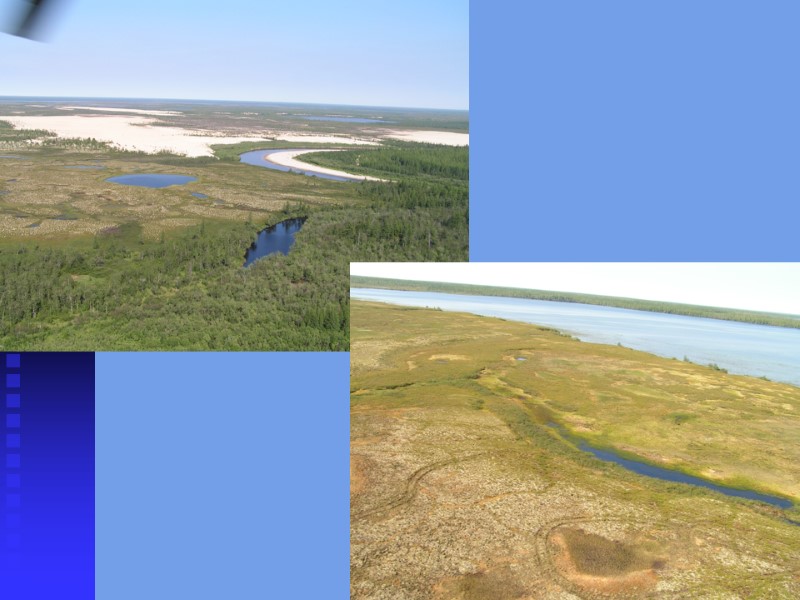
Phytoindication of ecological state of tundra ecosystems Phytoindication is the method of investigation of habitat’s components using plants and vegetation

The basic attention is given to: Pollution of the plants Changing species diversity Disturbance of vegetation

The chemical composition of indicator-plants is the specific indicator of anthropogenic environmental pollution

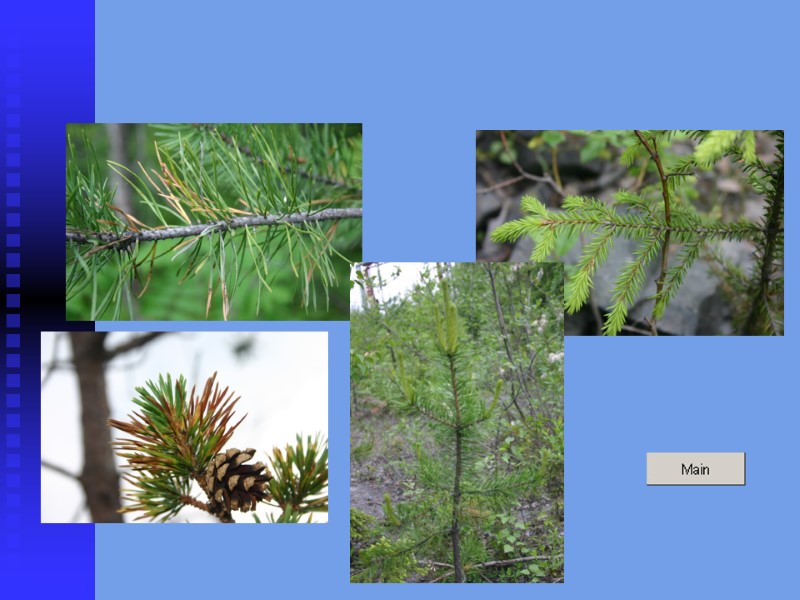
BIOINDICATION of ecological state of Urengoy tundra ecosystems by – Larix sibirica L. – Cladonia alpestris (L.) Rubh., – Ledum decumbens (Ait.) Lodd. ex Steud. – Vaccinium vitis-idaea L.

Larix sibirica L. Cladonia alpestris (L.) Rubh. Ledum decumbens (Ait.) Lodd. ex Steud. Vaccinium vitis-idaea L.

The list of laboratory analyses of indicator-plants * - Cu, Zn, Ni, Co, Pb, Cd, V, Mn, Ba, Cr, Hg

Content of chemical elements in plants of Samburgskoe petroleum field, mg/kg dry weight / ppm

The regional geochemical background of plants The rule of calculation of the regional geochemical background х + , where х – average arithmetic, – standard deviation Anomaly concentration х + 2 High anomaly concentration х + 3

The regional geochemical background of plants of Samburgskoe petroleum field, mg/kg dry weight

Method of the main component of the factorial analysis

Anatomic, morphological, biorhythmic and behavioral deviations

Taxation scales of necrosises and chlorosises Nicotiana Tabacum Tilia cordata Pinus sylvestris

Chlorosises and necrosises forms
")
The result of influence of acid rains in Monchegorsk-region (Kola peninsula)
 of plants as a bioindicators of pollution")
Ugly forms (terrates) of plants as a bioindicators of pollution

Ugly forms

Russia plays a specific role in the maintenance of the Arctic ecosystems on the Earth and their specific biological diversity. Species diversity

About one third of the whole area of the Arctic Region is situated within the Russian sector. There are territories displaying the typical features of the Arctic zonal complexes of ecosystems.

Russia comprises about 80% of total species diversity of the Arctic Regions and about 90% of true Arctic species live in Russia.

Observed arctic vegetation dynamics (modified from Kaplan et al., 2003 and Callaghan et al., 2005).

Spatial distribution of trends of photosynthetic activity across the northern high latitudes from May to August 1981 through 2005. Significant positive trends in photosynthetic activity are shown in green, and negative trends are shown in rust.

Distribution of Russian terrestrial vegetation by land class and bio-climatic zone Note: Abbreviations used in Table are: a – (land classes) G&ShL - grassland and shrubs. b – (fractions of vegetation organic matter) AGB - above ground live biomass (phytomass), CWD-coarse woody debris (on-ground and above-ground dead wood with the diameter at the small end >1cm). c – (dominant tree species) L-larch, S-spruce, P-pine, B-birch, Cn-coniferous species, HD-hard deciduous species, SD - soft deciduous species. d – Coefficients of the species composition formulas indicate 0.1xPercent of a species in the total growing stock volume by a zone.

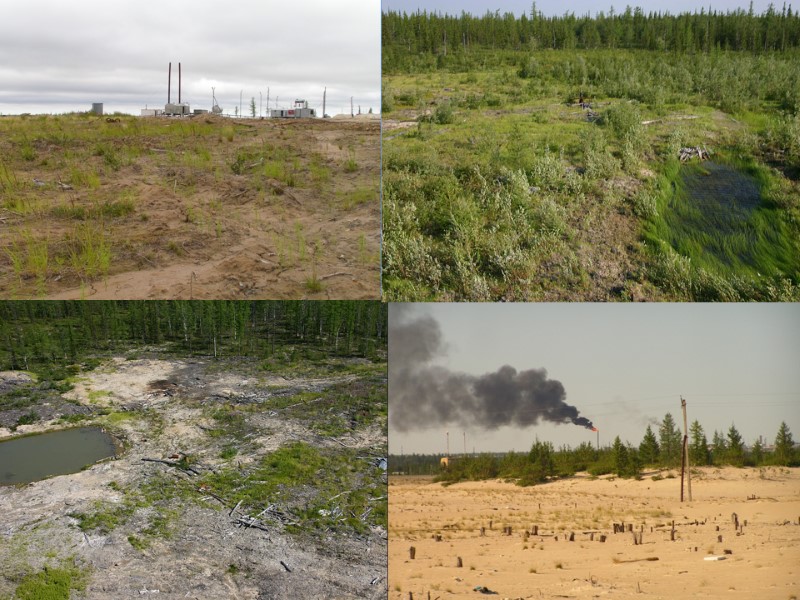
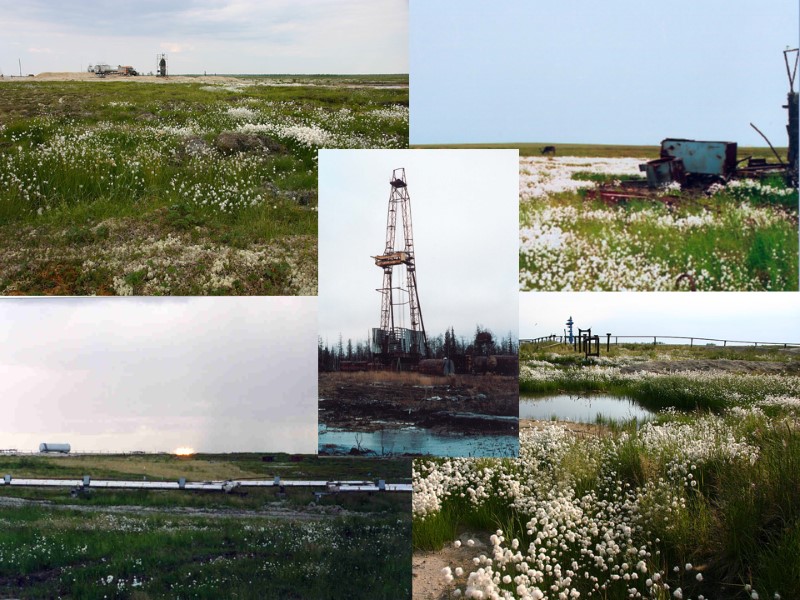
Disturbance of vegetation

The vegetation is reliable indicator of environmental condition

Landscape after the fire

Disturbance of vegetation cover Desertification
 Roshev., Arctagrostis latifolia (R.Br.) Greust. ,")
Secondary phytocenoses Festuca rubra L., Deschampsia borealis (Trautv.) Roshev., Arctagrostis latifolia (R.Br.) Greust. , Calamagrostis holmii

Disturbance of vegetation cover swamping of the territory

Secondary phytocenoses Rubus chamaemorus L. , Eryophorum brachyantherum Trautv.et Mey.

Vegetation Cover resistance to mechanical influence

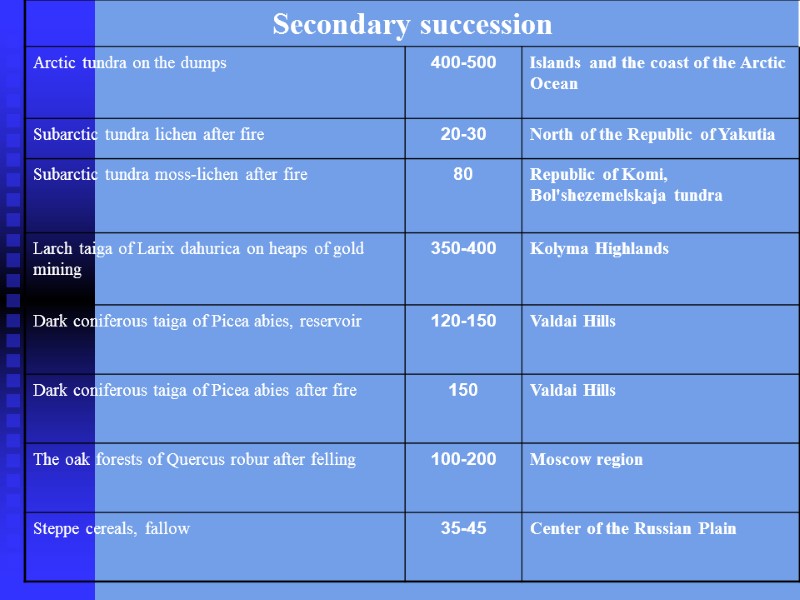
Some information about the duration of primary and secondary succession of natural ecosystems in Russia (Тишков, 1994)

Northern ecological systems depend on permafrost conditions. Permafrost controls plant communities and biomass production through soil temperature, active layer thickness, moisture content, presence of unfrozen water, and surface hydrology.

The changes in the permafrost thermal regime and active layer thickness can affect plant diversity and biomass.

The thawing of the ice-rich permafrost within the boreal forest biome can lead to destruction of the substrate and major changes in ecosystems. In case of the "wet thermokarst" scenario of permafrost degradation, changes can result in replacement of the boreal forest with wetlands.

In case of "dry thermokarst", the boreal forest ecosystems may be replaced by steppe-like habitats.
 will continuously improve conditions for the")
Long-term permafrost degradation (even without active thermokarst processes) will continuously improve conditions for the subsurface water drainage (especially in sandy soils) that will lead to increased dryness of soils, putting significant stress on vegetation.

Improved drainage conditions will also lead to shrinkage of numerous ponds within the degrading permafrost area dramatically affecting aquatic ecosystems (Yoshikawa and Hinzman, 2003).
")
Timescale of ecological processes in relation to disturbances (shown as breaks in horizontal lines) in the Arctic. The scheme does not show responses caused by anthropogenic climate change.

Most natural disturbances are directly or indirectly climatically driven and affected by climate changes, particularly in hydrologic regimes. The latter could be influenced by changes in either summer or winter precipitation patterns; increased temperature, which would melt ground ice; or changes in vegetation, which would affect evapotranspiration (the sum of evaporation and plant transpi-ration from the Earth's land surface to atmosphere ) and run-off.

Most anthropogenic disturbances are microscale phenomena, but cumulative impacts associated with large developments, such as the large Oil Field, have affected mesoscale regions, and global warming could affect the tundra ecosystem at the macroscale level.

In the Arctic, recovery of the vegetation following disturbance is particularly closely linked to recovery of the physical system because of the presence of permafrost.

Maps of terrain sensitivity to disturbance must consider the influence of ground ice and heat flux to the system following disturbance.

The impact of road-building on tundra hydrology and ecosystem structure.

Arctic landscapes are sensitive to geomorphic disturbances and communities once destroyed are difficult to restore

Secondary birch forest

Environmental protection "Gazprom". Environmental monitoring. GENERAL REQUIREMENTS 7.3.6 Among the basic partial indicators of the observed vegetation quality are : - Morphometric parameters (needle growth and length, leaf surface, etc.); - Condition-indicators (stock of the biomass , products); - Structural indicators of a biomass (ratio of biomass : overground / underground alive / dead)..

Impact assessment of facilities and distribution of gas springs on vegetation determine: Square of alienation territory for the construction; Felling of forests, bushes; Changes in the size of areas exposed to flooding, waterlogging, desiccation;- Changes in floristic diversity;
, as well as rare, endangered plant species,")
Changes in the number of main (dominant), as well as rare, endangered plant species, species listed in the Red Book; Changes in the spread of areas and area ratio of different types of vegetation; Changes in the boundaries of plant communities and other impact indicators.

7.3.7 Among the basic partial indicators of the observed state of landscapes are Areas prone to anthropogenic degradation, and indicators of biological diversity.

Impact assessment of facilities and gas distribution sources on landscapes identify : The area of violations of existing forms of natural relief and micro-relief; Changes in the parameters of surface runoff; Changes in the physical and mechanical, chemical and biological properties of soils; The area of deforestation, bush, other vegetation;

Changes in the conditions of natural runoff; Changes in agricultural landscapes areas (pastures, hay meadows); Other impact indicators.
18604-10-vegetation.ppt
- Количество слайдов: 65