

 Russia • • • Russia is the country of vast landscapes, vibrant life, beautiful contrasts, and interesting people. Taking an immense space , being home to people of so many different nationalities and traditions, Russia is often called a "bridge" between Europe and Asia, both and culturally and geographically. Russia is the largest country in the world. Ural mountains divide the Eurasian continent - and Russia - into Europe and Asia. One fourth of the Russian territory lies in Europe, the other part lies in Asia. Russia’s taking the area of 17. 1 million square kilometers - it’s like USA and Europe combined - and the country is 9000 kilometers from east to west and 5000 from north to south. The capital of Russia is Moscow and the second largest city is St. Petersburg (which is also called the "Northern capital"). The population is 147. 5 million people and three fourths live in the European part and one fourth lives in the Asian part of Russia (Siberia and Far East regions). Most of these people are Russians (81%) the others are Ukrainians, Tatars, Byelorussians, Polish, Germans, Jews, Caucasians. There about 120 ethnic groups in Russia who speak more than a hundred languages. Roughly 80 percent of Russians trace their ancestry to the Slavs who settled in the country 1500 years ago. Official language is Russian.
 Currency
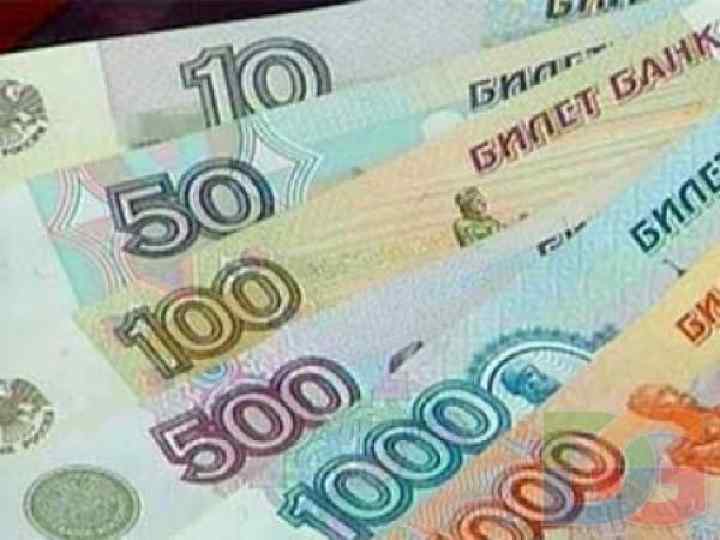
 Russian Ruble is the official currency of Russian Federation. It is also used as a medium of exchange in many former soviet republics. Russian ruble is one of the world's oldest currencies. It appeared in 15 th century during as called Silver Bum. At the time, Russian coins were made of silver. Soaring demand for silver across continental Europe resulted in growth of value of Russian silver coin to a point when they were no longer useful for purchases. People started splitting coins in halves. Russian word for "split" or "cut" is rubit'' and the half coins were called rubles. Even though Russian coins no longer come in halves, the name stuck on. Largest banknote is 5000 rubles. 1 Russian ruble = 0. 032751 U. S. dollars
 Russia's Foreign Trade Russia is an active participant in international commerce. From year to year Russia develops its customs legislation to improve cooperation with other countries. Annually products of foreign manufacturers expand their share on Russian market. Russian companies prefer to import high-technology equipment from developed countries and their interest is fortified by improvement of competition among them. Russia increases its potential becoming more overt foreign companies. For clear understanding Russia's foreign trade policy, it is necessary to consider export and import structure.
 Diagram #1 The structure of Russian exports
 • • Mineral commodity 70% Metals, precious stones and their products 13% Chemical sector's products 6% Machines, outfits and transport vehicles 5% Wood and cellulose and paper products 3% Food products and agricultural raw materials 2% Other goods 1%
 Mineral commodities are doubtless leaders among exported goods. Russia is one of the most resourced country that is why mineral commodities take great share in Russian export. However underdeveloped industrial construction does not allow to attain high indexes of machines and outfits export. Also there are problems in agricultural sector, that interfere to develop export of Food products abroad.
 Diagram #2 The structure of Russian imports
 • • Machines, outfits and transport vehicles 50% Food products and agricultural raw materials 16% Chemical sector's products 14% Metals, precious stones and their products 7% Textiles and textiles products 5% Wood and cellulose and paper products 3% Mineral commodity 2% Other goods 3%
 Machines and outfits domination in import is obvious on diagram 2 this is prove serious weakness and noncompetitiveness of Russian engineering industry. Only military industrial sector is traditionally developed because of high investments of government. Food industry in Russia is also undeveloped, foreign products compose 45% of Russian food market. In recent years main foreign trade indexes are changed to wide extent, mainly because of influence of world-wide economic trends. Obviously that changes of foreign trade indexes in the period of last four years correlates to prices of raw hydrocarbons such as oil, gas, coal. For example, drop in oil's prices leads to decrease of its export volume, and this in turn results to reduction of export volume index in general.
 Table 1 Main foreign trade indexes
 It is easy to notice dynamics of main foreign trade indexes at the diagram. Noticeable that lowest indexes are traced in 2009, this is conditioned by recession and oil price downturn. However, Russia is stepping out from crisis, and experts believe that positive dynamics will continue in 2011 either. Table 2 Changes of foreign trade indexes in 2010 to past years. Growth rate of foreign trade activity in 2010 is quite high, however indexes of 2010 fall behind of indexes of 2008. Russian foreign trade is trying to recover after recession 2009 and probably it will come up to indexes of 2008 in 2011.
 Trade partners According to the World Trade Association, Russia's exports by main destination were as follows: 1. European Union (27) 58. 7 2. China 5. 2 3. Ukraine 5. 0 4. Turkey 4. 7 5. Belarus 4. 3 For Russia imports by main origin 1. European Union (27) 44. 6 2. China 9. 4 3. Ukraine 6. 7 4. Japan 5. 7 5. Belarus 5. 0
 Trade between Russia and China
 Russian exports to China - U. S. $ 20. 3 billion, an increase of 21. 8%, Russia's imports from China - U. S. $ 39. 0 billion (71. 2%). Main export goods (over 84% of all deliveries): Energy production (crude oil and petroleum products, coal, stone), wood in the rough, sawn timber and wood pulp, raw materials and semi-finished steel (iron ore and concentrates), frozen fish, fertilizers, aircraft and parts thereof, unwrought nickel, synthetic rubber, and equipment for nuclear power plants, lactams, polymers of ethylene. The structure of imports form: machinery, equipment and transport vehicles - 49. 6%, textiles, glassware, footwear - 18. 5%. The share of metals and their products is 8. 6%, chemical products (7. 3%), foodstuffs and agricultural raw materials (3. 4%), hides, fur and articles thereof (1. 8%), timber and Pulp and paper products (1. 3%). Major imports (over 67% of total imports): products of light industry (textile, knitting and leather products, footwear and parts thereof), consumer electronics (computers, telephone equipment, televisions, etc. ), parts and components for electronic equipment , the production of general machinery (construction machinery, parts and components for vehicles, pump and compressor equipment), electrical appliances (washing machines, refrigeration, air conditioning, etc. ), electric equipment, production of metals (steel, pipe, flat-rolled products, hardware from non-alloy steel, etc. ), furniture and parts thereof; games and sports equipment, food products (fruits and vegetables, fish and seafood).
 THANK YOU